Philadelphia, PA, and Tulsa, OK, are both distinctive and fascinating cities, each with its own unique charm. Philly, known for its rich history and cultural diversity, is an urbanized metropolis on the East Coast, while Tulsa is a metropolitan city with a small-town feel, renowned for its Southern hospitality and scenic beauty. This article will provide a detailed head-to-head comparison of these cities across a range of aspects, including crime and safety, weather, cost of living, education, and many more.
Distance between
Philadelphia, PA and
Tulsa, OK : 1,159.2 miles
Philadelphia's population is larger by 283%. Its population has grown by 58,701 people (3.9%) since 2000. The population of Tulsa has grown by 18,352 people (4.7%) during that time.
Both cities have their challenges when it comes to crime. Philadelphia's crime rates are higher than national average, but they tend to be concentrated in specific neighborhoods, while other areas remain very safe. Tulsa's crime rates are somewhat lower than Philadelphia, but also higher than average. Like in Philadelphia, crime in Tulsa is not evenly distributed across the city. In both cities, public safety initiatives are constantly being implemented and they have seen reductions in crime rates over recent years.
Cost of Living
Generally, the cost of living in Philadelphia is much higher compared to Tulsa. Housing is particularly more expensive in Philly, followed by utilities, transportation, and groceries. Tulsa, with its affordable housing, utilities, and transportation costs, offers a lower cost of living, making it an attractive destination for individuals and families seeking to save on daily expenses.
Income Tax
Both Pennsylvania and Oklahoma have a state income tax, but Philadelphia residents also have a city wage tax. The tax rate in Philadelphia is higher overall, which can be a factor for people considering relocation.
Property Tax
Homeowners in Philadelphia face higher property taxes than those in Tulsa. Despite this, the tax burden is lessened by the relatively higher incomes in Philadelphia.
Sales Tax
Philadelphia has a higher sales tax rate, with a combined state and city tax of 8%, while Tulsa’s combined state and city sales tax rate is 8.517%. The slight difference is not significantly impactful for most consumers.
Income
Type
Philadelphia
Tulsa
Estimated median household income
$52,899
$51,008
Estimated per capita income
$32,707
$33,002
Cost of living index (U.S. average is 100)
105.4
86.5
If you make $50,000 in Tulsa, you will have to make $60,925 in Philadelphia to maintain the same standard of living.
Geographical Conditions
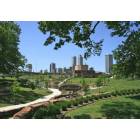
Philadelphia features a diversity of landscapes, from coastal areas along the Delaware River to verdant parks and urban skylines. Tulsa, being part of the Great Plains, offers rolling hills, the scenic Arkansas River, and beautiful parks.
Philadelphia is home to several nationally recognized schools and universities, making it an education hub. These include the University of Pennsylvania, Temple University, and Drexel University. Tulsa, while smaller, boasts the University of Tulsa and Oral Roberts University, highly regarded institutions known especially for their programs in law, business, and health sciences.
Philadelphia's economy is driven by sectors such as healthcare, education, and professional and business services. The job market in Philly is quite competitive. Tulsa's economy is once known for its oil industry, has now diversified into sectors like aerospace, finance, and technology. Job growth in Tulsa is expected to be slightly slower than the national average over the next decade.
Biggest Employers
Philadelphia's largest employers are the University of Pennsylvania and the Children's Hospital of Philadelphia. Other large employers include Comcast and Jefferson Health. In Tulsa, the largest employers are American Airlines, Saint Francis Health System, and the city government.
There were 1,553 building permits issued in Philadelphia in 2012 (1108 more than in 2011) compared to 652 building permits issued in Tulsa in 2012 (333 more than in 2011).
In Philadelphia (Philadelphia County), 85.2% voted for Democrats and 14.0% for Republicans in 2012 Presidential Election. In Tulsa (Tulsa County), 36.3% voted for Democrats and 63.7% for Republicans.
Elections
Type
Democrats
Republicans
Other
Year
Philadelphia
Tulsa
Philadelphia
Tulsa
Philadelphia
Tulsa
2020
81.2%
40.9%
17.9%
56.5%
0.9%
2.7%
2016
82.3%
35.6%
15.3%
58.4%
2.4%
6.1%
2012
85.2%
36.3%
14.0%
63.7%
0.8%
0.0%
2008
83.2%
37.8%
16.4%
62.2%
0.4%
0.0%
2004
80.6%
35.6%
19.4%
64.4%
0.0%
0.0%
2000
80.4%
37.3%
18.1%
61.3%
1.5%
1.3%
1996
77.4%
37.1%
16.0%
53.6%
6.6%
9.3%
Breakdown of population affiliated with a religious congregation
Type
Adherents
Congregations
Religion
Philadelphia
Tulsa
Philadelphia
Tulsa
CATHOLIC CHURCH
24.8%
8.1%
8.8%
3.1%
AMERICAN BAPTIST CHURCHES IN THE USA
3.8%
0.3%
6.7%
0.5%
MUSLIM ESTIMATE
2.6%
0.5%
3.1%
0.7%
SOUTHERN BAPTIST CONVENTION
2.2%
14.9%
9.9%
18.6%
EPISCOPAL CHURCH
0.8%
0.8%
3.8%
1.3%
EVANGELICAL LUTHERAN CHURCH IN AMERICA
0.6%
0.4%
3.1%
0.9%
PRESBYTERIAN CHURCH IN AMERICA
0.4%
0.1%
1.4%
0.3%
SEVENTH DAY ADVENTIST CHURCH
0.4%
0.4%
1.7%
1.1%
INTERNA PENTECO HOLINESS CHURCH
0.0%
0.7%
0.1%
0.7%
LUTHERAN CHURCH
0.0%
0.7%
0.5%
1.2%
NATIONAL ASSOCIATION FREE WILL BAPTISTS
0.0%
0.5%
0.0%
3.1%
Weather
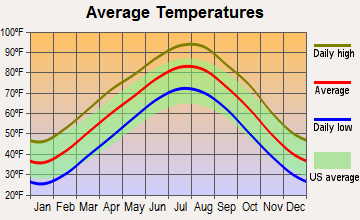
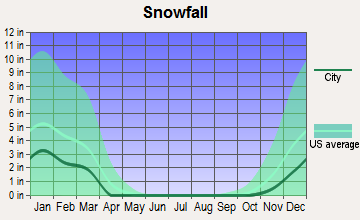
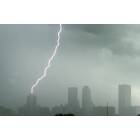
The weather in these two cities is significantly different. Philadelphia experiences a humid subtropical climate, with hot, muggy summers and chilly, snowy winters. Tulsa, on the other hand, experiences a humid subtropical climate as well, but with extreme temperature variations, with hot summers and quite cold winters, often with severe storms, tornadoes, and hailstorms.
Weather and climate
Type
Philadelphia
Tulsa
Temperature - Average
54.8°F
60.4°F
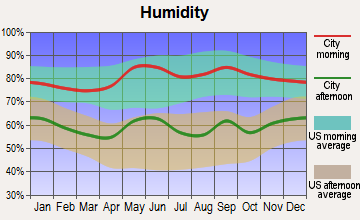
Humidity - Average morning or afternoon humidity
69.9%
73.8%
Humidity - Differences between morning and afternoon humidity
34%
33%
Humidity - Maximum monthly morning or afternoon humidity
82%
85%
Humidity - Minimum monthly morning or afternoon humidity
48%
52%
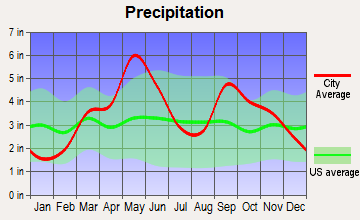
Precipitation - Yearly average
45.7 in
42.1 in
Snowfall - Yearly average
45.1 in
18.4 in
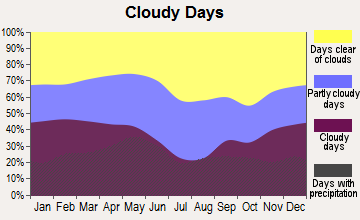
Clouds - Number of days clear of clouds
15.4%
21.1%
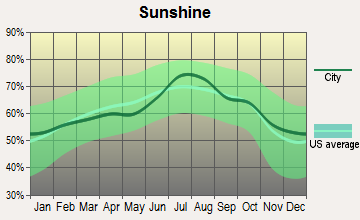
Sunshine amount - Average
59.8%
64.8%
Sunshine amount - Differences during a year
18%
24%
Sunshine amount - Maximum monthly
63%
74%
Sunshine amount - Minimum monthly
45%
50%
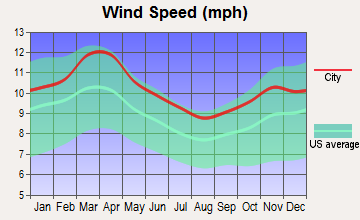
Wind speed - Average
10 mph
10.2 mph
Average climate in Philadelphia, Pennsylvania
Average climate in Tulsa, Oklahoma
Air pollution
Type
AQI
CO
NO2
OZONE
PB
PM10
PM25
SO2
Year
Philadelphia
Tulsa
Philadelphia
Tulsa
Philadelphia
Tulsa
Philadelphia
Tulsa
Philadelphia
Tulsa
Philadelphia
Philadelphia
Tulsa
Philadelphia
Tulsa
2018
99
88
0.37
0.24
10.7
N/A
24.3
28.6
N/A
0.004
17.2
N/A
9.2
11.6
0.9
0.4
2017
105
80
0.32
0.22
11.0
N/A
25.3
29.9
0.004
0.004
22.3
N/A
8.9
10.2
1.0
0.5
2016
99
86
0.30
0.24
13.6
N/A
25.1
29.1
0.007
0.005
23.2
N/A
9.5
9.5
1.4
0.5
2015
110
74
0.34
0.25
15.8
N/A
22.6
28.1
0.007
0.004
23.9
N/A
10.5
8.6
1.8
0.8
2014
105
74
0.34
0.16
16.8
N/A
23.1
29.2
0.027
0.005
23.0
N/A
11.7
9.2
2.2
0.3
2013
105
85
0.27
0.21
16.7
N/A
22.5
29.8
0.029
0.005
31.0
N/A
10.5
10.1
1.5
0.5
2012
111
103
0.29
0.21
17.8
N/A
23.0
32.4
0.040
0.007
14.6
N/A
11.7
11.7
1.5
0.7
2011
113
108
0.28
0.27
19.9
N/A
24.3
33.8
0.039
0.005
16.9
N/A
9.8
13.8
1.9
0.8
2010
116
83
0.30
0.26
20.1
N/A
23.0
30.1
0.009
0.004
21.7
N/A
12.2
12.2
2.6
0.7
2009
95
88
0.32
0.26
18.9
N/A
19.7
29.8
0.011
0.004
18.0
N/A
11.9
12.2
2.9
0.7
2008
112
71
0.30
N/A
19.8
N/A
19.1
26.7
0.010
0.007
16.8
N/A
13.9
N/A
3.8
N/A
2007
128
77
0.42
0.32
21.6
N/A
23.3
28.8
0.019
0.007
17.5
N/A
12.3
N/A
4.2
0.8
2006
112
95
0.52
N/A
21.4
N/A
22.5
32.9
0.016
N/A
18.3
N/A
13.1
N/A
4.2
N/A
2005
108
84
0.58
N/A
24.4
N/A
20.8
28.9
0.018
N/A
19.7
N/A
N/A
N/A
5.0
N/A
2004
102
71
0.58
N/A
24.1
N/A
18.9
27.5
0.023
N/A
19.1
N/A
N/A
N/A
5.2
N/A
2003
103
94
0.62
N/A
23.8
N/A
19.7
29.2
0.034
N/A
19.6
N/A
N/A
N/A
5.4
N/A
2002
128
85
0.56
0.83
26.8
7.8
21.2
27.7
0.035
N/A
18.3
N/A
N/A
N/A
4.9
N/A
2001
119
102
0.63
0.75
27.9
14.4
20.0
30.6
0.014
N/A
20.6
N/A
N/A
N/A
5.6
N/A
2000
111
101
0.68
0.69
26.7
15.3
19.0
28.9
0.034
N/A
N/A
N/A
N/A
N/A
5.5
N/A
Natural disasters
Type
Philadelphia
Tulsa
Tornado activity compared to U.S. average
96.6%
277.6%
Earthquake activity compared to U.S. average
34.4%
901.9%
Natural disasters compared to U.S. average
22%
34%
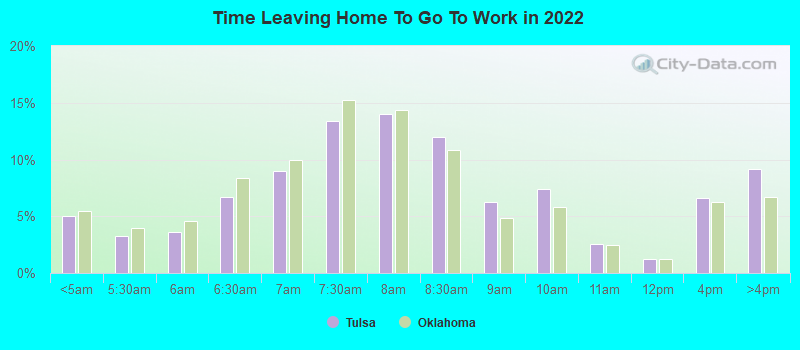
Transportation
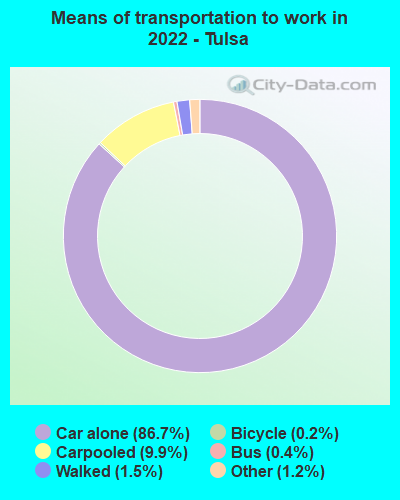
Philadelphia has an extensive public transportation system, including subways, buses, and trams that provide ample commuting options. Tulsa relies mostly on cars for commuting, with a much smaller public transit system and higher average commute times.
Transport
Type
Philadelphia
Tulsa
Amtrak stations
2
1
Amtrak stations nearby
3
1
FAA registered aircraft
347
808
FAA registered aircraft manufacturers and dealers
2
35
Means of transportation to work
Type
Philadelphia
Tulsa
Bicycle
2%
0.1%
Bus
11.7%
0.1%
Carpooled
8.7%
9%
Car alone
60%
87.9%
Motorcycle
0.1%
0.1%
Railroad
0.7%
0%
Streetcar
4.2%
0%
Subway
2.8%
0%
Taxicab
0.2%
0.1%
Walked
7.8%
1.4%
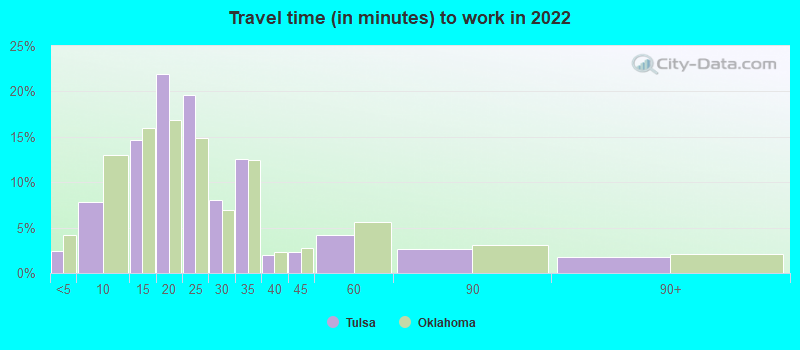
Average travel time to work
Type
Philadelphia
Tulsa
Average
34.3 min
23.8 min
Other means
28.2 min
19.2 min
Public transportation
45.6 min
40.1 min
Private vehicle occupancy
Type
Philadelphia
Tulsa
Average
1.2
1.2
Drove alone
86.4%
88.9%
In 2 person carpool
10.2%
8.7%
In 3 person carpool
2%
1.5%
In 4 person carpool
0.9%
0.3%
In 5-6 person carpool
0.3%
0.5%
In 7+ person carpool
0.2%
0.1%
How many people usually rode to work in the car, truck or van.
Real Estate
Real estate in Philadelphia is more expensive than Tulsa, with housing prices well above the national average. Housing in Tulsa is quite affordable, with prices well below the national average, making it attractive for homebuyers on a budget.
Neighborhoods
Philadelphia has a range of diverse neighborhoods, from the historic charm of Old City to the contemporary vibe of Fishtown. Tulsa, despite being smaller, also offers a diverse range of neighborhoods with options suitable for every lifestyle, from Downtown's urban living to Brookside's mix of residential and commercial areas.
Houses and residents
Type
Philadelphia
Tulsa
Houses
733,015
194,402
Average household size (people)
2.5
2.3
Median year apartment built
1953
1975
Median year house/condo built
1947
1969
Length of stay in the house since moving in
16 years
12.9 years
Houses occupied
660,921 (90.2%)
173,943 (89.5%)
Houses occupied by owners
348,935 (52.8%)
89,307 (51.3%)
Houses occupied by renters
311,986 (47.2%)
84,636 (48.7%)
Median rent asked for vacant for-rent units
$1,301
$899.30
Median monthly housing costs
$1,096
$897
Median price asked for vacant for-sale houses and condos
$260,453
$163,212
Estimated median house or condo value
$220,700
$172,000
Median numbers of rooms
5.5
5.2
Median number of rooms in apartments
4.2
4.1
Median number of rooms in houses and condos
6.2
6.4
Median house price - detached houses
$292,974
$247,367
Median house price - in 2-unit structures
$357,727
$496,968
Median house price - in 3-to-4-unit structures
$264,854
$94,964
Median house price - in 5 or more unit structures
$442,314
$176,274
Median house price - mobile homes
$163,609
$73,235
Median house price - occupied boats, rvs, vans etc.
$93,218
$166,906
Median house price - Townhouses or other attached units
$239,791
$184,309
Median house price - All housing units
$256,324
$241,263
Median house age
73
49
Renting percentage
45.9%
46.5%
Housing density (houses/condos per square mile)
5,426.1
1,064.4
House value disparities
38.4%
41.8%
Household income disparities
49.5%
48.1%
Median household income for houses/condes with a mortgage
$86,108
$84,820
Median household income for apartments without a mortgage
$44,075
$57,403
Housing units without a mortgage
8,484 (4%)
855 (1.7%)
Housing units with both a second mortgage and home equity loan
18,029 (8.5%)
2,464 (4.8%)
Housing units with a mortgage
202,880 (96%)
50,494 (98.3%)
Housing units with a home equity loan
1,280 (0.6%)
93 (0.2%)
Housing units with a second mortgage
22,966 (10.9%)
3,580 (7%)
House/condo owner moved in on average (years ago)
15
11
House/condo renter moved in on average (years ago)
3
1
Housing units lacking complete kitchen facilities
3.7%
2.9%
Housing units lacking complete plumbing facilities
3.3%
1.7%
Housing units in structures
Housing units in structures
Philadelphia
Tulsa
One, detached
9.9%
62.9%
One, attached
55.9%
2.8%
Two
7.4%
1.9%
3 or 4
6.7%
5.0%
5 to 9
2.8%
6.8%
10 to 19
2.5%
9.2%
20 to 49
3.1%
4.4%
50 or more
11.2%
5.8%
Mobile homes
0.3%
1.1%
Boats, RVs, vans, etc.
0.1%
0.2%
Median real estate property taxes paid for housing units
Self-employed workers in own not incorporated business
29,270
13,964
State government workers
16,901
5,897
Unpaid family workers
570
284
Industries and Occupations
Philadelphia has a diverse economy with industries like healthcare, education, financial services, and information technology providing the most jobs. Tulsa’s economy is diverse as well, but with a focus on energy, aerospace, telecommunications, and manufacturing industries providing the bulk of the jobs.
Both cities provide excellent healthcare facilities. Philadelphia has renowned healthcare institutions like the Children's Hospital of Philadelphia and Penn Medicine. Tulsa also has high-quality healthcare facilities, including Saint Francis Hospital and the Oklahoma Heart Institute.
Health (county statistics)
Type
Philadelphia
Tulsa
General health status score of residents in this county from 1 (poor) to 5 (excellent)
Infrastructure wise, Philadelphia is more developed, having the oldest and one of the largest subway systems, extensive road networks, and boasting the Philadelphia International Airport. Tulsa is not as urbanized, but it does offer good road connectivity, including several major highways, and the Tulsa International Airport.
Infrastructure
Type
Philadelphia
Tulsa
Hospitals
91
45
TV stations
24
20
Arenas or stadiums
7
2
Bank branches located here
329
160
Bank institutions located here
46
40
Main business address for public companies
47
27
Drinking water stations with no reported violations in the past
1
0
Drinking water stations with reported violations in the past
HMDA - Conventional home purchase loans - Applications denied
Year
Philadelphia
Tulsa
1999
3,294
2,135
2000
3,202
1,531
2001
2,480
1,216
2002
2,012
1,106
2003
3,268
1,243
2004
4,525
1,354
2005
6,637
1,709
2006
7,517
1,756
2007
5,750
1,014
2008
2,745
517
2009
1,390
327
Culture and Food
Philadelphia stands out for its rich history, vibrant arts scene, and iconic food like Philly cheesesteaks. Tulsa also has a thriving arts scene characterized by music and performing arts, with a food culture characterized by BBQ, comfort food, and a growing variety of international cuisines.
Sports Teams
Sports lovers will find Philadelphia home to teams in all major sports leagues, including the Phillies (MLB), Eagles (NFL), Sixers (NBA), and Flyers (NHL). Tulsa, though not housing teams from the major sports leagues, does boast successful minor league and college sports teams.


 Philadelphia, PA
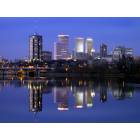
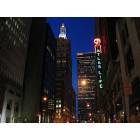
 Tulsa, OK