Both Philadelphia, PA, and Bronx, NY, offer a vibrant urban living experience with their own unique appeal. While Bronx is part of the bustling NYC metropolitan area, enveloped by the vibrant city culture and diverse population, Philadelphia boasts a blend of both city lifestyle and historical charm. Depending on personal preferences, both cities make for captivating places to live or visit. This comparison takes into account various facets such as the cost of living, education, crime rates, weather, and cultural experiences, to provide a detailed comparison of living or visiting the two cities.
When it comes to safety, both Philadelphia and the Bronx have struggled with higher crime rates compared to the national average. However, Philadelphia's crime rates have been trending downward in recent years. Neighborhoods like Center City, Queen Village, and Fairmount are considered safe and secure. Meanwhile, crime in the Bronx is higher, but like most regions, there are safer areas like Riverdale and Country Club. It's essential to research specific neighborhoods before deciding on relocation or visiting.
Cost of Living
Living in the Bronx tends to be more costly than Philadelphia. Housing is the biggest factor in the cost of living difference. The median home cost in the Bronx is significantly higher compared to Philly. The other costs, such as groceries, utilities, and transportation are also slightly higher in the Bronx.
Income Tax
Income tax also favors Philadelphia, with Pennsylvania featuring a flat state income tax rate of 3.07%, plus a city tax. New York has a progressive state income tax, which combined with NYC city tax could result in higher income taxes for Bronx residents.
Property Tax
On the property tax front, Philadelphia’s rates are generally higher, while the Bronx benefits from New York City's relatively lower property tax rates.
Sales Tax
Pennsylvania state sales tax is relatively lower (6%) compared to New York state sales tax (8.875%), including NYC's additional tax, which applies to Bronx residents. Specific items such as clothing and shoes valued under $110 are, however, tax-exempt in the Bronx.
Income
Type
Philadelphia
Bronx
Estimated median household income
$52,899
$43,011
Estimated per capita income
$32,707
$23,354
Cost of living index (U.S. average is 100)
105.4
172.8
If you make $50,000 in Philadelphia, you will have to make $81,973 in Bronx to maintain the same standard of living.
Geographical Conditions
Philadelphia and the Bronx differ geographically. Philadelphia is landlocked with the Delaware River to the east. It has more green spaces and a larger geographical footprint. The Bronx, bordered by the Hudson River on the west and Long Island Sound on the east, offers more waterfront and compact urban living.
Geographical information
Type
Philadelphia
Bronx
Land area
135.1 sq. miles
42 sq. miles
Population density
11,668 people per sq. mile
32,928 people per sq. mile
Elevation
40 feet
120 feet
Relative area comparison
Philadelphia, PA Bronx, NY
Education
Philadelphia is home to over 100 colleges and universities, including Ivy League school University of Pennsylvania. On the other hand, the Bronx has notable institutions like Fordham University and Manhattan College. In terms of K-12 public education, both cities face challenges but are implementing various educational reforms to improve the quality of education.
Both cities have diverse economies. Philadelphia's economy is driven by sectors like healthcare, education, and professional and business services. The Bronx economy is largely influenced by sectors like healthcare, retail trade, and educational services. Bronx being part of NYC, provides proximity to one of the world's largest economic hubs.
Biggest Employers
In Philadelphia, the biggest employers include The University of Pennsylvania, Comcast, and Children’s Hospital of Philadelphia. While in the Bronx, major employers include Montefiore Medical Center, Bronx-Lebanon Hospital Center, and retail giants such as Macy’s and Target.
In Philadelphia (Philadelphia County), 85.2% voted for Democrats and 14.0% for Republicans in 2012 Presidential Election. In Bronx (Bronx County), 91.9% voted for Democrats and 8.1% for Republicans.
Elections
Type
Democrats
Republicans
Other
Year
Philadelphia
Bronx
Philadelphia
Bronx
Philadelphia
Bronx
2020
81.2%
83.7%
17.9%
16.0%
0.9%
0.3%
2016
82.3%
88.6%
15.3%
9.5%
2.4%
2.0%
2012
85.2%
91.9%
14.0%
8.1%
0.8%
0.0%
2008
83.2%
89.0%
16.4%
11.0%
0.4%
0.0%
2004
80.6%
82.9%
19.4%
16.5%
0.0%
0.6%
2000
80.4%
86.5%
18.1%
11.8%
1.5%
1.7%
1996
77.4%
85.8%
16.0%
10.5%
6.6%
3.7%
Breakdown of population affiliated with a religious congregation
Type
Adherents
Congregations
Religion
Philadelphia
Bronx
Philadelphia
Bronx
CATHOLIC CHURCH
24.8%
25.5%
8.8%
11.5%
AMERICAN BAPTIST CHURCHES IN THE USA
3.8%
0.7%
6.7%
4.4%
MUSLIM ESTIMATE
2.6%
2.8%
3.1%
3.9%
SOUTHERN BAPTIST CONVENTION
2.2%
0.2%
9.9%
2.4%
EPISCOPAL CHURCH
0.8%
0.4%
3.8%
3.7%
EVANGELICAL LUTHERAN CHURCH IN AMERICA
0.6%
0.2%
3.1%
2.6%
PRESBYTERIAN CHURCH IN AMERICA
0.4%
0.0%
1.4%
0.2%
SEVENTH DAY ADVENTIST CHURCH
0.4%
0.7%
1.7%
6.5%
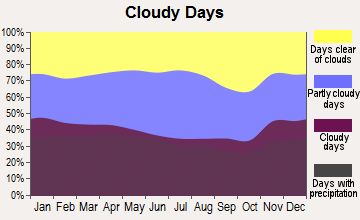
Weather
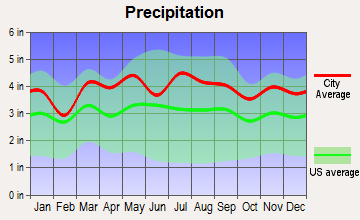
Both cities experience a humid subtropical climate, with hot summers and moderately cold winters. However, the Bronx tends to have slightly harsher winters, with more annual snowfall. Philadelphia experiences consistent precipitation throughout the year, but the Bronx sees a slight peak during the summer months.
Weather and climate
Type
Philadelphia
Bronx
Temperature - Average
54.8°F
54.7°F
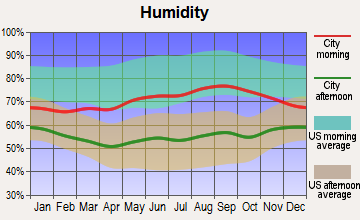
Humidity - Average morning or afternoon humidity
69.9%
67.2%
Humidity - Differences between morning and afternoon humidity
34%
26.4%
Humidity - Maximum monthly morning or afternoon humidity
82%
75.6%
Humidity - Minimum monthly morning or afternoon humidity
48%
49.2%
Precipitation - Yearly average
45.7 in
47 in
Snowfall - Yearly average
45.1 in
54.5 in
Clouds - Number of days clear of clouds
15.4%
16.5%
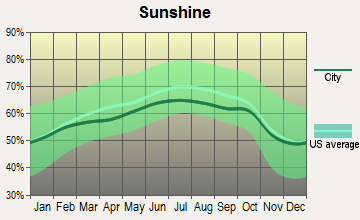
Sunshine amount - Average
59.8%
60.2%
Sunshine amount - Differences during a year
18%
20%
Sunshine amount - Maximum monthly
63%
64%
Sunshine amount - Minimum monthly
45%
44%
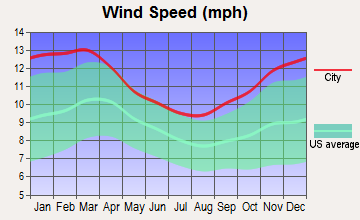
Wind speed - Average
10 mph
10.7 mph
Average climate in Philadelphia, Pennsylvania
Average climate in Bronx, New York
Air pollution
Type
AQI
CO
NO2
OZONE
PB
PM10
PM25
SO2
Year
Philadelphia
Bronx
Philadelphia
Bronx
Philadelphia
Bronx
Philadelphia
Bronx
Philadelphia
Bronx
Philadelphia
Bronx
Philadelphia
Bronx
Philadelphia
Bronx
2018
99
102
0.37
0.31
10.7
15.8
24.3
24.4
N/A
N/A
17.2
N/A
9.2
7.4
0.9
0.6
2017
105
100
0.32
0.04
11.0
15.7
25.3
24.6
0.004
N/A
22.3
N/A
8.9
7.0
1.0
0.6
2016
99
98
0.30
0.30
13.6
16.4
25.1
24.6
0.007
N/A
23.2
N/A
9.5
7.2
1.4
0.8
2015
110
105
0.34
0.28
15.8
18.0
22.6
23.6
0.007
N/A
23.9
N/A
10.5
8.6
1.8
1.4
2014
105
99
0.34
0.32
16.8
18.0
23.1
23.6
0.027
N/A
23.0
N/A
11.7
8.4
2.2
1.7
2013
105
103
0.27
0.39
16.7
18.9
22.5
23.5
0.029
N/A
31.0
N/A
10.5
9.3
1.5
2.1
2012
111
104
0.29
0.44
17.8
18.8
23.0
23.9
0.040
N/A
14.6
N/A
11.7
9.7
1.5
3.1
2011
113
113
0.28
0.46
19.9
20.9
24.3
22.1
0.039
N/A
16.9
N/A
9.8
11.6
1.9
4.5
2010
116
113
0.30
0.53
20.1
20.2
23.0
23.7
0.009
N/A
21.7
N/A
12.2
10.8
2.6
4.7
2009
95
107
0.32
0.53
18.9
22.3
19.7
19.5
0.011
N/A
18.0
N/A
11.9
10.8
2.9
5.4
2008
112
114
0.30
0.53
19.8
23.3
19.1
19.9
0.010
0.013
16.8
N/A
13.9
12.1
3.8
5.9
2007
128
122
0.42
0.60
21.6
24.6
23.3
19.1
0.019
0.016
17.5
N/A
12.3
13.2
4.2
7.0
2006
112
120
0.52
0.50
21.4
25.0
22.5
18.9
0.016
0.018
18.3
N/A
13.1
12.8
4.2
7.0
2005
108
115
0.58
0.60
24.4
27.0
20.8
17.8
0.018
N/A
19.7
N/A
N/A
N/A
5.0
9.3
2004
102
109
0.58
0.62
24.1
25.6
18.9
16.7
0.023
0.030
19.1
N/A
N/A
N/A
5.2
8.8
2003
103
110
0.62
0.75
23.8
27.4
19.7
17.1
0.034
0.022
19.6
26.9
N/A
N/A
5.4
8.9
2002
128
124
0.56
0.67
26.8
27.9
21.2
17.4
0.035
0.008
18.3
25.0
N/A
N/A
4.9
8.6
2001
119
126
0.63
0.66
27.9
30.0
20.0
17.8
0.014
0.020
20.6
22.8
N/A
N/A
5.6
10.0
2000
111
115
0.68
0.68
26.7
29.4
19.0
16.0
0.034
0.022
N/A
22.2
N/A
N/A
5.5
10.2
Natural disasters
Type
Philadelphia
Bronx
Tornado activity compared to U.S. average
96.6%
58.3%
Earthquake activity compared to U.S. average
34.4%
31%
Natural disasters compared to U.S. average
22%
14%
Transportation
Public transit is a major benefit for both locales. Philadelphia's SEPTA offers bus, trolley, subway, and commuter rail services. Meanwhile, Bronx residents take advantage of NYC's MTA services, including subway, buses, and Metro-North Railroad. Bronx proximity to Manhattan, however, leads to shorter commute times for many residents.
Transport
Type
Philadelphia
Bronx
Amtrak stations
2
0
Amtrak stations nearby
3
3
FAA registered aircraft
347
39
FAA registered aircraft manufacturers and dealers
2
0
Means of transportation to work
Type
Philadelphia
Bronx
Bicycle
2%
0.2%
Bus
11.7%
15.6%
Carpooled
8.7%
9.3%
Car alone
60%
27%
Railroad
0.7%
2%
Streetcar
4.2%
0.2%
Subway
2.8%
34.6%
Taxicab
0.2%
1.3%
Walked
7.8%
7.2%
Average travel time to work
Type
Philadelphia
Bronx
Average
34.3 min
44.2 min
Real Estate
Philadelphia’s real estate tends to be more affordable compared to the Bronx. While the Bronx has a high percentage of renters, Philadelphia has a higher homeownership rate. Properties in Philadelphia, from historic row houses to modern apartments, generally offer more space for your money.
Neighborhoods
Both cities offer a diversity of neighborhoods. In Philadelphia, there's the sophistication of Rittenhouse, the cultural hotpot of South Philly, or the trendy Fishtown. The Bronx offers similarly diverse areas like the affluent Riverdale, Yankee Stadium's bustling streets, or City Island's coastal charm.
Houses and residents
Type
Philadelphia
Bronx
Houses
733,015
490,659
Average household size (people)
2.5
2.8
Houses occupied
660,921 (90.2%)
463,212 (94.4%)
Houses occupied by owners
348,935 (52.8%)
90,522 (19.5%)
Houses occupied by renters
311,986 (47.2%)
372,690 (80.5%)
Median rent asked for vacant for-rent units
$1,301
$1,273
Median price asked for vacant for-sale houses and condos
$260,453
$708,992
Estimated median house or condo value
$220,700
$465,000
Median number of rooms in apartments
4.2
3.7
Median number of rooms in houses and condos
6.2
5.1
Renting percentage
45.9%
80.7%
Housing density (houses/condos per square mile)
5,426.1
11,675
Household income disparities
49.5%
50.2%
Housing units without a mortgage
8,484 (4%)
12,021 (34%)
Housing units with both a second mortgage and home equity loan
18,029 (8.5%)
105 (0.3%)
Housing units with a mortgage
202,880 (96%)
23,339 (66%)
Housing units with a home equity loan
1,280 (0.6%)
2,053 (5.8%)
Housing units with a second mortgage
22,966 (10.9%)
2,159 (6.1%)
Housing units lacking complete kitchen facilities
3.7%
1.4%
Housing units lacking complete plumbing facilities
Self-employed workers in own not incorporated business
29,270
16,572
State government workers
16,901
14,515
Unpaid family workers
570
1,000
Industries and Occupations
Key industries in Philadelphia include education, healthcare, finance, information technology, and manufacturing. In the Bronx, the largest industries are healthcare & social assistance, retail trade, and education. The diverse business environment in either city offers a wide range of occupational choices.
Both cities have robust healthcare provisions. Philadelphia has globally renowned hospitals such as the University of Pennsylvania Hospital and Children’s Hospital of Philadelphia. In the Bronx, Montefiore Medical Center and Bronx-Lebanon Hospital offer a broad range of health services.
Health (county statistics)
Type
Philadelphia
Bronx
General health status score of residents in this county from 1 (poor) to 5 (excellent)
Infrastructure in Philadelphia is generally more extensive, given its status as a standalone city, compared to the Bronx, a borough of NYC. Philadelphia’s infrastructure includes notable bridges, extensive highway system, and a large port. The Bronx, while lacking standalone infrastructure, benefits from the overall NYC infrastructure system, such as bridges, subways and airports.
Infrastructure
Type
Philadelphia
Bronx
Hospitals
91
57
TV stations
24
30
Bank branches located here
329
118
Bank institutions located here
46
24
Main business address for public companies
47
2
Drinking water stations with no reported violations in the past
1
1
Drinking water stations with reported violations in the past
9
4
Schools
School facilities
Type
Philadelphia
Bronx
Private elementary/middle schools
115
54
Private high schools
42
20
Public elementary/middle schools
209
285
Public high schools
97
155
Colleges/Universities
43
9
Culture and Food
Both cities boast rich cultural heritage and dining scenes. Philadelphia is known for arts, culture, historic sites, and its iconic Philly cheesesteak. The Bronx offers a taste of NYC culture with a rich multicultural community, unique NYC-style pizza, and global cuisine, especially Latin American and Italian food.
Sports Teams
Philadelphia is home to major sports franchises such as the Eagles (NFL), Phillies (MLB), 76ers (NBA), and the Flyers (NHL). Meanwhile, the Bronx claims one of the most celebrated teams in baseball history, the New York Yankees.


 Philadelphia, PA
 Bronx, NY