Oklahoma City, OK, and Little Rock, AR, are two vibrant American cities each with their unique charm and challenges. Their personalities are distinctly different, with Oklahoma City offering an extensive rural-suburban mix setting, while Little Rock offers a mix of city living and small-town charm. Differences can also be found in weather, cost of living, educational opportunities, economy, taxation, cultural experiences, and sports teams. The analysis below provides a comprehensive look into these aspects for both cities to give a clearer picture to those considering relocation or visiting as tourists.
Distance between
Oklahoma City, OK and
Little Rock, AR : 298.6 miles
Oklahoma City's population is larger by 241%. Its population has grown by 181,593 people (35.9%) since 2000. The population of Little Rock has grown by 18,865 people (10.3%) during that time.
When considering crime and safety, both cities have their concerns. According to NeighborhoodScout, Oklahoma City, OK, has a crime rate higher than 77% of the state's cities and towns. However, it's worthwhile noting that the likelihood of being a victim of violent crime is 1 in 143. In Little Rock, AR, the crime rate is higher than in Oklahoma City. The chance of being a victim of violent crime in Little Rock is 1 in 72, making it one of the states with high crime rates.
City-data.com crime index counts serious crimes and violent crime more heavily. It adjusts for the number of visitors and daily workers commuting into cities. (higher means more crime, U.S. average = 301.1)
City-data.com crime index counts serious crimes and violent crime more heavily. It adjusts for the number of visitors and daily workers commuting into cities. (higher means more crime, U.S. average = 301.1)
Sex Offenders
According to our data, there are 1,379 registered sex offenders living in Oklahoma City and 478 registered sex offenders living in . The ratio of residents to sex offenders in Oklahoma City is 463 to 1; the ratio in Little Rock is 415 to 1. The number of registered sex offenders compared to the number of residents in Oklahoma City is near to than in Little Rock.
Cost of Living
The cost of living in these two cities varies noticeably. According to bestplaces.net, the cost of living in Oklahoma City, OK, is lower than the national average, with housing being the most significant factor. In contrast, Little Rock, AR, while still below the national average, shows a higher cost of living than Oklahoma City, mainly in housing costs and associated expenses.
Income Tax
Both cities have income taxes levied at the state level. Oklahoma's top personal income tax rate is 5%, while Arkansas's top rate is 6.9%.
Property Tax
Oklahoma City boasts low property taxes, with an average county rate of 0.87%. On the other hand, Little Rock's property taxes are among the lowest in the country, averaging a 0.63% county rate.
Sales Tax
Oklahoma City has a 4.5% city sales tax and 4.5% state sales tax. Little Rock has a 6.5% state sales tax and a city tax of 1.5%, which is slightly higher than in Oklahoma City.
Income
Type
Oklahoma City
Little Rock
Estimated median household income
$59,214
$53,565
Estimated per capita income
$31,630
$39,600
Cost of living index (U.S. average is 100)
85.4
85.1
If you make $50,000 in Little Rock, you will have to make $50,176 in Oklahoma City to maintain the same standard of living.
Geographical Conditions
Located in the Great Plains, Oklahoma City has relatively flat terrain, perfect for outdoor activities. Little Rock has a more varied geography, with mountains to the west, flat plains in the east, and the Arkansas River running through it.
Both cities offer many educational opportunities. Oklahoma City is home to many universities and colleges, including Oklahoma City University and the University of Oklahoma. On the other hand, Little Rock offers prestigious universities like the University of Arkansas at Little Rock and Philander Smith College.
In terms of work and economy, Oklahoma City boasts a healthy job market with strong sectors in aviation, energy, and health care. Recently, there has been a surge in technology enterprises. Little Rock is Arkansas's economic center, with primary sectors in health care, government, and banking.
Biggest Employers
Some of the biggest employers in Oklahoma City include the Hobby Lobby Stores, Chesapeake Energy Corporation, and Devon Energy Corporation. In Little Rock, the largest employers are the state government, Baptist Health Medical Center-Little Rock, and CHI St. Vincent Infirmary.
There were 4,127 building permits issued in Oklahoma City in 2012 (2834 more than in 2011) compared to 666 building permits issued in Little Rock in 2012 (341 more than in 2011).
In Oklahoma City (Oklahoma County), 41.7% voted for Democrats and 58.3% for Republicans in 2012 Presidential Election. In Little Rock (Pulaski County), 54.7% voted for Democrats and 43.3% for Republicans.
Elections
Type
Democrats
Republicans
Other
Year
Oklahoma City
Little Rock
Oklahoma City
Little Rock
Oklahoma City
Little Rock
2020
48.1%
60.5%
49.2%
37.8%
2.7%
1.7%
2016
41.2%
56.1%
51.7%
38.3%
7.1%
5.6%
2012
41.7%
54.7%
58.3%
43.3%
0.0%
2.0%
2008
41.6%
55.3%
58.4%
43.7%
0.0%
0.9%
2004
35.8%
55.2%
64.2%
44.4%
0.0%
0.4%
2000
36.6%
53.8%
62.3%
44.0%
1.1%
2.2%
1996
36.5%
58.8%
54.7%
35.1%
8.8%
6.2%
Breakdown of population affiliated with a religious congregation
Type
Adherents
Congregations
Religion
Oklahoma City
Little Rock
Oklahoma City
Little Rock
SOUTHERN BAPTIST CONVENTION
20.7%
17.8%
20.0%
21.0%
CATHOLIC CHURCH
8.5%
6.3%
3.0%
2.7%
EPISCOPAL CHURCH
0.7%
1.1%
1.3%
1.6%
INTERNA PENTECO HOLINESS CHURCH
0.7%
0.0%
2.9%
0.0%
LUTHERAN CHURCH
0.5%
0.5%
1.0%
1.3%
SEVENTH DAY ADVENTIST CHURCH
0.4%
0.4%
1.5%
0.9%
AMERICAN BAPTIST CHURCHES IN THE USA
0.3%
0.0%
0.1%
0.0%
MUSLIM ESTIMATE
0.3%
0.2%
0.6%
0.4%
AMERICAN BAPTIST ASSOCIATION
0.1%
1.7%
0.7%
4.0%
Weather
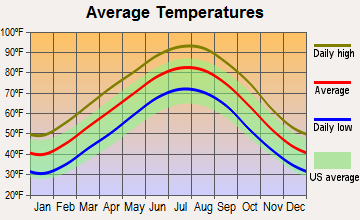
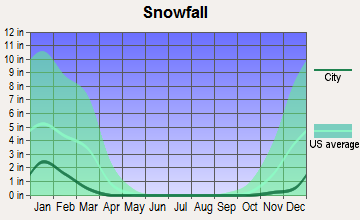
Weather-wise, Oklahoma City experiences more extreme weather changes than Little Rock. Oklahoma City is susceptible to tornadoes due to its location in the Great Plains region. Little Rock, on the other hand, experiences milder winter weather, but summers can be humid and hot, with average highs reaching up to the 90s in the warmest months.
Weather and climate
Type
Oklahoma City
Little Rock
Temperature - Average
60.1°F
62.3°F
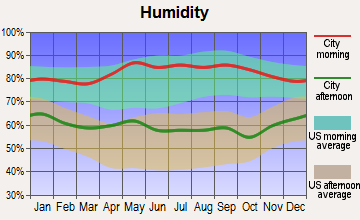
Humidity - Average morning or afternoon humidity
73.1%
76.2%
Humidity - Differences between morning and afternoon humidity
35%
35%
Humidity - Maximum monthly morning or afternoon humidity
85%
88%
Humidity - Minimum monthly morning or afternoon humidity
50%
53%
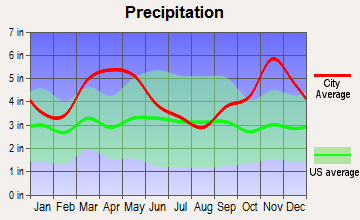
Precipitation - Yearly average
35.7 in
51.4 in
Snowfall - Yearly average
17.2 in
9.4 in
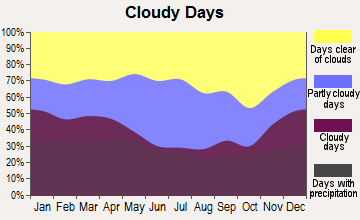
Clouds - Number of days clear of clouds
23.1%
19.8%
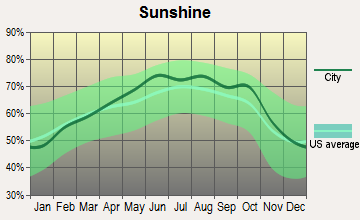
Sunshine amount - Average
72.1%
74%
Sunshine amount - Differences during a year
21%
30%
Sunshine amount - Maximum monthly
79%
82%
Sunshine amount - Minimum monthly
58%
52%
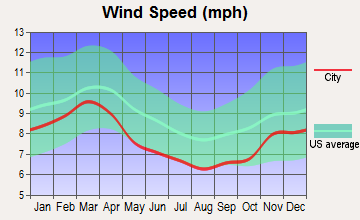
Wind speed - Average
12.3 mph
7.6 mph
Average climate in Oklahoma City, Oklahoma
Average climate in Little Rock, Arkansas
Air pollution
Type
AQI
CO
NO2
OZONE
PB
PM10
PM25
SO2
Year
Oklahoma City
Little Rock
Oklahoma City
Little Rock
Oklahoma City
Little Rock
Oklahoma City
Little Rock
Oklahoma City
Oklahoma City
Oklahoma City
Little Rock
Oklahoma City
Little Rock
2018
85
67
0.29
0.29
6.6
7.3
31.9
24.7
0.002
N/A
21.3
N/A
9.6
9.2
0.0
0.6
2017
82
70
0.32
0.41
6.7
7.6
33.0
25.5
0.002
N/A
20.7
N/A
8.9
9.5
0.0
0.6
2016
72
64
0.29
0.30
6.6
7.9
31.9
25.4
0.002
N/A
19.4
N/A
8.5
8.7
0.2
0.6
2015
76
64
0.24
0.31
7.0
8.6
31.5
22.8
0.002
N/A
19.1
N/A
7.8
9.0
0.5
1.1
2014
84
69
0.15
0.35
7.1
8.9
32.4
22.6
0.002
N/A
N/A
N/A
8.7
9.4
0.1
1.2
2013
84
70
0.14
0.39
8.6
9.8
32.8
24.7
0.002
N/A
N/A
N/A
9.3
9.5
0.2
1.3
2012
97
81
0.13
0.47
9.4
10.6
34.0
25.8
0.007
N/A
N/A
N/A
7.9
9.9
0.3
1.3
2011
107
81
0.24
0.45
9.9
10.0
36.3
25.5
0.003
N/A
N/A
N/A
9.9
11.3
0.8
1.4
2010
81
72
0.30
0.45
8.8
10.0
31.7
24.8
0.002
N/A
N/A
N/A
9.8
N/A
0.7
1.3
2009
82
62
0.52
0.42
8.1
9.1
31.9
22.0
0.002
N/A
N/A
N/A
10.2
N/A
0.7
1.7
2008
78
59
0.51
0.44
9.8
9.0
31.0
22.6
N/A
N/A
N/A
N/A
N/A
N/A
1.4
1.8
2007
81
75
0.44
0.59
10.2
10.8
29.4
22.1
N/A
N/A
N/A
N/A
N/A
N/A
2.0
3.2
2006
95
75
0.43
0.56
10.1
11.9
33.7
25.3
N/A
N/A
N/A
N/A
N/A
N/A
1.2
3.2
2005
88
87
0.38
0.39
11.6
12.1
31.0
24.1
N/A
N/A
N/A
N/A
N/A
N/A
1.3
1.5
2004
75
68
0.46
0.38
10.5
14.1
28.6
20.5
N/A
N/A
N/A
N/A
N/A
N/A
0.6
2.0
2003
87
78
0.42
0.47
10.9
14.3
30.8
22.0
N/A
N/A
N/A
N/A
N/A
N/A
N/A
2.3
2002
91
81
0.35
0.59
14.3
15.5
29.0
22.9
N/A
N/A
N/A
N/A
N/A
N/A
2.0
2.7
2001
87
82
0.69
N/A
13.1
10.4
31.0
25.9
N/A
N/A
N/A
N/A
N/A
N/A
1.8
N/A
2000
89
78
0.66
N/A
13.4
10.2
29.5
26.0
N/A
N/A
N/A
N/A
N/A
N/A
3.0
N/A
Natural disasters
Type
Oklahoma City
Little Rock
Tornado activity compared to U.S. average
353.4%
253.3%
Earthquake activity compared to U.S. average
938.9%
579.4%
Natural disasters compared to U.S. average
43%
26%
Transportation
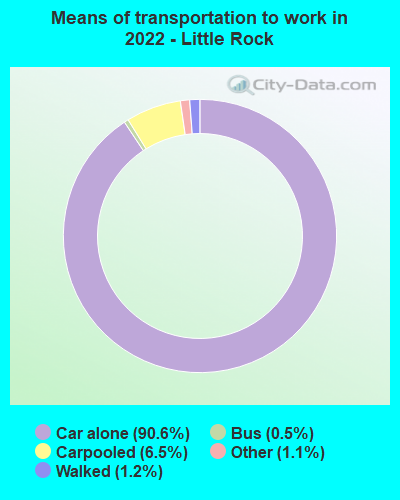
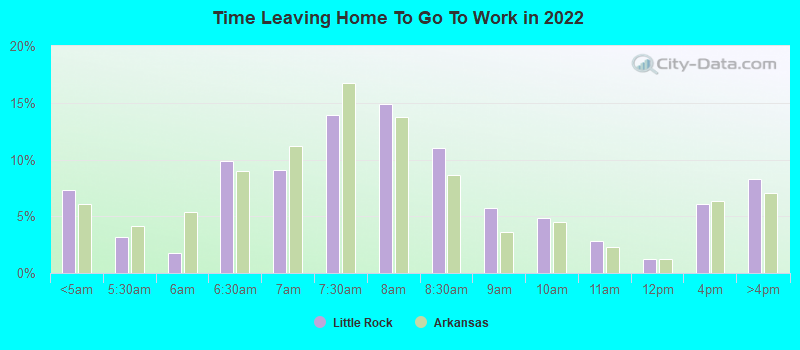
When it comes to public transportation, Oklahoma City has a light rail system, buses, and bike-sharing options. Little Rock also offers a public transit system with buses, trolleys in the downtown area, and ample options for biking.
Transport
Type
Oklahoma City
Little Rock
Amtrak stations
1
1
Amtrak stations nearby
2
1
FAA registered aircraft
0
259
FAA registered aircraft manufacturers and dealers
0
35
Means of transportation to work
Type
Oklahoma City
Little Rock
Bicycle
0.2%
0.1%
Bus
0.3%
0.4%
Carpooled
8.6%
9.7%
Car alone
87.6%
88.1%
Motorcycle
0.1%
0.1%
Taxicab
0.2%
0.3%
Walked
1.4%
0.9%
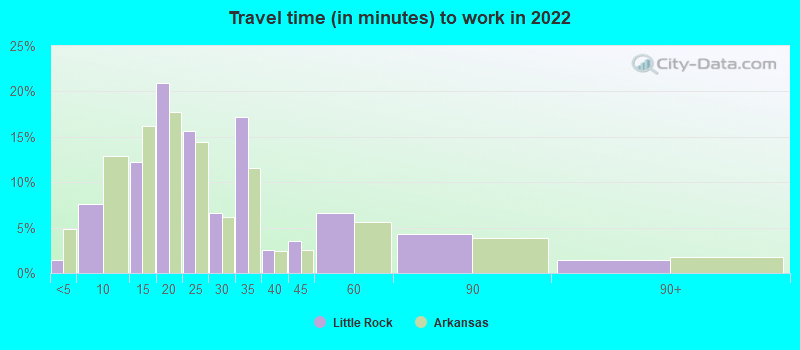
Average travel time to work
Type
Oklahoma City
Little Rock
Average
25.6 min
26 min
Other means
21 min
20 min
Public transportation
33.1 min
36.2 min
Private vehicle occupancy
Type
Oklahoma City
Little Rock
Average
1.2
1.2
Drove alone
89.5%
87.6%
In 2 person carpool
7.1%
8.3%
In 3 person carpool
1.9%
1.3%
In 4 person carpool
0.7%
0.9%
In 5-6 person carpool
0.5%
1.5%
In 7+ person carpool
0.2%
0.3%
How many people usually rode to work in the car, truck or van.
Real Estate
Real estate prices in Oklahoma City, OK, are significantly lower than the national average, making it an attractive location for prospective homebuyers. Little Rock, AR, while still affordable, offers higher real estate prices than Oklahoma City.
Neighborhoods
Both cities have a variety of neighborhoods to choose from. In Oklahoma City, Nichols Hills is highly rated for its high-end homes and low crime rates. Little Rock has Hillcrest, which offers a mix of historic and modern homes and a lively food and shopping scene.
Houses and residents
Type
Oklahoma City
Little Rock
Houses
302,241
99,876
Average household size (people)
2.5
2.3
Median year apartment built
1978
1981
Median year house/condo built
1986
1977
Length of stay in the house since moving in
11.8 years
12.9 years
Houses occupied
275,285 (91.1%)
89,422 (89.5%)
Houses occupied by owners
164,470 (59.7%)
49,236 (55.1%)
Houses occupied by renters
110,815 (40.3%)
40,186 (44.9%)
Median rent asked for vacant for-rent units
$1,241
$706.04
Median monthly housing costs
$983
$990
Median price asked for vacant for-sale houses and condos
$278,299
$243,385
Estimated median house or condo value
$190,900
$191,700
Median numbers of rooms
5.5
5.3
Median number of rooms in apartments
4.3
3.9
Median number of rooms in houses and condos
6.2
6.3
Median house price - detached houses
$254,772
$274,395
Median house price - in 2-unit structures
$318,820
$152,806
Median house price - in 3-to-4-unit structures
$128,784
$175,185
Median house price - in 5 or more unit structures
$170,231
$451,067
Median house price - mobile homes
$112,256
$35,528
Median house price - Townhouses or other attached units
$245,885
$160,142
Median house price - All housing units
$249,488
$271,664
Median house age
40
43
Renting percentage
40.3%
43.8%
Housing density (houses/condos per square mile)
497.9
859.5
House value disparities
34.7%
43.1%
Household income disparities
44.3%
49.3%
Median household income for houses/condes with a mortgage
$87,907
$98,030
Median household income for apartments without a mortgage
$61,761
$64,425
Housing units without a mortgage
1,238 (1.2%)
623 (1.9%)
Housing units with both a second mortgage and home equity loan
4,838 (4.7%)
1,588 (4.8%)
Housing units with a mortgage
100,798 (98.8%)
32,138 (98.1%)
Housing units with a home equity loan
123 (0.1%)
75 (0.2%)
Housing units with a second mortgage
5,921 (5.8%)
2,366 (7.2%)
House/condo owner moved in on average (years ago)
9
11
House/condo renter moved in on average (years ago)
1
1
Housing units lacking complete kitchen facilities
3.1%
2.1%
Housing units lacking complete plumbing facilities
1.9%
0.8%
Housing units in structures
Housing units in structures
Oklahoma City
Little Rock
One, detached
67.8%
61.4%
One, attached
3.4%
2.2%
Two
2.0%
1.9%
3 or 4
5.1%
4.1%
5 to 9
6.0%
8.6%
10 to 19
5.6%
4.9%
20 to 49
2.4%
3.8%
50 or more
4.6%
11.2%
Mobile homes
3.1%
2.0%
Boats, RVs, vans, etc.
0.1%
0.0%
Median real estate property taxes paid for housing units
Self-employed workers in own not incorporated business
20,964
4,725
State government workers
17,132
9,860
Unpaid family workers
555
160
Industries and Occupations
Oklahoma City has a diverse economy, with the top industries being oil, natural gas, and petroleum products. Little Rock's economy is dominated by health care, banking, and government roles due to its position as a state capital.
Both cities offer extensive healthcare facilities. Oklahoma City is home to Integris Health, one of the region's largest healthcare providers. In contrast, Little Rock hosts the University of Arkansas for Medical Sciences — one of the largest public employers and a leader in medical research.
Health (county statistics)
Type
Oklahoma City
Little Rock
General health status score of residents in this county from 1 (poor) to 5 (excellent)
Oklahoma City has made substantial investments in infrastructure, including a modern streetcar system and extensive renovations to their airport. Little Rock, in contrast, has an exceptional road network, making it easy for residents and tourists to navigate the city.
Infrastructure
Type
Oklahoma City
Little Rock
Hospitals
61
15
TV stations
20
17
Arenas or stadiums
4
2
Bank branches located here
183
139
Bank institutions located here
44
29
Main business address for public companies
15
4
Drinking water stations with no reported violations in the past
4
0
Drinking water stations with reported violations in the past
HMDA - Conventional home purchase loans - Applications denied
Year
Oklahoma City
Little Rock
1999
2,925
842
2000
2,396
792
2001
1,824
634
2002
1,507
365
2003
2,014
510
2004
2,323
581
2005
3,134
837
2006
3,132
881
2007
2,036
503
2008
1,143
230
2009
593
114
Culture and Food
Oklahoma City offers a unique blend of Western heritage with contemporary culture and is known for steakhouses and comfort food. On the other hand, Little Rock boasts a vibrant culinary scene with an emphasis on Southern and farm-to-table cuisine.
Sports Teams
Oklahoma City is home to the Oklahoma City Thunder, a popular NBA team. Little Rock doesn't have any major league professional teams but offers a thriving college sports scene with the University of Arkansas Razorbacks.


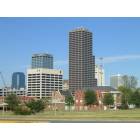


 Oklahoma City, OK
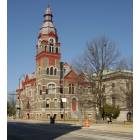
 Little Rock, AR