Northeast Tarrant and Richardson, both located in Texas, differ considerably in areas such as crime rates, cost of living, educational systems, economic conditions, and cultural experiences. Living in or visiting either of these cities offers unique benefits and experiences, though decisions like relocation largely depend on personal criteria such as safety, weather preference, financial expense, and overall lifestyle choice. Understanding these differences is crucial for anyone considering a move or planning a visit to these diverse regions.
Northeast Tarrant has a lower crime rate than many parts of Texas, contributing to a feeling of safety among its residents. On the contrary, Richardson's crime rates are slightly higher than the state average, which could influence potential residents or visitors. Both cities are committed to maintaining public safety, and provide comprehensive law enforcement services via their respective Police Departments.
Cost of Living
The cost of living in Northeast Tarrant is slightly higher than the state average, mainly due to housing costs. Richardson, however, offers a relatively lower cost of living, making it an attractive option for those considering relocation.
Income Tax
Texas does not levy state income tax, which applies to both Northeast Tarrant and Richardson.
Property Tax
Property taxes in Northeast Tarrant tend to be higher than the state average, while Richardson has slightly lower property taxes, making it a more affordable option for homeowners or potential investors.
Sales Tax
Sales tax rates in both Northeast Tarrant and Richardson align with the Texas state average of 6.25%, with additional city taxes bringing the total close to 8.25%.
Income
Type
Northeast Tarrant
Richardson
Estimated median household income
$90,881
$85,580
Estimated per capita income
$45,353
$46,080
Cost of living index (U.S. average is 100)
102
96.4
If you make $50,000 in Richardson, you will have to make $52,905 in Northeast Tarrant to maintain the same standard of living.
Geographical Conditions
Situated in the prairie landscapes of Texas, both Northeast Tarrant and Richardson have flat topography but vary slightly with Northeast Tarrant having more open land and Richardson being more urbanized.
Geographical information
Type
Northeast Tarrant
Richardson
Land area
206.9 sq. miles
28.6 sq. miles
Population density
2,284.3 people per sq. mile
4,074.4 people per sq. mile
Relative area comparison
Northeast Tarrant, TX Richardson, TX
Education
Both areas have high-quality public and private school systems. Northeast Tarrant is home to some highly-ranked school districts, whereas Richardson is known for its exceptional higher education institutions, including the University of Texas at Dallas.
Both areas have healthy economies, though they differ slightly in focus. Northeast Tarrant's economy is heavily influenced by manufacturing and retail trade, while Richardson's economy is greatly influenced by the technology sector due to the presence of the Telecom Corridor.
Biggest Employers
In Northeast Tarrant, some of the largest employers include American Airlines, the Birdville Independent School District, and Mercy Hospital. Richardson is home to big-name companies such as AT&T, Verizon, and Texas Instruments.
In Northeast Tarrant (Tarrant County), 41.4% voted for Democrats and 57.1% for Republicans in 2012 Presidential Election. In Richardson (Dallas County), 57.3% voted for Democrats and 41.8% for Republicans.
Elections
Type
Democrats
Republicans
Other
Year
Northeast Tarrant
Richardson
Northeast Tarrant
Richardson
Northeast Tarrant
Richardson
2020
49.3%
65.1%
49.1%
33.4%
1.6%
1.4%
2016
43.2%
60.8%
51.8%
34.7%
5.0%
4.5%
2012
41.4%
57.3%
57.1%
41.8%
1.4%
1.0%
2008
43.8%
57.4%
55.5%
42.0%
0.7%
0.6%
2004
37.0%
49.0%
62.5%
50.4%
0.5%
0.5%
2000
36.9%
45.0%
60.9%
52.7%
2.3%
2.4%
1996
41.6%
46.0%
50.9%
46.8%
7.5%
7.2%
Breakdown of population affiliated with a religious congregation
Type
Adherents
Congregations
Religion
Northeast Tarrant
Richardson
Northeast Tarrant
Richardson
SOUTHERN BAPTIST CONVENTION
17.3%
11.0%
33.3%
31.1%
CATHOLIC CHURCH
11.1%
18.9%
1.9%
2.4%
MUSLIM ESTIMATE
2.2%
3.6%
0.9%
1.1%
LUTHERAN CHURCH
0.5%
0.3%
0.9%
0.7%
SEVENTH DAY ADVENTIST CHURCH
0.4%
0.5%
1.6%
1.7%
EPISCOPAL CHURCH
0.3%
1.0%
0.8%
1.5%
EVANGELICAL LUTHERAN CHURCH IN AMERICA
0.3%
0.3%
0.9%
0.9%
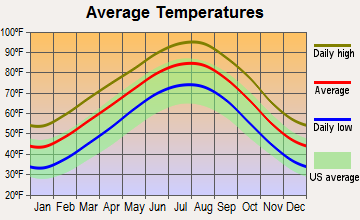
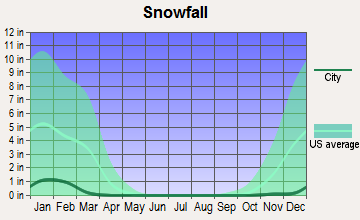
Weather
Both Northeast Tarrant and Richardson experience typical Texas weather, characterized by hot summers and mild winters. Richardson, being located more inland and farther north, tends to have slightly cooler winters, though differences are minimal.
Weather and climate
Type
Northeast Tarrant
Richardson
Temperature - Average
64.6°F
64.9°F
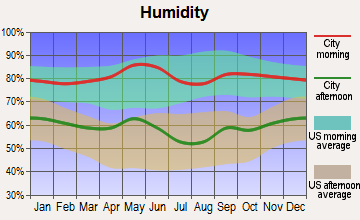
Humidity - Average morning or afternoon humidity
71.3%
71.3%
Humidity - Differences between morning and afternoon humidity
34%
34%
Humidity - Maximum monthly morning or afternoon humidity
82%
82%
Humidity - Minimum monthly morning or afternoon humidity
48%
48%
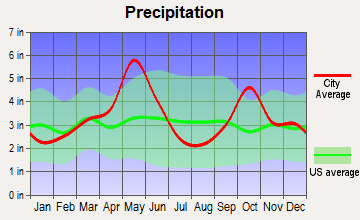
Precipitation - Yearly average
37.2 in
40.2 in
Snowfall - Yearly average
4.2 in
4.2 in
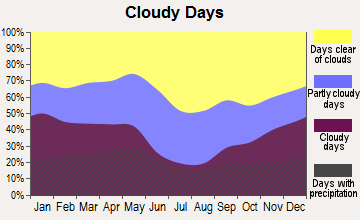
Clouds - Number of days clear of clouds
22.8%
22.8%
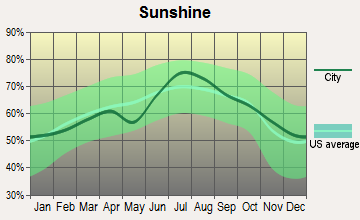
Sunshine amount - Average
66.6%
66.6%
Sunshine amount - Differences during a year
20%
20%
Sunshine amount - Maximum monthly
74%
74%
Sunshine amount - Minimum monthly
54%
54%
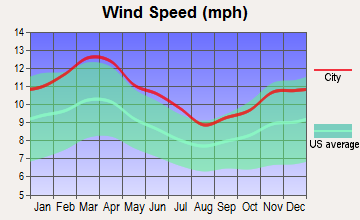
Wind speed - Average
10.3 mph
10.3 mph
Average climate in Northeast Tarrant, Texas
Average climate in Richardson, Texas
Air pollution
Type
AQI
CO
NO2
OZONE
PB
PM25
SO2
Year
Northeast Tarrant
Richardson
Northeast Tarrant
Northeast Tarrant
Richardson
Northeast Tarrant
Richardson
Richardson
Northeast Tarrant
Richardson
Northeast Tarrant
Richardson
2018
86
86
N/A
N/A
5.8
5.8
27.9
28.9
N/A
N/A
9.2
9.7
0.4
0.4
2017
84
84
N/A
N/A
5.9
5.7
28.0
30.1
N/A
N/A
8.6
9.1
0.3
0.3
2016
75
78
N/A
N/A
6.2
6.4
26.4
28.6
N/A
N/A
8.2
8.4
0.2
0.2
2015
81
84
N/A
N/A
6.5
7.1
25.7
28.7
N/A
N/A
8.5
8.9
0.3
0.3
2014
77
83
0.22
N/A
6.6
6.3
27.1
29.8
N/A
N/A
9.4
9.9
0.3
0.3
2013
95
95
0.25
N/A
6.8
7.1
28.0
30.7
N/A
N/A
11.3
13.0
0.2
0.2
2012
108
113
0.26
N/A
8.1
8.6
30.7
32.6
N/A
N/A
10.8
12.0
0.3
0.3
2011
98
98
0.23
N/A
8.0
9.2
30.8
32.2
N/A
N/A
10.2
11.9
0.6
0.6
2010
76
79
0.23
N/A
8.7
9.6
28.0
29.1
N/A
N/A
8.5
N/A
0.7
0.7
2009
93
87
0.25
N/A
8.9
9.5
29.1
30.2
N/A
N/A
8.7
N/A
0.5
0.5
2008
89
86
0.25
N/A
9.7
9.9
27.5
30.7
0.121
N/A
9.4
N/A
0.5
0.5
2007
91
94
0.30
N/A
10.8
10.5
25.1
27.1
0.070
N/A
9.7
N/A
0.3
0.3
2006
99
107
0.34
N/A
10.6
10.5
30.2
31.5
0.106
N/A
9.5
N/A
0.7
0.7
2005
109
105
0.34
N/A
12.3
13.2
29.1
31.1
0.142
N/A
10.7
11.0
0.9
0.9
2004
90
96
0.39
N/A
11.6
11.9
25.7
28.0
0.099
N/A
N/A
N/A
0.8
0.8
2003
97
102
0.40
N/A
12.3
13.8
27.2
29.1
0.121
N/A
N/A
N/A
1.0
1.0
2002
97
97
0.37
N/A
13.0
14.3
25.4
26.8
0.080
N/A
N/A
N/A
0.4
0.4
2001
88
100
0.48
N/A
14.3
13.6
26.0
28.8
0.069
N/A
N/A
N/A
1.0
1.0
2000
104
109
0.55
N/A
14.5
14.5
27.1
29.6
0.092
N/A
N/A
N/A
1.1
1.1
Natural disasters
Type
Northeast Tarrant
Richardson
Tornado activity compared to U.S. average
252.8%
253.4%
Earthquake activity compared to U.S. average
578.9%
586.1%
Natural disasters compared to U.S. average
23%
21%
Transportation
Both areas have well-developed transportation systems. Northeast Tarrant's proximity to Fort Worth allows easy commuting via the TRE train, while Richardson is serviced by the DART public transit system.
Transport
Type
Northeast Tarrant
Richardson
Amtrak stations nearby
1
1
FAA registered aircraft
0
89
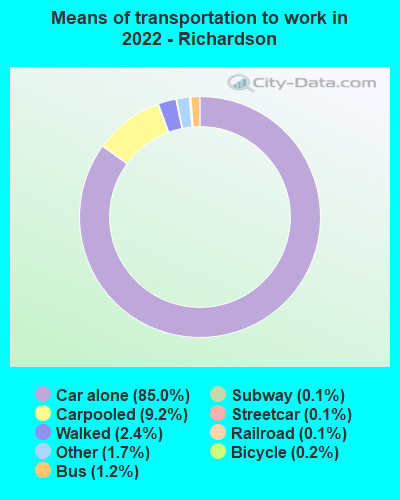
Means of transportation to work
Type
Northeast Tarrant
Richardson
Bicycle
0.2%
0.2%
Bus
0%
1.7%
Carpooled
9.8%
12.3%
Car alone
84.8%
81.7%
Motorcycle
0.1%
0.1%
Walked
0.9%
1.6%
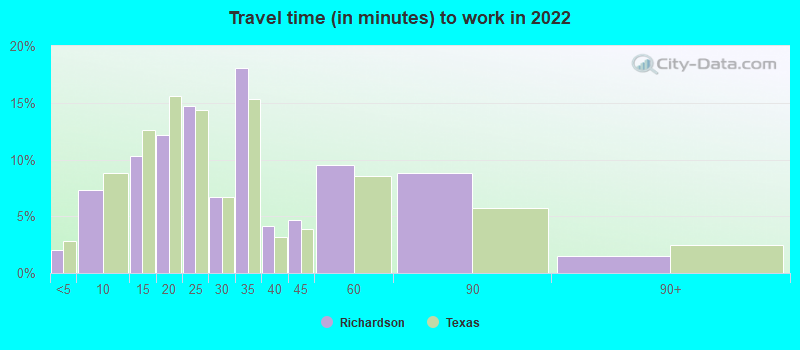
Average travel time to work
Type
Northeast Tarrant
Richardson
Average
26.8 min
29.1 min
Real Estate
The real estate market in Northeast Tarrant is somewhat pricier than in Richardson, due primarily to the higher demand. Meanwhile, Richardson real estate offers a more affordable option and is known for its mid-century modern homes.
Neighborhoods
Northeast Tarrant features a variety of upscale, family-friendly neighborhoods, each with their unique charm. Richardson is famous for its distinct neighborhoods, particularly Prairie Creek, known for its park-like setting and creek views.
Houses and residents
Type
Northeast Tarrant
Richardson
Houses
155,788
47,008
Average household size (people)
2.7
2.5
Houses occupied
149,489 (96%)
45,148 (96%)
Houses occupied by owners
101,491 (67.9%)
25,448 (56.4%)
Houses occupied by renters
47,998 (32.1%)
19,700 (43.6%)
Median rent asked for vacant for-rent units
$1,297
$940.29
Median price asked for vacant for-sale houses and condos
$288,870
$398,984
Estimated median house or condo value
$337,949
$358,000
Median number of rooms in apartments
4.1
4
Median number of rooms in houses and condos
6.5
7.1
Renting percentage
32.5%
38%
Housing density (houses/condos per square mile)
752.8
1,645.7
Household income disparities
38.7%
42.7%
Housing units without a mortgage
18,262 (19.1%)
345 (2.2%)
Housing units with both a second mortgage and home equity loan
88 (0.1%)
284 (1.8%)
Housing units with a mortgage
77,313 (80.9%)
15,068 (97.8%)
Housing units with a home equity loan
4,029 (4.2%)
0 (0%)
Housing units with a second mortgage
5,649 (5.9%)
412 (2.7%)
Housing units lacking complete kitchen facilities
0.4%
0.8%
Housing units lacking complete plumbing facilities
Self-employed workers in own not incorporated business
11,886
4,944
State government workers
4,379
2,005
Unpaid family workers
466
0
Industries and Occupations
The dominant industries in Northeast Tarrant include retail trade, manufacturing, and health care. In contrast, Richardson is well known for its technology and telecommunications industries, hosting many Fortune 500 companies.
Both Northeast Tarrant and Richardson have excellent healthcare facilities. Northeast Tarrant is home to prominent facilities like Baylor Scott & White Emergency Hospital, while Richardson houses the Methodist Richardson Medical Center.
Health (county statistics)
Type
Northeast Tarrant
Richardson
General health status score of residents in this county from 1 (poor) to 5 (excellent)
Northeast Tarrant, made up of many smaller suburbs of Fort Worth, boasts modern infrastructure with ongoing developments in housing, commerce, and transportation. Richardson, part of the Dallas-Fort Worth metroplex, has a robust infrastructure, particularly excelling in digital and telecommunications.
Infrastructure
Type
Northeast Tarrant
Richardson
TV stations
25
25
Culture and Food
Both areas offer rich cultural experiences. Northeast Tarrant boasts a plethora of outdoor entertainment, cultural arts, and food festivals. Richardson is known for its diverse food scene, with notable South Asian, Middle Eastern, and Tex-Mex cuisine.
Sports Teams
Being part of the Dallas-Fort Worth area, both Northeast Tarrant and Richardson are close to professional team action like the Dallas Cowboys (NFL), Texas Rangers (MLB), and Dallas Mavericks (NBA).
 Northeast Tarrant, TX
 Richardson, TX