When comparing living in Northeast Tarrant, TX, to Kansas City, MO, it becomes evident that each region offers distinct opportunities and experiences. With disparities in crime rates, cost of living, and economic drivers, these two areas offer unique appeal based on individual preference. Furthermore, they both have distinctive attributes related to their cultures, sports teams, healthcare services, education offerings, and infrastructure, which contribute significantly to the quality of life residents and visitors can expect.
According to data from the FBI, the crime rate in Kansas City, MO, is higher than the national average. On the other hand, Northeast Tarrant, TX embraces a relatively safer environment, with crime rates lower than the national average, making it a desirable place for individuals looking for a secure environment. For tourists, these crime records indicate that Northeast Tarrant should generally present a safer environment.
Cost of Living
The cost of living in Northeast Tarrant, Texas, is lower than the national average, with housing being the most significant factor affecting the overall cost. Contrastingly, Kansas City, Missouri, offers a cost of living that is also below the national average but higher than that in Northeast Tarrant. This price difference is a crucial consideration for potential residents, influencing overall living experiences and budgets.
Income Tax
Texas is one of the few states that does not impose an income tax. Thus, residents of Northeast Tarrant are not subject to this fee. Conversely, Kansas City, Missouri residents are subject to a state income tax that varies based on income level.
Property Tax
Property taxes in Northeast Tarrant, Texas, vary by district but are generally high, with an average of about 1.90%. Kansas City, MO, residents typically pay less, with the average city property tax rate about 0.99%.
Sales Tax
Texas, including Northeast Tarrant, has a state and local sales tax rate of 8.25%. This rate surpasses Missouri's sales tax rate, which stands at 4.225% state-wide, with an additional local sales tax in Kansas City averaging around 2.9%.
Income
Type
Northeast Tarrant
Kansas City
Estimated median household income
$90,881
$63,396
Estimated per capita income
$45,353
$36,456
Cost of living index (U.S. average is 100)
102
87.3
If you make $50,000 in Kansas City, you will have to make $58,419 in Northeast Tarrant to maintain the same standard of living.
Geographical Conditions
Northeast Tarrant has a relatively flat terrain, typical of many parts of Texas, complemented with a few man-made lakes. On the other hand, Kansas City sits at the confluence of the Kansas and Missouri Rivers and has a more varied geography with hills, bluffs, and broad valleys.
Geographical information
Type
Northeast Tarrant
Kansas City
Land area
206.9 sq. miles
313.5 sq. miles
Population density
2,284.3 people per sq. mile
1,621.4 people per sq. mile
Relative area comparison
Northeast Tarrant, TX Kansas City, MO
Education
Education in Northeast Tarrant, Texas, is looked at favorably with excellent primary, secondary, and tertiary institutions. Kansas City, Missouri, has a robust educational system as well, comprising public schools, private institutions, and notable higher education facilities. Each city presents a competitive education landscape, which caters to its residents' diverse needs.
The economy sector in Texas, Northeast Tarrant, focuses much on technology, healthcare, and financial services, providing numerous jobs and stability. Kansas City, Missouri, boasts a vibrant economy driven by sectors like healthcare, information technology, and manufacturing, promoting robust job growth and advancement opportunities.
Biggest Employers
Northeast Tarrant's largest employers include Bell Helicopter Textron, Lockheed Martin Aeronautics, and Texas Health Resources. Meanwhile, Kansas City's most prominent employers are Cerner Corporation, Ford Motor Company, and the University of Kansas Hospital.
In Northeast Tarrant (Tarrant County), 41.4% voted for Democrats and 57.1% for Republicans in 2012 Presidential Election. In Kansas City (Jackson County), 58.9% voted for Democrats and 39.3% for Republicans.
Elections
Type
Democrats
Republicans
Other
Year
Northeast Tarrant
Kansas City
Northeast Tarrant
Kansas City
Northeast Tarrant
Kansas City
2020
49.3%
60.1%
49.1%
38.1%
1.6%
1.8%
2016
43.2%
55.5%
51.8%
38.1%
5.0%
6.4%
2012
41.4%
58.9%
57.1%
39.3%
1.4%
1.7%
2008
43.8%
62.1%
55.5%
36.8%
0.7%
1.1%
2004
37.0%
58.2%
62.5%
41.4%
0.5%
0.4%
2000
36.9%
59.0%
60.9%
38.4%
2.3%
2.5%
1996
41.6%
56.2%
50.9%
34.3%
7.5%
9.5%
Breakdown of population affiliated with a religious congregation
Type
Adherents
Congregations
Religion
Northeast Tarrant
Kansas City
Northeast Tarrant
Kansas City
SOUTHERN BAPTIST CONVENTION
17.3%
9.5%
33.3%
13.7%
CATHOLIC CHURCH
11.1%
10.3%
1.9%
6.4%
MUSLIM ESTIMATE
2.2%
0.4%
0.9%
1.1%
LUTHERAN CHURCH
0.5%
1.4%
0.9%
1.8%
SEVENTH DAY ADVENTIST CHURCH
0.4%
0.5%
1.6%
1.0%
EPISCOPAL CHURCH
0.3%
0.8%
0.8%
1.7%
AMERICAN BAPTIST CHURCHES IN THE USA
0.0%
0.3%
0.1%
1.4%
SALVATION ARMY
0.0%
0.4%
0.2%
0.6%
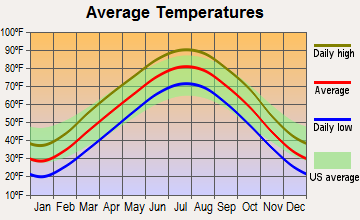
Weather
Northeast Tarrant, Texas, typically experiences hot, humid summers and relatively mild winter conditions, perfect for those who enjoy warm weather. In contrast, Kansas City, Missouri, has a diverse climate with distinct summers and winters, experiencing snowfall during winter, providing a varied collection of seasonal experiences.
Weather and climate
Type
Northeast Tarrant
Kansas City
Temperature - Average
64.6°F
56.2°F
Humidity - Average morning or afternoon humidity
71.3%
76.3%
Humidity - Differences between morning and afternoon humidity
34%
30.1%
Humidity - Maximum monthly morning or afternoon humidity
82%
86%
Humidity - Minimum monthly morning or afternoon humidity
48%
56%
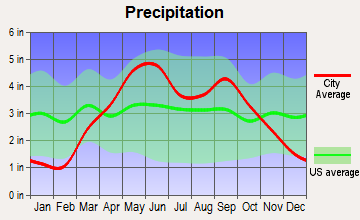
Precipitation - Yearly average
37.2 in
36.3 in
Snowfall - Yearly average
4.2 in
38 in
Clouds - Number of days clear of clouds
22.8%
20.1%
Sunshine amount - Average
66.6%
67.3%
Sunshine amount - Differences during a year
20%
25.9%
Sunshine amount - Maximum monthly
74%
74%
Sunshine amount - Minimum monthly
54%
48%
Wind speed - Average
10.3 mph
11.2 mph
Average climate in Northeast Tarrant, Texas
Average climate in Kansas City, Missouri
Air pollution
Type
AQI
CO
NO2
OZONE
PM10
PM25
SO2
Year
Northeast Tarrant
Kansas City
Northeast Tarrant
Kansas City
Northeast Tarrant
Kansas City
Northeast Tarrant
Kansas City
Kansas City
Northeast Tarrant
Kansas City
Northeast Tarrant
Kansas City
2018
86
89
N/A
0.29
5.8
11.1
27.9
29.6
24.5
N/A
9.2
7.4
0.4
0.9
2017
84
88
N/A
0.29
5.9
11.6
28.0
30.4
26.7
N/A
8.6
10.0
0.3
1.4
2016
75
85
N/A
0.30
6.2
12.0
26.4
28.9
24.9
N/A
8.2
9.0
0.2
1.5
2015
81
90
N/A
0.30
6.5
12.9
25.7
28.9
33.6
N/A
8.5
8.3
0.3
4.6
2014
77
90
0.22
0.28
6.6
13.0
27.1
28.6
28.5
N/A
9.4
9.3
0.3
5.0
2013
95
88
0.25
0.41
6.8
13.2
28.0
29.3
30.8
N/A
11.3
10.3
0.2
5.6
2012
108
105
0.26
0.52
8.1
14.2
30.7
31.9
N/A
N/A
10.8
10.3
0.3
6.4
2011
98
108
0.23
0.45
8.0
15.0
30.8
29.9
N/A
N/A
10.2
10.9
0.6
4.8
2010
76
97
0.23
0.40
8.7
15.0
28.0
27.4
N/A
N/A
8.5
11.9
0.7
5.4
2009
93
96
0.25
0.29
8.9
14.8
29.1
28.3
N/A
N/A
8.7
9.6
0.5
6.1
2008
89
89
0.25
0.40
9.7
17.0
27.5
25.7
N/A
N/A
9.4
11.5
0.5
6.0
2007
91
104
0.30
0.42
10.8
18.4
25.1
29.1
N/A
N/A
9.7
13.1
0.3
4.2
2006
99
104
0.34
0.36
10.6
18.5
30.2
29.2
N/A
N/A
9.5
12.4
0.7
5.1
2005
109
105
0.34
0.55
12.3
18.3
29.1
28.4
N/A
N/A
10.7
N/A
0.9
4.5
2004
90
83
0.39
0.45
11.6
11.6
25.7
26.2
N/A
N/A
N/A
N/A
0.8
4.0
2003
97
99
0.40
0.41
12.3
10.9
27.2
28.0
N/A
N/A
N/A
N/A
1.0
3.0
2002
97
100
0.37
0.40
13.0
8.9
25.4
27.0
N/A
N/A
N/A
N/A
0.4
2.5
2001
88
88
0.48
0.52
14.3
7.9
26.0
27.0
N/A
N/A
N/A
N/A
1.0
1.2
2000
104
102
0.55
0.75
14.5
8.8
27.1
29.2
N/A
N/A
N/A
N/A
1.1
2.2
Natural disasters
Type
Northeast Tarrant
Kansas City
Tornado activity compared to U.S. average
252.8%
200.4%
Earthquake activity compared to U.S. average
578.9%
598.9%
Natural disasters compared to U.S. average
23%
24%
Transportation
Various public transportation options are provided in both regions. Northeast Tarrant, Texas, utilizes road networks and local public transit, including buses and rail systems. Likewise, Kansas City, Missouri, provides transportation through buses, light rail services, and extensive highway systems, creating efficient commuting experiences.
Transport
Type
Northeast Tarrant
Kansas City
Amtrak stations
0
1
Amtrak stations nearby
1
3
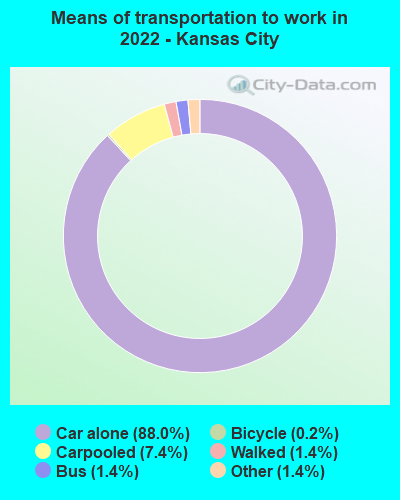
Means of transportation to work
Type
Northeast Tarrant
Kansas City
Bicycle
0.2%
0.4%
Bus
0%
1.5%
Carpooled
9.8%
8.7%
Car alone
84.8%
86.8%
Motorcycle
0.1%
0.1%
Taxicab
0.1%
0.2%
Walked
0.9%
1.3%
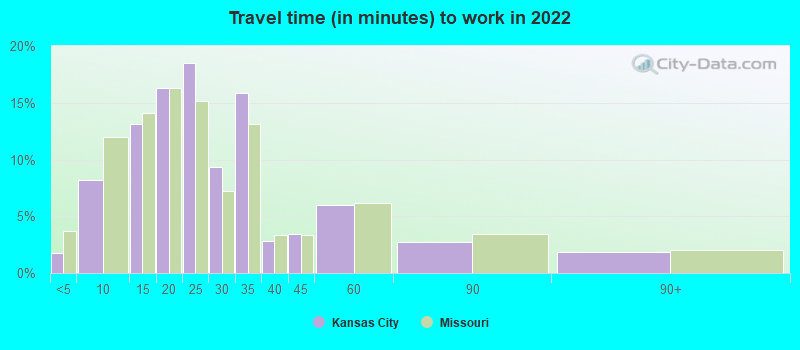
Average travel time to work
Type
Northeast Tarrant
Kansas City
Average
26.8 min
25.5 min
Real Estate
The real estate market in Northeast Tarrant, TX, is quite competitive, with home prices trending upwards over the past year. In contrast, Kansas City, MO, has a mixed market with areas of high growth and slower-paced regions, depending on the neighborhood.
Neighborhoods
The neighborhoods of Northeast Tarrant offer a mix of urban, suburban, and rural experiences, catering to varied lifestyles. Kansas City, on the other hand, is known for its downtown area and historic neighborhoods rich in culture and architecture.
Houses and residents
Type
Northeast Tarrant
Kansas City
Houses
155,788
243,950
Average household size (people)
2.7
2.3
Houses occupied
149,489 (96%)
219,020 (89.8%)
Houses occupied by owners
101,491 (67.9%)
118,384 (54.1%)
Houses occupied by renters
47,998 (32.1%)
100,636 (45.9%)
Median rent asked for vacant for-rent units
$1,297
$933.71
Median price asked for vacant for-sale houses and condos
$288,870
$71,644
Estimated median house or condo value
$337,949
$213,400
Median number of rooms in apartments
4.1
4.3
Median number of rooms in houses and condos
6.5
6.6
Renting percentage
32.5%
43.8%
Housing density (houses/condos per square mile)
752.8
778
Household income disparities
38.7%
43.9%
Housing units without a mortgage
18,262 (19.1%)
1,566 (2%)
Housing units with both a second mortgage and home equity loan
88 (0.1%)
5,650 (7.2%)
Housing units with a mortgage
77,313 (80.9%)
77,422 (98%)
Housing units with a home equity loan
4,029 (4.2%)
403 (0.5%)
Housing units with a second mortgage
5,649 (5.9%)
6,848 (8.7%)
Housing units lacking complete kitchen facilities
0.4%
3.8%
Housing units lacking complete plumbing facilities
Self-employed workers in own not incorporated business
11,886
13,035
State government workers
4,379
6,835
Unpaid family workers
466
197
Industries and Occupations
In Northeast Tarrant, the primary industries include health care, education, finance, and insurance, providing many job opportunities for its residents. In contrast, Kansas City is known for its diverse economic base, with service industries leading the way, and a significant proportion of employment in trade, transportation, and utilities.
Healthcare in Northeast Tarrant is comprehensive, with high-quality hospitals and medical facilities part of the region. Similarly, Kansas City features excellent healthcare services, including world-class hospitals and specialty healthcare centers, further enhancing the residents' and tourists' appeal to both locations.
Health (county statistics)
Type
Northeast Tarrant
Kansas City
General health status score of residents in this county from 1 (poor) to 5 (excellent)
Infrastructure in Northeast Tarrant, Texas, is well-developed, providing residents with quality amenities and services, from robust road networks to efficient utility systems. Conversely, whilst Kansas City, Missouri, also boasts of quality infrastructure, it is notable for its unique cityscape and recognizable structures such as the Liberty Memorial and Kauffman Center for the Performing Arts.
Infrastructure
Type
Northeast Tarrant
Kansas City
TV stations
25
14
Culture and Food
The culture in Northeast Tarrant, Texas, is filled with southwestern allure, with rodeos, western music, and barbecue popular among residents. Kansas City, Missouri, boasts a vibrant cultural scene too, known especially for its jazz music history and world-renowned BBQ cuisine, offering delectable experiences for locals and tourists alike.
Sports Teams
Living in Northeast Tarrant, Texas, puts you close to Dallas/Fort Worth, home to notable teams like the Dallas Cowboys (NFL), Texas Rangers (MLB), and Dallas Mavericks(NBA). Kansas City also has a proud sports legacy, with the Kansas City Chiefs (NFL), Kansas City Royals (MLB), and Sporting Kansas City (MLS) all delivering thrilling sporting action to fans.
 Northeast Tarrant, TX
 Kansas City, MO