Colorado is host to a multitude of vibrant communities, including Northeast Jefferson and Southwest Arapahoe. Both places offer unique opportunities, experiences, and atmospheres for residents as well as visitors. Differences between the two areas are visible in aspects such as crime rates, education quality, cost of living, weather conditions, the state of the economy, available infrastructure, cultural richness, taxes, healthcare, sports, and food. This comprehensive comparison offers insights that could help potential movers or tourists make decisions based on their lifestyle preferences and needs.
Residents of Northeast Jefferson are likely to have a greater sense of ease, as its crime rates are lower than the national average. Southwest Arapahoe, on the other hand, shows higher crime rates. For tourists, Northeast Jefferson's safer environment might be more attractive for exploring local attractions and indulging in community events.
Cost of Living
Southwest Arapahoe tends to be more affordable than Northeast Jefferson in terms of daily cost of living. Rent and grocery prices in Southwest Arapahoe are generally lower. Thus, budget conscious travellers and those considering relocation may find Southwest Arapahoe more cost-effective.
Income Tax
Income tax rates in both Southwest Arapahoe and Northeast Jefferson are consistent due to their location within the same state. As such, potential newcomers would not experience income tax as a deciding factor between these two locations.
Property Tax
Both Northeast Jefferson and Southwest Arapahoe are subject to Colorado’s property tax laws, which are considered relatively low compared to other states. However, higher property values in Northeast Jefferson could result in larger total tax bills.
Sales Tax
Tax rates are generally similar in both locations, as they fall under Colorado's uniform statewide sales tax rate. However, some local differences may apply.
Income
Type
Northeast Jefferson
Southwest Arapahoe
Estimated median household income
$91,025
$94,400
Estimated per capita income
$46,835
$57,187
Cost of living index (U.S. average is 100)
119.7
113.3
If you make $50,000 in Southwest Arapahoe, you will have to make $52,824 in Northeast Jefferson to maintain the same standard of living.
Geographical Conditions
Northeast Jefferson, situated in the foothills of the Rocky Mountains, offers more outdoor recreation opportunities with its nearby trails, parks, and reservoirs. Southwest Arapahoe is a more urban environment with its own set of attractions.
Geographical information
Type
Northeast Jefferson
Southwest Arapahoe
Land area
172.8 sq. miles
69.4 sq. miles
Population density
2,615.1 people per sq. mile
2,907.1 people per sq. mile
Relative area comparison
Northeast Jefferson, CO Southwest Arapahoe, CO
Education
Northeast Jefferson boasts an excellent education system, with higher-than-average high school graduation rates. The area also has multiple institutions for higher education. Southwest Arapahoe has commendable education facilities, but falls slightly behind Northeast Jefferson in terms of educational attainment.
Job prospects differ between these two areas. Southwest Arapaho's economy is focused on public administration, retail trade, and healthcare, providing a wide range of job opportunities for professionals in these fields. Northeast Jefferson has a more diverse economy, with notable sectors in technology, finance, and education.
In Northeast Jefferson (Jefferson County), 51.6% voted for Democrats and 46.7% for Republicans in 2012 Presidential Election. In Southwest Arapahoe (Arapahoe County), 54.4% voted for Democrats and 44.4% for Republicans.
Elections
Type
Democrats
Republicans
Other
Year
Northeast Jefferson
Southwest Arapahoe
Northeast Jefferson
Southwest Arapahoe
Northeast Jefferson
Southwest Arapahoe
2020
58.3%
61.3%
39.7%
36.6%
2.0%
2.1%
2016
49.2%
53.1%
42.3%
38.9%
8.6%
8.1%
2012
51.6%
54.4%
46.7%
44.4%
1.8%
1.3%
2008
54.0%
56.0%
44.9%
43.0%
1.1%
1.0%
2004
46.9%
47.6%
52.1%
51.6%
1.0%
0.8%
2000
43.0%
43.6%
51.1%
51.6%
5.9%
4.8%
1996
42.7%
41.9%
48.4%
50.8%
8.9%
7.3%
Breakdown of population affiliated with a religious congregation
Type
Adherents
Congregations
Religion
Northeast Jefferson
Southwest Arapahoe
Northeast Jefferson
Southwest Arapahoe
CATHOLIC CHURCH
15.0%
12.1%
5.1%
4.3%
EVANGELICAL LUTHERAN CHURCH IN AMERICA
1.7%
2.0%
4.2%
4.3%
SOUTHERN BAPTIST CONVENTION
1.2%
1.6%
7.5%
9.9%
LUTHERAN CHURCH
1.1%
1.0%
3.3%
2.6%
EPISCOPAL CHURCH
0.5%
0.4%
2.7%
1.7%
SEVENTH DAY ADVENTIST CHURCH
0.4%
0.2%
2.1%
2.6%
EVANGELICAL PRESBYTERIAN CHURCH
0.2%
0.6%
0.6%
2.6%
VINEYARD USA
0.2%
0.5%
0.6%
0.3%
MUSLIM ESTIMATE
0.1%
1.9%
0.6%
1.0%
Weather
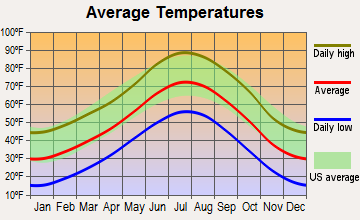
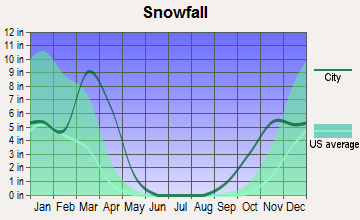
The weather in both areas is characterized by a typical Colorado climate with significant snowfall in the winter and warm summers. However, slightly cooler temperatures can be found in Northeast Jefferson due to its higher elevation. People with preference for colder climates might find Northeast Jefferson more appealing.
Weather and climate
Type
Northeast Jefferson
Southwest Arapahoe
Temperature - Average
47.9°F
50°F
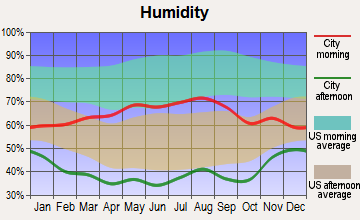
Humidity - Average morning or afternoon humidity
50.6%
50.6%
Humidity - Differences between morning and afternoon humidity
20%
20%
Humidity - Maximum monthly morning or afternoon humidity
55%
55%
Humidity - Minimum monthly morning or afternoon humidity
35%
35%
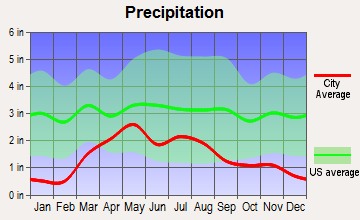
Precipitation - Yearly average
17.2 in
17.5 in
Snowfall - Yearly average
114 in
113.9 in
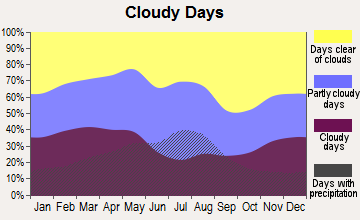
Clouds - Number of days clear of clouds
19.2%
19.2%
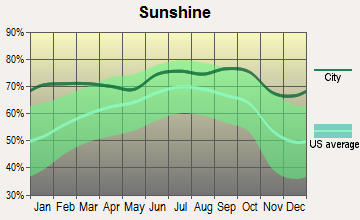
Sunshine amount - Average
75.6%
75.6%
Sunshine amount - Differences during a year
10%
10%
Sunshine amount - Maximum monthly
74%
74%
Sunshine amount - Minimum monthly
64%
64%
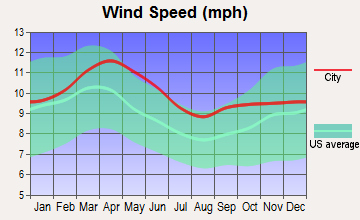
Wind speed - Average
8.6 mph
8.6 mph
Average climate in Northeast Jefferson, Colorado
Average climate in Southwest Arapahoe, Colorado
Air pollution
Type
AQI
CO
NO2
OZONE
PB
PM10
PM25
SO2
Year
Northeast Jefferson
Southwest Arapahoe
Northeast Jefferson
Southwest Arapahoe
Northeast Jefferson
Southwest Arapahoe
Northeast Jefferson
Southwest Arapahoe
Northeast Jefferson
Southwest Arapahoe
Northeast Jefferson
Southwest Arapahoe
Northeast Jefferson
Southwest Arapahoe
Northeast Jefferson
Southwest Arapahoe
2018
104
100
0.40
0.40
22.3
22.3
34.9
32.3
N/A
N/A
29.2
29.2
8.4
8.2
0.7
0.7
2017
97
95
0.40
0.40
22.5
22.6
34.5
32.6
N/A
N/A
22.0
22.0
8.2
8.2
0.8
0.8
2016
90
90
0.44
0.45
24.4
24.5
34.3
32.2
N/A
N/A
22.6
22.6
7.8
7.9
1.0
1.0
2015
101
101
0.45
0.46
24.1
24.2
32.8
30.7
N/A
N/A
21.0
20.8
9.5
9.6
1.0
1.0
2014
94
94
0.45
0.45
23.4
23.2
33.1
30.6
N/A
N/A
25.0
23.8
10.1
10.1
1.3
1.3
2013
84
85
0.40
0.41
21.0
20.7
33.6
31.2
N/A
N/A
24.3
23.1
N/A
N/A
1.5
1.4
2012
91
91
0.34
0.34
18.9
18.9
33.4
31.3
N/A
N/A
24.4
24.7
N/A
N/A
1.3
1.3
2011
90
91
0.34
0.33
18.1
18.1
32.0
30.4
N/A
N/A
23.8
23.8
N/A
N/A
1.5
1.6
2010
79
82
0.42
0.42
16.3
16.3
29.2
28.0
N/A
N/A
26.5
26.4
N/A
N/A
1.0
1.0
2009
76
79
0.38
0.37
14.1
14.1
27.9
26.9
0.005
0.005
22.5
22.4
N/A
N/A
1.3
1.3
2008
85
85
0.42
0.42
17.3
17.3
30.8
30.1
0.008
0.008
25.5
25.4
N/A
N/A
1.6
1.6
2007
96
96
0.39
0.40
20.6
20.6
29.0
27.6
0.007
0.007
29.1
29.4
N/A
N/A
1.2
1.2
2006
89
89
0.46
0.50
19.0
19.0
29.5
27.1
0.027
0.018
28.0
28.0
N/A
N/A
1.4
1.4
2005
86
86
0.51
0.57
21.3
21.3
26.0
23.6
0.119
0.090
29.6
29.8
N/A
N/A
1.5
1.5
2004
82
82
0.53
0.60
21.2
21.2
24.2
22.7
0.043
0.024
28.6
28.6
N/A
N/A
1.8
1.8
2003
106
106
0.52
0.59
21.2
21.2
25.9
24.5
0.046
0.027
32.6
32.6
N/A
N/A
1.9
1.9
2002
86
86
0.60
0.64
19.2
19.2
25.6
24.1
0.031
0.021
35.7
35.7
N/A
N/A
2.4
2.5
2001
95
95
0.69
0.80
20.8
22.2
23.7
22.2
0.034
0.021
32.6
32.6
N/A
N/A
2.6
2.6
2000
94
93
0.70
0.78
11.7
12.5
24.5
23.1
0.037
0.023
12.2
12.2
N/A
N/A
2.1
2.1
Natural disasters
Type
Northeast Jefferson
Southwest Arapahoe
Tornado activity compared to U.S. average
118.6%
125.3%
Earthquake activity compared to U.S. average
826.6%
815.2%
Natural disasters compared to U.S. average
12%
10%
Transportation
Public transportation in both areas is reliable, but Northeast Jefferson's network is more extensive. Commuting times are generally shorter in Northeast Jefferson, which can contribute to a higher quality of life for residents.
Transport
Type
Northeast Jefferson
Southwest Arapahoe
Amtrak stations nearby
1
1
Means of transportation to work
Type
Northeast Jefferson
Southwest Arapahoe
Bicycle
0.3%
0.4%
Bus
3.2%
2.6%
Carpooled
10%
8.7%
Car alone
80.3%
79.5%
Motorcycle
0.1%
0.1%
Walked
1.1%
1.9%
Average travel time to work
Type
Northeast Jefferson
Southwest Arapahoe
Average
26.6 min
23.6 min
Real Estate
Properties in Northeast Jefferson typically carry a higher price tag due to the area's amenities, lower crime rates, and better infrastructure. Southwest Arapahoe has a more modest real estate market, making it more accessible for new residents with lower budgets.
Houses and residents
Type
Northeast Jefferson
Southwest Arapahoe
Houses
180,978
74,676
Average household size (people)
2.4
2.3
Houses occupied
176,726 (97.7%)
72,320 (96.8%)
Houses occupied by owners
125,208 (70.8%)
51,515 (71.2%)
Houses occupied by renters
51,518 (29.2%)
20,805 (28.8%)
Median rent asked for vacant for-rent units
$1,659
$1,892
Median price asked for vacant for-sale houses and condos
$884,573
$836,561
Estimated median house or condo value
$522,903
$580,701
Median number of rooms in apartments
4
3.9
Median number of rooms in houses and condos
7.3
8.4
Renting percentage
31.3%
33.4%
Housing density (houses/condos per square mile)
1,047.5
1,076.2
Household income disparities
40.7%
39.5%
Housing units without a mortgage
21,689 (19.3%)
10,129 (21.9%)
Housing units with both a second mortgage and home equity loan
469 (0.4%)
188 (0.4%)
Housing units with a mortgage
90,716 (80.7%)
36,226 (78.1%)
Housing units with a home equity loan
9,124 (8.1%)
4,073 (8.8%)
Housing units with a second mortgage
16,287 (14.5%)
5,648 (12.2%)
Housing units lacking complete kitchen facilities
0.6%
0.6%
Housing units lacking complete plumbing facilities
0.3%
0.3%
Housing units in structures
Housing units in structures
Northeast Jefferson
Southwest Arapahoe
One, detached
63.9%
63.6%
One, attached
9.2%
9.1%
Two
1.4%
1.2%
3 or 4
3.2%
2.3%
5 to 9
5.3%
4.5%
10 to 19
6.7%
6.5%
20 to 49
5.5%
6.2%
50 or more
4.0%
4.8%
Mobile homes
0.7%
1.5%
Boats, RVs, vans, etc.
0.0%
0.1%
Median real estate property taxes paid for housing units
Self-employed workers in own not incorporated business
15,916
8,094
State government workers
7,028
2,412
Unpaid family workers
382
266
Industries and Occupations
The top industries in Northeast Jefferson include professional, scientific, and technical services, followed closely by health care. Southwest Arapahoe, however, leans more towards retail trade and public administration. These dominant industries affect the type of occupations commonly seen in both regions.
Northeast Jefferson and Southwest Arapahoe are both served by comprehensive healthcare systems. However, Northeast Jefferson might have the edge, thanks to a greater number of clinics and hospitals.
Health (county statistics)
Type
Northeast Jefferson
Southwest Arapahoe
General health status score of residents in this county from 1 (poor) to 5 (excellent)
Both locales prioritize quality public services and infrastructures. However, Northeast Jefferson boasts better maintenance of parks, roads, and public buildings. Residents and visitors alike will appreciate the area's commitment to high living standards.
Infrastructure
Type
Northeast Jefferson
Southwest Arapahoe
TV stations
19
16
Culture and Food
Cultural opportunities abound in both regions, with a range of traditional and contemporary events, institutions, and food scenes. Northeast Jefferson might be slightly ahead in this regard, featuring more diverse restaurant choices and cultural institutions.
Sports Teams
Southwest Arapahoe and Northeast Jefferson are both close enough to Denver to enjoy access to Colorado's major professional sports teams. This makes both places an exciting home for sports fans of any league.
 Northeast Jefferson, CO
 Southwest Arapahoe, CO