## Overview
Northeast Jefferson and Aurora are two enticing and diverse regions in Colorado, known for their unique charms and offerings. While Northeast Jefferson has a lower population and a quieter lifestyle, Aurora is the state's third largest city known for its vibrant community. Each presents distinct advantages for both residents and tourists, from the specific aspects of crime and safety, cost of living, education, work and economy, infrastructure, real estate, to culture, and healthcare.
#### Crime/Safety
While both Northeast Jefferson and Aurora are generally safe, crime rates vary. Northeast Jefferson has a lower overall crime rate compared to Aurora. Residents and tourists in Northeast Jefferson generally report feeling safer, particularly due to efficient local law enforcement. In Aurora, while crime rates are higher, continuous efforts are in place to improve safety, such as regular police patrolling and community engagement programs.
#### Weather
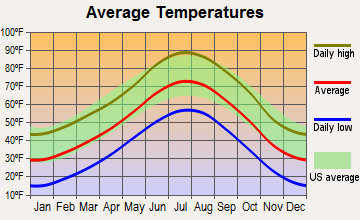
Weather-wise, both regions experience Colorado’s distinctive climate, characterized by cold, snowy winters and sunny, mild summers. Aurora could have slightly more snowfall due to its location towards the base of Rockies. It’s a treat for winter sports enthusiasts while Northeast Jefferson offers slightly milder and less snow-clad winters.
#### Cost of Living
When it comes to the cost of living, Northeast Jefferson tends to be more expensive. This includes necessities like groceries, housing, and transportation. Aurora, on the other hand, is more affordable and thus might be more attractive for families and individuals looking for budget-friendly living options.
#### Education
Educationally, both regions offer high-quality public and private schools, catering to diverse learning needs. Aurora may present more variety due to its larger size and population, offering more school choices for families. Northeast Jefferson, although smaller, provides a strong focus on quality education with an impressive student-teacher ratio.
#### Work and Economy
The work and economy section reveals differences as well. The economy in Northeast Jefferson is heavily centered on the tech and healthcare sectors. Aurora, on the other hand, has a more diverse economy with a combination of industries, such as retail, healthcare, and education.
#### Infrastructure
In terms of infrastructure, Aurora is better equipped as it's a larger city with more amenities and facilities compared to Northeast Jefferson. The latter, being a smaller place, has modest yet effective infrastructure, but may not offer as much variety or extensiveness.
#### Industries and Occupations
Major industries found in Northeast Jefferson include healthcare and technology. Meanwhile, Aurora boasts a more diverse industrial landscape, from healthcare to retail, education and public administration, illustrating multiple job opportunities across sectors.
#### Biggest Employers
Major employers in Northeast Jefferson are concentrated in the tech and health sectors, such as Scl Health and CSG Systems. Aurora, likewise, is home to some renowned employers like The Children's Hospital Colorado, Raytheon Company, and the University of Colorado Boulder, reflecting its diverse economy.
#### Real-Estate
The real estate market of both locations demonstrates differences too. Northeast Jefferson, being quieter and more rural, has a higher median home price. Aurora offers a more dynamic real estate market with more affordable homes and apartments, making it appealing to a wider range of prospective homeowners or renters.
#### Neighborhoods
Neighborhoods in Northeast Jefferson are quieter, more serene, making it an ideal choice for retirees or those seeking peace and tranquility. Aurora, in contrast, is marked by its variety of neighborhoods, from quiet suburban areas to bustling urban locales, catering to diverse preferences and lifestyles.
#### Transportation/Public Transit/Commuting
Transit facilities in Aurora are more extensive due to its city structure. It also provides easy access to the Denver metropolitan area using light rail and bus services, convenient for commuters. Northeast Jefferson, being more rural, has less public transit, but advantageous for those preferring private commuting or requiring less commuting for work or school.
#### City/State Sales Tax
Sales tax rates are slightly higher in Aurora, at around 8.5%, when compared to Northeast Jefferson's 7.96%. This slight increase in Aurora contributes to the city's more extensive infrastructure and services.
#### City/State Income Tax
State income tax is similar in both the regions as these rates are set at the state level in Colorado, currently at 4.63%.
#### City/State Property Tax
Property tax tends to be higher in Northeast Jefferson due to its higher median home prices. In Aurora, property taxes are generally lower, further adding to the appeal of the city's more affordable living costs.
#### Culture/Food
Culturally, Aurora stands out with its rich diversity, numerous festivals, and burgeoning food scene, pleasing residents and tourists alike. Northeast Jefferson, while smaller, still offers cultural experiences, with a focus on local history, outdoors, and farm-to-table culinary experiences.
#### Sports Teams
As for sports, Aurora is closely positioned to Denver, providing access to professional sports teams like Denver Broncos (NFL), Colorado Rockies (MLB), and Denver Nuggets (NBA). Northeast Jefferson, while not hosting professional sports teams, still offers plenty of outdoor recreational activities, from biking to hiking and fishing.
#### Geographical Conditions
Geographically, Aurora enjoys a location near the Rocky Mountains, offering picturesque views and ample outdoor activities. Northeast Jefferson, located on the high plains, offers beautiful landscapes, opportunities for agriculture, and tranquil living conditions.
#### Health Care
Healthcare in Northeast Jefferson and Aurora is exceptional, with excellent medical facilities and professionals. Noteworthy are the renowned University of Colorado Hospital in Aurora and the Lutheran Medical Center in Northeast Jefferson.
## Summary
In conclusion, both Northeast Jefferson and Aurora bring unique offerings for both residents and tourists. Northeast Jefferson offers quiet, serene living conditions, whereas Aurora is a more vibrant and diverse community. Unique features include Northeast Jefferson’s focus on tech and healthcare job markets and impressive education quality, while Aurora shines in its cultural diversity, extensive infrastructure, diverse job market, and accessible healthcare. Careful consideration of each area's offerings, from crime rates to healthcare, will guide the perfect choice tailored towards individual or family necessities and lifestyle preferences.
In Northeast Jefferson (Jefferson County), 51.6% voted for Democrats and 46.7% for Republicans in 2012 Presidential Election. In Aurora (Adams County), 57.3% voted for Democrats and 40.4% for Republicans.
Elections
Type
Democrats
Republicans
Other
Year
Northeast Jefferson
Aurora
Northeast Jefferson
Aurora
Northeast Jefferson
Aurora
2020
58.3%
57.1%
39.7%
40.7%
2.0%
2.2%
2016
49.2%
50.1%
42.3%
41.6%
8.6%
8.3%
2012
51.6%
57.3%
46.7%
40.4%
1.8%
2.3%
2008
54.0%
58.5%
44.9%
40.1%
1.1%
1.4%
2004
46.9%
50.7%
52.1%
48.4%
1.0%
0.9%
2000
43.0%
50.3%
51.1%
44.2%
5.9%
5.5%
1996
42.7%
51.3%
48.4%
38.9%
8.9%
9.8%
Breakdown of population affiliated with a religious congregation
Type
Adherents
Congregations
Religion
Northeast Jefferson
Aurora
Northeast Jefferson
Aurora
CATHOLIC CHURCH
15.0%
16.0%
5.1%
4.5%
EVANGELICAL LUTHERAN CHURCH IN AMERICA
1.7%
0.4%
4.2%
2.5%
SOUTHERN BAPTIST CONVENTION
1.2%
0.7%
7.5%
7.8%
LUTHERAN CHURCH
1.1%
0.7%
3.3%
3.3%
EPISCOPAL CHURCH
0.5%
0.1%
2.7%
1.2%
SEVENTH DAY ADVENTIST CHURCH
0.4%
0.4%
2.1%
3.3%
Weather and climate
Type
Northeast Jefferson
Aurora
Temperature - Average
47.9°F
49.9°F
Humidity - Average morning or afternoon humidity
50.6%
50.6%
Humidity - Differences between morning and afternoon humidity
20%
20%
Humidity - Maximum monthly morning or afternoon humidity
55%
55%
Humidity - Minimum monthly morning or afternoon humidity
35%
35%
Precipitation - Yearly average
17.2 in
16.9 in
Snowfall - Yearly average
114 in
114 in
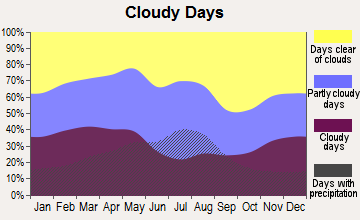
Clouds - Number of days clear of clouds
19.2%
19.2%
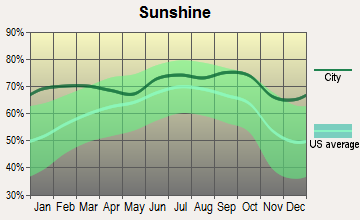
Sunshine amount - Average
75.6%
75.6%
Sunshine amount - Differences during a year
10%
10%
Sunshine amount - Maximum monthly
74%
74%
Sunshine amount - Minimum monthly
64%
64%
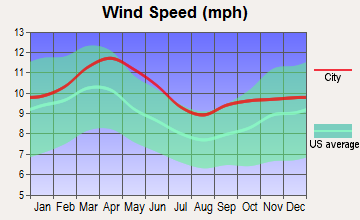
Wind speed - Average
8.6 mph
8.6 mph
Average climate in Northeast Jefferson, Colorado
Average climate in Aurora, Colorado
Air pollution
Type
AQI
CO
NO2
OZONE
PB
PM10
PM25
SO2
Year
Northeast Jefferson
Aurora
Northeast Jefferson
Aurora
Northeast Jefferson
Aurora
Northeast Jefferson
Aurora
Northeast Jefferson
Aurora
Northeast Jefferson
Aurora
Northeast Jefferson
Aurora
Northeast Jefferson
Aurora
2018
104
99
0.40
0.37
22.3
21.5
34.9
31.3
N/A
N/A
29.2
29.2
8.4
8.5
0.7
0.7
2017
97
95
0.40
0.37
22.5
21.9
34.5
31.1
N/A
N/A
22.0
22.0
8.2
8.5
0.8
0.9
2016
90
90
0.44
0.42
24.4
24.0
34.3
30.7
N/A
N/A
22.6
22.6
7.8
8.1
1.0
1.0
2015
101
101
0.45
0.44
24.1
22.8
32.8
29.5
N/A
N/A
21.0
20.6
9.5
9.5
1.0
1.1
2014
94
94
0.45
0.42
23.4
21.8
33.1
29.6
N/A
N/A
25.0
22.5
10.1
10.1
1.3
1.3
2013
84
84
0.40
0.39
21.0
19.6
33.6
29.9
N/A
N/A
24.3
21.9
N/A
N/A
1.5
1.4
2012
91
90
0.34
0.35
18.9
18.9
33.4
30.8
N/A
N/A
24.4
24.2
N/A
N/A
1.3
1.2
2011
90
91
0.34
0.34
18.1
18.1
32.0
30.9
N/A
N/A
23.8
23.8
N/A
N/A
1.5
1.5
2010
79
81
0.42
0.41
16.3
16.3
29.2
28.8
N/A
N/A
26.5
26.6
N/A
N/A
1.0
1.0
2009
76
79
0.38
0.37
14.1
14.1
27.9
27.1
0.005
0.005
22.5
22.6
N/A
N/A
1.3
1.3
2008
85
85
0.42
0.41
17.3
17.3
30.8
28.8
0.008
0.008
25.5
25.5
N/A
N/A
1.6
1.6
2007
96
96
0.39
0.42
20.6
20.6
29.0
25.4
0.007
0.007
29.1
28.8
N/A
N/A
1.2
1.2
2006
89
89
0.46
0.50
19.0
19.0
29.5
25.0
0.027
0.027
28.0
28.0
N/A
N/A
1.4
1.4
2005
86
86
0.51
0.57
21.3
21.3
26.0
22.5
0.119
0.109
29.6
29.6
N/A
N/A
1.5
1.5
2004
82
82
0.53
0.61
21.2
21.2
24.2
21.4
0.043
0.037
28.6
28.6
N/A
N/A
1.8
1.8
2003
106
106
0.52
0.62
21.2
21.2
25.9
23.1
0.046
0.040
32.6
32.6
N/A
N/A
1.9
1.9
2002
86
86
0.60
0.64
19.2
19.2
25.6
22.8
0.031
0.028
35.7
35.7
N/A
N/A
2.4
2.5
2001
95
95
0.69
0.79
20.8
24.0
23.7
20.4
0.034
0.030
32.6
32.6
N/A
N/A
2.6
2.6
2000
94
93
0.70
0.77
11.7
13.8
24.5
21.4
0.037
0.033
12.2
12.2
N/A
N/A
2.1
2.1
Natural disasters
Type
Northeast Jefferson
Aurora
Tornado activity compared to U.S. average
118.6%
138.7%
Earthquake activity compared to U.S. average
826.6%
796.4%
Natural disasters compared to U.S. average
12%
11%
Transport
Type
Northeast Jefferson
Aurora
Amtrak stations nearby
1
2
FAA registered aircraft
0
138
FAA registered aircraft manufacturers and dealers
0
19
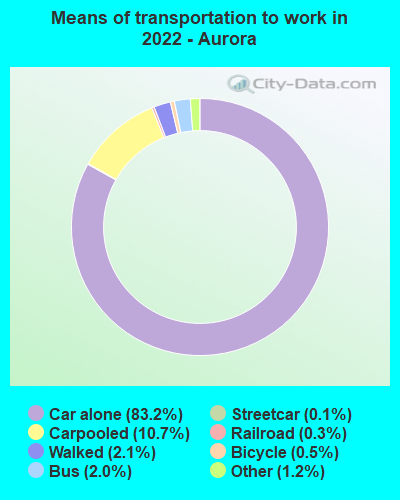
Means of transportation to work
Type
Northeast Jefferson
Aurora
Bicycle
0.3%
0.6%
Bus
3.2%
1.7%
Carpooled
10%
9.3%
Car alone
80.3%
84.4%
Motorcycle
0.1%
0.1%
Subway
0%
0.1%
Walked
1.1%
2.5%
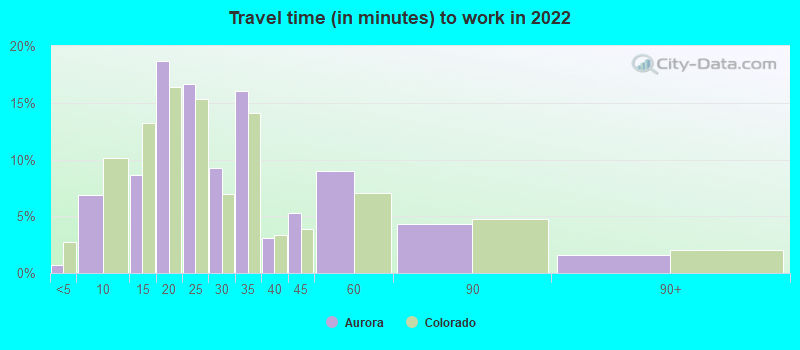
Average travel time to work
Type
Northeast Jefferson
Aurora
Average
26.6 min
28.3 min
Houses and residents
Type
Northeast Jefferson
Aurora
Houses
180,978
149,636
Average household size (people)
2.4
2.7
Houses occupied
176,726 (97.7%)
140,003 (93.6%)
Houses occupied by owners
125,208 (70.8%)
89,615 (64%)
Houses occupied by renters
51,518 (29.2%)
50,388 (36%)
Median rent asked for vacant for-rent units
$1,659
$2,036
Median price asked for vacant for-sale houses and condos
$884,573
$725,445
Estimated median house or condo value
$522,903
$411,400
Median number of rooms in apartments
4
3.9
Median number of rooms in houses and condos
7.3
6.5
Renting percentage
31.3%
40.1%
Housing density (houses/condos per square mile)
1,047.5
1,050.1
Household income disparities
40.7%
41.5%
Housing units without a mortgage
21,689 (19.3%)
424 (0.6%)
Housing units with both a second mortgage and home equity loan
469 (0.4%)
5,246 (7.8%)
Housing units with a mortgage
90,716 (80.7%)
66,791 (99.4%)
Housing units with a home equity loan
9,124 (8.1%)
176 (0.3%)
Housing units with a second mortgage
16,287 (14.5%)
6,860 (10.2%)
Housing units lacking complete kitchen facilities
0.6%
1%
Housing units lacking complete plumbing facilities
 Northeast Jefferson, CO
 Aurora, CO