North Las Vegas and Sunrise Manor straddle different sides of the Las Vegas metro area, with both sharing Nevada's distinctive cultural charm. North Las Vegas is an incorporated city, offering more urban amenities and services, while Sunrise Manor is an unincorporated area with a more suburban feel. Though differences exist in aspects such as crime, cost of living, and economy, both communities are deeply engrained in the bright lights and desert appeal of Nevada.
Distance between
North Las Vegas, NV and
Sunrise Manor, NV : 6.1 miles
North Las Vegas's population is larger by 40%. Its population has grown by 158,645 people (137.4%) since 2000. The population of Sunrise Manor has grown by 40,027 people (25.6%) during that time.
In terms of crime, both North Las Vegas and Sunrise Manor have higher than average crime rates compared to the national average, typical of many metro areas. However, North Las Vegas has made significant investments in law enforcement and has seen a decrease in some crime rates recently. Sunrise Manor, being unincorporated, is patrolled by the Clark County Sheriff, and residents may feel less attention is given to their crime concerns. Visitors should always take precautions and stay in well-trafficked, well-lit areas.
Cost of Living
The cost of living is generally lower in Sunrise Manor compared to North Las Vegas. Shopping, housing, and dining expenses tend to be cheaper in Sunrise Manor, likely due to its rather suburban nature against North Las Vegas' robust urban profile. However, this can also depend heavily on the specific neighborhoods in each area.
Income Tax
Like all of Nevada, neither North Las Vegas nor Sunrise Manor impose a state income tax. This puts more money in residents' pockets, making both locations attractive for workers and retirees alike.
Property Tax
Property taxes are slightly higher in North Las Vegas than in Sunrise Manor. However, both are still significantly lower than the national average, making the area attractive to homeowners and investors.
Sales Tax
Both locations are within Clark County, and share a state sales tax rate of 6.85%, with an additional county surtax of 1.25%, for a total of 8.10%. Neither location levies additional city sales taxes.
Income
Type
North Las Vegas
Sunrise Manor
Estimated median household income
$67,035
$51,287
Estimated per capita income
$26,498
$20,717
Cost of living index (U.S. average is 100)
98.3
98.2
If you make $50,000 in Sunrise Manor, you will have to make $50,051 in North Las Vegas to maintain the same standard of living.
Geographical Conditions
Both locales feature flat, desert terrain characteristic of the Las Vegas Valley with occasional hills. Sunrise Manor is situated near Frenchman Mountain, offering beautiful, scenic views and hiking options. North Las Vegas is more urban and flat, making it easier for development and construction.
North Las Vegas has a larger and more developed school system, with several high-performing schools. There are also more options for higher education, including community colleges and trade schools. In contrast, Sunrise Manor is part of Clark County School district which is larger and more diverse but struggles with high student-to-teacher ratios and funding issues.
The economy of both areas is remarkably similar as they're both heavily influenced by the Las Vegas metropolitan area. The chief industries are leisure, hospitality, and retail. Unemployment rates fluctuate but tend to be higher than the national average, due in part to the seasonal nature of much of the work.
Biggest Employers
The largest employers in North Las Vegas are the city itself, North Vista Hospital, and various casino resorts. In Sunrise Manor, the biggest employers are typically the Clark County School District and various area retailers. Tourism-driven establishments are important sources of employment in both areas.
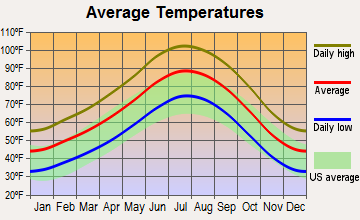
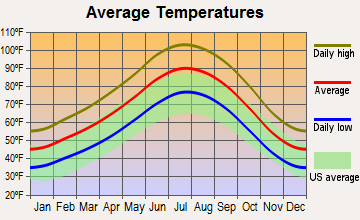
The weather is similar in both areas, with hot, dry summers and mild winters. With over 300 sunny days on average, the area is perfect for those who enjoy outdoor activities. However, the intense summer heat can be tough for some people, making proper hydration and sun protection essential.
Weather and climate
Type
North Las Vegas
Sunrise Manor
Temperature - Average
65.8°F
67.2°F
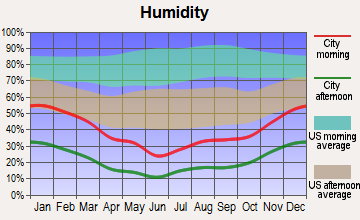
Humidity - Average morning or afternoon humidity
30.7%
30.8%
Humidity - Differences between morning and afternoon humidity
42%
42.1%
Humidity - Maximum monthly morning or afternoon humidity
52%
52.1%
Humidity - Minimum monthly morning or afternoon humidity
10%
10.1%
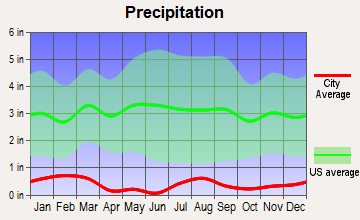
Precipitation - Yearly average
5.4 in
4.9 in
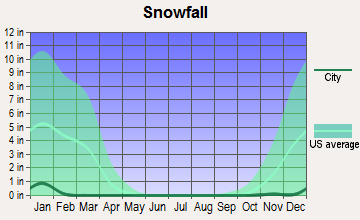
Snowfall - Yearly average
1.6 in
1.6 in
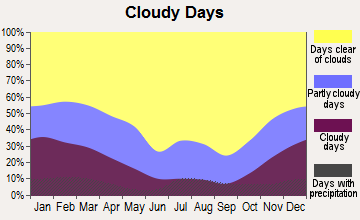
Clouds - Number of days clear of clouds
35.1%
35.1%
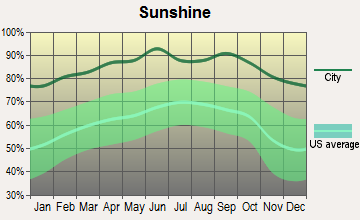
Sunshine amount - Average
91.8%
91.8%
Sunshine amount - Differences during a year
16%
16%
Sunshine amount - Maximum monthly
92%
91.9%
Sunshine amount - Minimum monthly
76%
75.9%
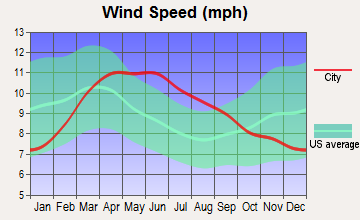
Wind speed - Average
9.2 mph
9.2 mph
Average climate in North Las Vegas, Nevada
Average climate in Sunrise Manor, Nevada
Air pollution
Type
AQI
CO
NO2
OZONE
PM10
PM25
SO2
Year
North Las Vegas
Sunrise Manor
North Las Vegas
Sunrise Manor
North Las Vegas
Sunrise Manor
North Las Vegas
Sunrise Manor
North Las Vegas
Sunrise Manor
North Las Vegas
Sunrise Manor
North Las Vegas
Sunrise Manor
2018
100
100
0.42
0.42
14.2
14.9
35.4
31.7
27.7
36.2
7.2
10.3
0.7
0.7
2017
101
101
0.26
0.37
14.2
15.4
29.9
29.5
22.2
28.7
8.6
7.6
0.8
0.8
2016
93
93
0.37
0.39
11.9
14.6
28.4
29.7
22.8
28.1
10.2
8.2
0.8
0.8
2015
92
92
0.34
0.42
13.0
15.1
28.2
28.2
21.2
25.4
9.3
9.4
1.2
1.2
2014
91
91
0.37
0.44
11.3
13.2
27.8
27.1
23.8
29.8
10.1
10.0
1.4
1.4
2013
103
103
0.48
0.42
10.4
13.3
28.4
28.4
24.4
27.1
9.5
8.8
1.5
1.5
2012
96
96
0.52
0.46
6.0
6.8
29.5
33.1
24.8
29.5
8.8
7.4
1.4
1.4
2011
85
84
0.36
0.47
5.3
5.3
29.2
30.0
20.4
22.7
8.0
7.7
1.2
1.2
2010
81
81
0.51
0.49
5.7
5.7
28.6
30.3
18.2
19.5
7.2
7.1
N/A
N/A
2009
87
87
0.55
0.63
6.0
6.0
27.6
29.0
24.3
25.0
8.3
8.3
N/A
N/A
2008
82
82
0.66
0.60
8.2
8.2
26.3
29.6
N/A
N/A
9.5
9.2
N/A
N/A
2007
97
97
0.48
0.45
12.5
14.9
26.3
28.3
N/A
N/A
9.3
9.1
0.1
0.1
2006
102
102
0.67
0.63
14.6
18.0
26.3
28.7
N/A
N/A
9.7
9.8
0.8
0.8
2005
100
100
0.71
0.47
16.3
18.9
25.1
27.4
N/A
N/A
9.7
9.6
5.3
5.3
2004
86
86
0.63
0.52
17.4
18.7
25.5
28.7
N/A
N/A
N/A
N/A
1.6
1.6
2003
99
99
0.62
0.57
18.0
19.8
25.1
28.3
N/A
N/A
N/A
N/A
0.9
1.0
2002
94
94
0.35
0.49
17.7
19.7
24.1
27.1
N/A
N/A
N/A
N/A
0.6
0.7
2001
95
95
0.32
0.54
16.7
21.4
24.1
26.6
N/A
N/A
N/A
N/A
0.9
1.0
2000
95
95
0.34
0.51
16.2
20.4
24.0
26.2
N/A
N/A
N/A
N/A
0.4
0.4
Natural disasters
Type
North Las Vegas
Sunrise Manor
Tornado activity compared to U.S. average
2.1%
2.3%
Earthquake activity compared to U.S. average
6,003.8%
5,918%
Natural disasters compared to U.S. average
12%
12%
Transportation
Both North Las Vegas and Sunrise Manor provide good access to the wider Las Vegas area via the interstate, and public transit options are available. North Las Vegas offers more substantial bus service and better-developed roadways, as Sunrise Manor relies more on county-level transit services.
Transport
Type
North Las Vegas
Sunrise Manor
Amtrak stations nearby
1
1
FAA registered aircraft
123
0
FAA registered aircraft manufacturers and dealers
16
0
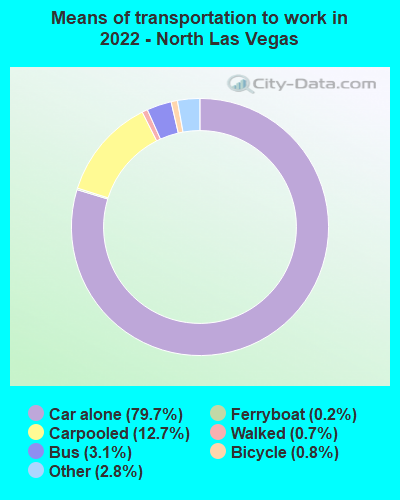
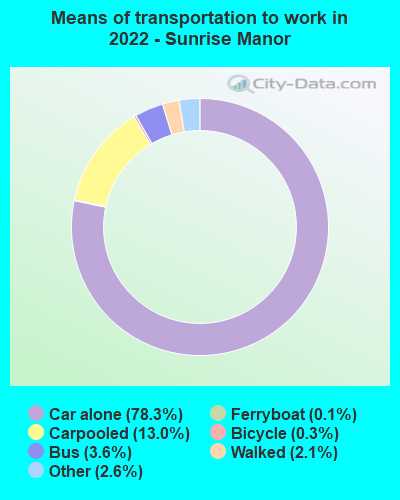
Means of transportation to work
Type
North Las Vegas
Sunrise Manor
Bicycle
0.4%
0.5%
Bus
1.6%
3.5%
Carpooled
13.4%
12.7%
Car alone
80.7%
78.5%
Ferryboat
0%
0.1%
Motorcycle
0.4%
0.2%
Walked
0.7%
2.1%
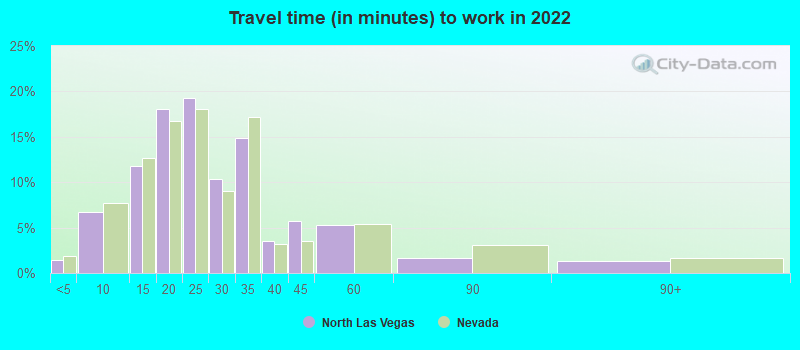
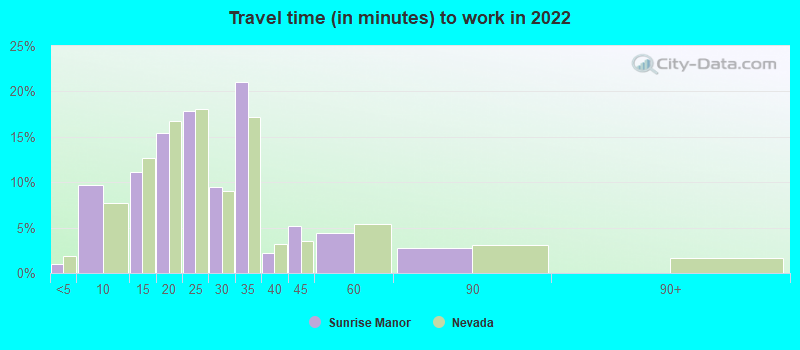
Average travel time to work
Type
North Las Vegas
Sunrise Manor
Average
25.8 min
26.6 min
Other means
25.9 min
24.9 min
Public transportation
55.9 min
54.2 min
Private vehicle occupancy
Type
North Las Vegas
Sunrise Manor
Average
1.2
1.3
Drove alone
86.9%
79.8%
In 2 person carpool
9.2%
10.7%
In 3 person carpool
2.9%
6.9%
In 4 person carpool
0.7%
2.2%
In 5-6 person carpool
0.1%
0.2%
In 7+ person carpool
0.1%
0.3%
How many people usually rode to work in the car, truck or van.
Real Estate
The real estate market is somewhat hotter in North Las Vegas especially for people interested in new construction. In Sunrise Manor, housing prices are a bit lower and afford more budget-friendly options. Both areas offer a mix of condos, single-family homes, and rentals thus serving to diverse housing needs.
Neighborhoods
North Las Vegas is home to a sprawling web of neighborhoods, each with its unique personality—from the master-planned communities of Aliante and Eldorado to the established character of the Old Town district. Sunrise Manor comprises mainly suburban, family-friendly neighborhoods, including the diverse and picturesque Hollywood Hills and Sunrise Mountain areas.
Houses and residents
Type
North Las Vegas
Sunrise Manor
Houses
91,034
70,430
Average household size (people)
3.2
3.1
Median year apartment built
2002
1991
Median year house/condo built
2003
1992
Length of stay in the house since moving in
9.6 years
10.9 years
Houses occupied
85,966 (94.4%)
62,737 (89.1%)
Houses occupied by owners
51,443 (59.8%)
34,333 (54.7%)
Houses occupied by renters
34,523 (40.2%)
28,404 (45.3%)
Median rent asked for vacant for-rent units
$1,592
$946.95
Median monthly housing costs
$1,378
$1,079
Median price asked for vacant for-sale houses and condos
$288,164
$248,865
Estimated median house or condo value
$335,200
$262,500
Median numbers of rooms
5.6
4.9
Median number of rooms in apartments
4.6
4.3
Median number of rooms in houses and condos
6.3
5.5
Median house price - detached houses
$347,582
$303,581
Median house price - in 3-to-4-unit structures
$321,737
$192,531
Median house price - in 5 or more unit structures
$193,128
$143,751
Median house price - mobile homes
$352,751
$85,097
Median house price - Townhouses or other attached units
$462,203
$220,548
Median house price - All housing units
$349,615
$255,056
Median house age
18
29
Renting percentage
37.6%
44.1%
Housing density (houses/condos per square mile)
1,159.5
1,841.4
House value disparities
19.6%
31.8%
Household income disparities
40.2%
42%
Median household income for houses/condes with a mortgage
$87,018
$76,184
Median household income for apartments without a mortgage
$67,367
$52,281
Housing units without a mortgage
317 (0.8%)
315 (1.5%)
Housing units with both a second mortgage and home equity loan
1,013 (2.6%)
885 (4.3%)
Housing units with a mortgage
39,101 (99.2%)
20,176 (98.5%)
Housing units with a home equity loan
0 (0%)
126 (0.6%)
Housing units with a second mortgage
1,247 (3.2%)
1,144 (5.6%)
House/condo owner moved in on average (years ago)
6
9
House/condo renter moved in on average (years ago)
1
2
Housing units lacking complete kitchen facilities
0.9%
2.8%
Housing units lacking complete plumbing facilities
1.4%
1.8%
Housing units in structures
Housing units in structures
North Las Vegas
Sunrise Manor
One, detached
75.9%
52.3%
One, attached
3.1%
4.8%
Two
1.1%
0.5%
3 or 4
4.8%
9.9%
5 to 9
4.7%
7.2%
10 to 19
3.0%
5.3%
20 to 49
2.3%
3.2%
50 or more
3.6%
3.6%
Mobile homes
1.4%
13.0%
Boats, RVs, vans, etc.
0.0%
0.1%
Median real estate property taxes paid for housing units
Self-employed workers in own not incorporated business
4,201
3,935
State government workers
2,853
1,668
Unpaid family workers
530
85
Industries and Occupations
Leisure, hospitality, construction, and healthcare are among the leading industries in both North Las Vegas and Sunrise Manor. Being parts of the Las Vegas metropolitan area, many residents work in related occupations such as food service, sales, and administrative roles.
Building and grounds cleaning and maintenance occupations
5.8%
12.7%
Material moving occupations
5.6%
6.3%
Personal care and service occupations
4.1%
3.0%
Health diagnosing and treating practitioners and other technical occupations
3.3%
0.9%
Production occupations
2.3%
4.4%
Firefighting and prevention, and other protective service workers including supervisors
2.0%
2.4%
Transportation occupations
1.9%
1.7%
Law enforcement workers including supervisors
1.7%
0.6%
Health technologists and technicians
1.5%
1.9%
Arts, design, entertainment, sports, and media occupations
1.4%
1.3%
Community and social service occupations
1.4%
1.6%
Legal occupations
0.7%
2.1%
Health Care
North Las Vegas has more healthcare facilities, including hospitals and clinics, due to its city designation. Sunrise Manor, on the other hand, has lesser but still ample healthcare options, including many local clinics, with the main hospitals situated in nearby Las Vegas.
North Las Vegas boasts more developed infrastructure due to it being a city on its own. From parks to public works, North Las Vegas tends to have more amenities. In contrast, Sunrise Manor, although quieter and more suburban, struggles a bit in terms of infrastructural development because, since it's unincorporated, relies on broader county-level decisions for resources.
HMDA - Conventional home purchase loans - Applications denied
Year
North Las Vegas
Sunrise Manor
1999
426
1,339
2000
190
88
2001
110
67
2002
152
45
2003
1,025
895
2004
2,286
1,722
2005
3,742
2,257
2006
3,581
2,144
2007
1,737
1,088
2008
574
283
2009
330
177
Culture and Food
Given the Las Vegas influence, both North Las Vegas and Sunrise Manor benefit from a vibrant food and culture scene. From local steakhouses to cultural food establishments, there is substantial culinary diversity. Local cultural events are plentiful, though North Las Vegas boasts more given the urban nature of the city.
Sports Teams
Neither North Las Vegas nor Sunrise Manor house major sports teams of their own but residents can enjoy Las Vegas' vibrant sports scene, home to the Las Vegas Raiders (NFL), Golden Knights (NHL), and the Las Vegas Aces (WNBA). There's also the Las Vegas Motor Speedway in North Las Vegas for NASCAR fans.


 North Las Vegas, NV
 Sunrise Manor, NV