North Coast, CA vs Southwest San Gabriel Valley, CA
North Coast, CA and Southwest San Gabriel Valley, CA, provide distinct experiences shaped by their unique geographic, cultural, and economic factors. North Coast is known for its serene coastal natural beauty while Southwest San Gabriel Valley offers cultural blend and a vibrant economy. The comparison between these two cities focuses on numerous factors like crime/safety, weather, cost of living, education, economy, industries, and much more to give insight for potential relocators and visitors seeking experience.
North Coast generally maintains a relatively low crime rate, creating a more secure environment for both locals and tourists. There is a presence of community-oriented police enforcement. However, Southwest San Gabriel Valley, given its proximity to Los Angeles, deals with higher crime rates. Despite this, concerted efforts by local law enforcement agencies have seen a significant decrease in crime in recent years.
Cost of Living
Living in the North Coast can be relatively cost-intensive due to higher property costs and general living expenses. Southwest San Gabriel Valley, while also expensive, offers varied options with livable suburbs and higher-end communities. Still, both areas have expenses higher than the national average due to their Californian location.
Income Tax
Both regions follow the California state income tax rates. California is known for having high state income tax rates, but the municipalities themselves do not impose additional income taxes.
Property Tax
Property tax can be on the higher spectrum in North Coast due to higher property values. However, in Southwest San Gabriel Valley property tax varies significantly based on the type and location of property.
Sales Tax
Residents in both North Coast and Southwest San Gabriel Valley bear the standard rate of California sales tax, with additional city and county taxes applying in some areas. Southwest San Gabriel Valley may incur additional district taxes.
Income
Type
North Coast
Southwest San Gabriel Valley
Estimated median household income
$102,807
$73,720
Estimated per capita income
$50,809
$29,945
Cost of living index (U.S. average is 100)
96.1
161.2
If you make $50,000 in North Coast, you will have to make $83,871 in Southwest San Gabriel Valley to maintain the same standard of living.
Geographical Conditions
North Coast offers an expansive coastal line, beautiful beaches, and panoramic cliffside views. The Southwest San Gabriel Valley has a combination of urban and suburban landscapes and is closer to the San Gabriel Mountains and various parks.
Geographical information
Type
North Coast
Southwest San Gabriel Valley
Land area
59.4 sq. miles
35.3 sq. miles
Population density
6,335.5 people per sq. mile
9,252.7 people per sq. mile
Relative area comparison
North Coast, CA Southwest San Gabriel Valley, CA
Education
Education in both regions is commendable. North Coast schools come with a focus on environmental education thanks to the city's natural decor, while schools in the Southwest San Gabriel Valley benefit from proximity to educational powerhouses like the University of Southern California and numerous community colleges offering varied courses and programs.
North Coast's economy revolves heavily around tourism, retail, wineries, and fishing, given its coastal appeal. On the other hand, Southwest San Gabriel Valley enjoys a healthy economy driven by the motion picture, television industry, healthcare sector, technological start-ups, and diverse local businesses.
Biggest Employers
In North Coast, the biggest employers include local government, educational services, healthcare firms, retail, and hospitality sectors. Southwest San Gabriel Valley’s economy is underpinned by large employers such as the Los Angeles County government, hospitals, and film studios.
In North Coast (Orange County), 45.8% voted for Democrats and 52.0% for Republicans in 2012 Presidential Election. In Southwest San Gabriel Valley (Los Angeles County), 69.7% voted for Democrats and 27.8% for Republicans.
Elections
Type
Democrats
Republicans
Other
Year
North Coast
Southwest San Gabriel Valley
North Coast
Southwest San Gabriel Valley
North Coast
Southwest San Gabriel Valley
2020
53.6%
71.0%
44.6%
26.9%
1.8%
2.1%
2016
50.9%
72.0%
42.4%
22.5%
6.7%
5.5%
2012
45.8%
69.7%
52.0%
27.8%
2.3%
2.4%
2008
47.8%
69.2%
50.3%
28.8%
1.9%
1.9%
2004
39.3%
63.3%
60.2%
35.7%
0.5%
1.0%
2000
40.4%
63.6%
55.9%
32.4%
3.7%
4.0%
1996
37.9%
59.3%
51.7%
31.0%
10.5%
9.7%
Breakdown of population affiliated with a religious congregation
Type
Adherents
Congregations
Religion
North Coast
Southwest San Gabriel Valley
North Coast
Southwest San Gabriel Valley
CATHOLIC CHURCH
26.5%
36.1%
4.4%
4.7%
SOUTHERN BAPTIST CONVENTION
2.3%
1.0%
8.8%
9.0%
MUSLIM ESTIMATE
0.8%
0.7%
1.3%
1.0%
LUTHERAN CHURCH
0.6%
0.2%
2.0%
1.6%
EPISCOPAL CHURCH
0.4%
0.4%
1.4%
1.4%
EVANGELICAL LUTHERAN CHURCH IN AMERICA
0.4%
0.2%
2.3%
1.9%
SEVENTH DAY ADVENTIST CHURCH
0.4%
0.5%
1.3%
2.4%
REFORMED CHURCH IN AMERICA
0.3%
0.1%
0.2%
0.2%
AMERICAN BAPTIST CHURCHES IN THE USA
0.2%
0.5%
1.7%
3.1%
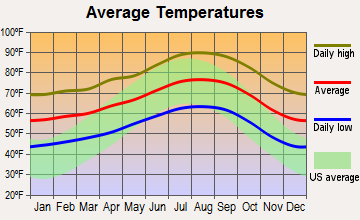
Weather
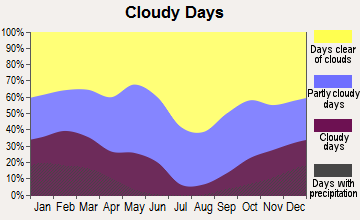
The weather in both regions varies considerably. North Coast, being a coastal region, has a mild, cooler climate with constant rainfall throughout the year. It offers foggy mornings and cooler summers, which appeals to people seeking escape from heat. Conversely, Southwest San Gabriel Valley has a Mediterranean climate featuring warm, dry summers and mild, wet winters, promoting a vibrant outdoor culture.
Weather and climate
Type
North Coast
Southwest San Gabriel Valley
Temperature - Average
64.4°F
66.3°F
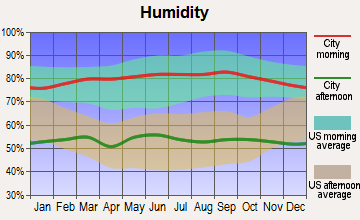
Humidity - Average morning or afternoon humidity
70.2%
61.4%
Humidity - Differences between morning and afternoon humidity
26.7%
16.5%
Humidity - Maximum monthly morning or afternoon humidity
78.7%
65.8%
Humidity - Minimum monthly morning or afternoon humidity
52%
49.3%
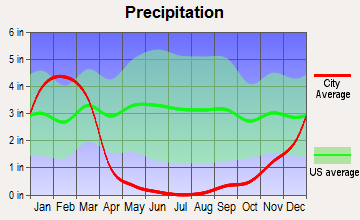
Precipitation - Yearly average
13 in
17.6 in
Snowfall - Yearly average
0 in
0 in
Clouds - Number of days clear of clouds
26.5%
30.1%
Sunshine amount - Average
78.4%
78.4%
Sunshine amount - Differences during a year
21.9%
22%
Sunshine amount - Maximum monthly
84.9%
85%
Sunshine amount - Minimum monthly
62.9%
63%
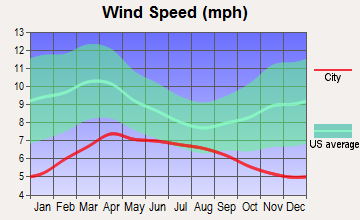
Wind speed - Average
6 mph
2.3 mph
Average climate in North Coast, California
Average climate in Southwest San Gabriel Valley, California
Air pollution
Type
AQI
CO
NO2
OZONE
PB
PM10
PM25
SO2
Year
North Coast
Southwest San Gabriel Valley
North Coast
Southwest San Gabriel Valley
North Coast
Southwest San Gabriel Valley
North Coast
Southwest San Gabriel Valley
North Coast
Southwest San Gabriel Valley
North Coast
Southwest San Gabriel Valley
North Coast
Southwest San Gabriel Valley
North Coast
Southwest San Gabriel Valley
2018
119
140
0.35
0.39
14.4
14.2
26.1
26.6
N/A
0.008
27.5
27.5
12.6
15.1
0.7
0.4
2017
116
142
0.34
0.38
13.8
15.1
28.8
27.8
N/A
0.007
26.7
30.2
13.8
15.3
0.5
0.5
2016
102
128
0.33
0.36
12.2
15.2
29.3
26.5
N/A
0.007
24.1
27.8
12.5
14.3
0.2
0.4
2015
106
137
0.32
0.36
13.2
15.3
29.8
26.7
N/A
0.006
25.0
27.6
14.5
16.4
0.2
0.3
2014
110
138
0.29
0.39
12.9
16.3
28.6
26.8
N/A
0.007
26.7
29.9
15.5
18.0
0.4
0.4
2013
107
140
0.34
0.44
13.9
17.5
27.8
25.2
0.003
0.007
29.5
28.3
14.2
17.0
0.3
0.4
2012
103
144
0.30
0.47
12.7
17.7
26.8
25.0
0.004
0.007
28.2
27.6
14.3
18.1
0.1
0.5
2011
109
142
0.31
0.50
14.7
19.3
27.0
23.6
0.006
0.008
27.7
29.8
15.9
17.6
0.7
0.4
2010
102
128
0.33
0.52
14.3
19.4
26.2
22.9
0.011
0.020
23.6
30.0
14.0
16.3
0.6
0.5
2009
118
150
0.35
0.43
15.5
21.5
27.6
23.5
0.009
0.011
24.3
40.0
14.5
18.0
1.1
0.5
2008
124
152
0.39
0.53
16.5
23.5
28.2
22.8
0.010
0.014
29.5
39.1
21.6
18.3
1.1
0.6
2007
100
128
0.36
0.58
16.3
24.2
27.0
21.8
0.012
0.017
N/A
N/A
N/A
N/A
0.8
1.1
2006
114
125
0.40
0.63
17.2
24.6
26.4
22.1
0.007
0.009
N/A
N/A
N/A
N/A
1.3
1.7
2005
95
123
0.39
0.66
17.7
25.6
27.9
20.5
0.012
0.015
N/A
N/A
N/A
N/A
1.3
2.1
2004
119
132
0.50
0.77
19.2
27.7
30.5
22.9
0.014
0.019
N/A
N/A
N/A
N/A
1.6
2.4
2003
122
143
0.64
0.98
21.9
31.8
28.9
22.0
0.030
0.027
N/A
N/A
N/A
N/A
1.1
1.8
2002
106
137
0.65
1.00
22.0
33.0
25.5
21.1
0.018
0.025
N/A
N/A
N/A
N/A
1.8
2.4
2001
116
143
0.73
1.11
22.0
34.2
25.4
18.9
0.033
0.039
N/A
N/A
N/A
N/A
1.5
2.4
2000
125
147
0.80
1.12
24.4
33.4
24.0
18.9
0.027
0.033
N/A
N/A
N/A
N/A
1.9
1.4
Natural disasters
Type
North Coast
Southwest San Gabriel Valley
Tornado activity compared to U.S. average
18.6%
18%
Earthquake activity compared to U.S. average
6,843.6%
7,182.3%
Natural disasters compared to U.S. average
32%
57%
Transportation
Both regions offer convenient transportation options. North Coast has State Routes and reliable local bus transportation. Southwest San Gabriel Valley is served by a network of Freeways and roads, multiple public transit options, and is in proximity to major airports.
Transport
Type
North Coast
Southwest San Gabriel Valley
Amtrak stations nearby
3
3
Means of transportation to work
Type
North Coast
Southwest San Gabriel Valley
Bicycle
0.7%
0.5%
Bus
1.2%
4.7%
Carpooled
10.7%
16.1%
Car alone
81.4%
73%
Motorcycle
0.2%
0.1%
Walked
1.4%
2.5%
Average travel time to work
Type
North Coast
Southwest San Gabriel Valley
Average
28.8 min
29.1 min
Real Estate
North Coast's real estate market is quite active owing to its coastal beauty, attracting buyers looking for vacation properties. Southwest San Gabriel Valley real estate is diverse, offering both high-end and affordable housing options, ranging from single-family homes to apartments.
Neighborhoods
North Coast neighborhoods are generally quiet, featuring a mix of rustic and modern housing spread along the coast. Neighborhoods in Southwest San Gabriel Valley are more vibrant and culturally diverse, with options from quiet suburban communities to more active urban centers.
Houses and residents
Type
North Coast
Southwest San Gabriel Valley
Houses
137,450
102,656
Average household size (people)
2.7
3.1
Houses occupied
133,254 (96.9%)
99,543 (97%)
Houses occupied by owners
84,546 (63.4%)
47,333 (47.6%)
Houses occupied by renters
48,708 (36.6%)
52,210 (52.5%)
Median rent asked for vacant for-rent units
$2,340
$1,828
Median price asked for vacant for-sale houses and condos
$1,099,558
$1,138,428
Estimated median house or condo value
$883,291
$723,161
Median number of rooms in apartments
3.9
3.7
Median number of rooms in houses and condos
6.1
5.9
Renting percentage
37.7%
51.7%
Housing density (houses/condos per square mile)
2,312.7
2,909.6
Household income disparities
41.2%
44%
Housing units without a mortgage
13,396 (19.5%)
13,166 (31.1%)
Housing units with both a second mortgage and home equity loan
282 (0.4%)
88 (0.2%)
Housing units with a mortgage
55,188 (80.5%)
29,118 (68.9%)
Housing units with a home equity loan
6,297 (9.2%)
2,557 (6%)
Housing units with a second mortgage
7,643 (11.1%)
2,975 (7%)
Housing units lacking complete kitchen facilities
1%
1.5%
Housing units lacking complete plumbing facilities
0.5%
0.9%
Housing units in structures
Housing units in structures
North Coast
Southwest San Gabriel Valley
One, detached
50.7%
53.7%
One, attached
11.8%
10.1%
Two
1.5%
3.2%
3 or 4
8.7%
7.4%
5 to 9
5.6%
9.1%
10 to 19
5.6%
6.4%
20 to 49
2.9%
5.5%
50 or more
8.2%
3.8%
Mobile homes
4.9%
0.7%
Boats, RVs, vans, etc.
0.1%
0.1%
Median real estate property taxes paid for housing units
Self-employed workers in own not incorporated business
15,532
8,660
State government workers
5,751
4,158
Unpaid family workers
744
639
Industries and Occupations
Key industries in the North Coast include tourism, wine production, and fishing, offering numerous job opportunities. On the contrary, Southwest San Gabriel Valley has a diverse range of industries including entertainment, healthcare, and technology, offering a wide spectrum of occupations.
Healthcare in North Coast is satisfactory with several community hospitals and clinics. Southwest San Gabriel Valley benefits from numerous large hospital systems, specialized care centres, and proximity to world-renowned medical institutions.
Health (county statistics)
Type
North Coast
Southwest San Gabriel Valley
General health status score of residents in this county from 1 (poor) to 5 (excellent)
North Coast features predominantly low-level buildings, with charming coastal and rustic architecture. The Southwest San Gabriel Valley showcases varied architectural styles from suburban homes to bustling urban centers, and excellent healthcare facilities, underpinned by robust public infrastructure.
Infrastructure
Type
North Coast
Southwest San Gabriel Valley
TV stations
2
26
Culture and Food
North Coast is known for its laid-back culture, seafood joints, and numerous wineries. Southwest San Gabriel Valley offers a mix of various cultures with diverse food choices, from delicious international cuisine to local favorite food trucks.
Sports Teams
North Coast does not have major sports teams, but locals engage in watersports and outdoor activities. Southwest San Gabriel Valley residents support LA based major leagues and enjoy access to numerous professional sports events nearby.
 North Coast, CA
 Southwest San Gabriel Valley, CA