North Coast, CA and Pomona, CA both offer different but appealing California living experiences. North Coast, renowned for its breathtaking coastal scenery, attracts many tourists and locals alike with its natural wonders and relaxed lifestyle. On the other hand, Pomona, located in Los Angeles County, provides a diverse, urban environment with easy access to Los Angeles and its associated opportunities. This analysis will delve into various aspects such as crime/safety, weather, cost of living, education, work and economy, infrastructure, industries and occupations, biggest employers, real-estate, neighborhoods, transportation/public transit, taxes, culture/food, sports teams, geographical conditions, and health care to offer a comprehensive comparison between these two distinct Californian cities.
Comparing crime rates, North Coast generally experiences lower crime rates than Pomona due to its smaller population and remote location. Being mostly rural, North Coast lacks the gang-related activities seen in urban areas like Pomona. In contrast, Pomona's crime rate is higher, reflecting the challenges larger cities often face with crime control. However, Pomona Police Department is active in implementing crime prevention initiatives to ensure safety.
Cost of Living
Cost of living is generally lower in the North Coast due to its distance from major urban centers. Housing costs are more reasonable, and everyday expenses like groceries are typically cheaper. Contrastingly, Pomona, being in the Greater Los Angeles area, has a higher cost of living. Housing is more expensive, and so are the general living expenses compared to the state's rural areas.
Income Tax
Income tax is also the same across the state, regardless of residing in North Coast or Pomona. The tax system is progressive, with the tax rate increasing with income.
Property Tax
Property taxes vary based on the assessed value of the property. This means homeowners in Pomona, where real estate prices are generally higher, potentially pay higher property taxes than those in North Coast.
Sales Tax
Sales tax in North Coast and Pomona is subject to California state sales tax, which is the same across the state. However, some cities impose additional local city taxes, which can slightly increase the overall sales tax.
Income
Type
North Coast
Pomona
Estimated median household income
$102,807
$70,494
Estimated per capita income
$50,809
$24,692
Cost of living index (U.S. average is 100)
96.1
136.8
If you make $50,000 in North Coast, you will have to make $71,176 in Pomona to maintain the same standard of living.
Geographical Conditions
North Coast is characterized by its breathtaking coastline, forests, cliffs, and lakes, offering unlimited opportunities for outdoor recreation. In contrast, Pomona is located in a valley and is more urban, characterized by its cityscape rather than natural features.
Geographical information
Type
North Coast
Pomona
Land area
59.4 sq. miles
22.8 sq. miles
Population density
6,335.5 people per sq. mile
6,494.6 people per sq. mile
Relative area comparison
North Coast, CA Pomona, CA
Education
North Coast boasts of reputable schools and educators, but it does not have the variety or volume of educational resources present in Pomona. The latter lies in proximity to a larger number of universities and colleges, including the prestigious Claremont Colleges. Additionally, Pomona Unified School District has numerous high performing schools for younger students.
North Coast's economy is supported by fishing, tourism, and forestry. There are abundant job opportunities in these sectors. Pomona, on the other hand, is heavily reliant on education, healthcare, and service sectors for its economic development. Therefore, job seekers from different industry backgrounds may find more diverse work opportunities in Pomona.
Biggest Employers
In North Coast, some of the largest employers are the local government, fisheries, and forestry companies. A considerable number of residents are also employed in the local tourism industry. In Pomona, the largest employers include Pomona Valley Hospital Medical Center, California State Polytechnic University, Pomona, and Pomona Unified School District.
In North Coast (Orange County), 45.8% voted for Democrats and 52.0% for Republicans in 2012 Presidential Election. In Pomona (Los Angeles County), 69.7% voted for Democrats and 27.8% for Republicans.
Elections
Type
Democrats
Republicans
Other
Year
North Coast
Pomona
North Coast
Pomona
North Coast
Pomona
2020
53.6%
71.0%
44.6%
26.9%
1.8%
2.1%
2016
50.9%
72.0%
42.4%
22.5%
6.7%
5.5%
2012
45.8%
69.7%
52.0%
27.8%
2.3%
2.4%
2008
47.8%
69.2%
50.3%
28.8%
1.9%
1.9%
2004
39.3%
63.3%
60.2%
35.7%
0.5%
1.0%
2000
40.4%
63.6%
55.9%
32.4%
3.7%
4.0%
1996
37.9%
59.3%
51.7%
31.0%
10.5%
9.7%
Breakdown of population affiliated with a religious congregation
Type
Adherents
Congregations
Religion
North Coast
Pomona
North Coast
Pomona
CATHOLIC CHURCH
26.5%
36.1%
4.4%
4.7%
SOUTHERN BAPTIST CONVENTION
2.3%
1.0%
8.8%
9.0%
MUSLIM ESTIMATE
0.8%
0.7%
1.3%
1.0%
LUTHERAN CHURCH
0.6%
0.2%
2.0%
1.6%
EPISCOPAL CHURCH
0.4%
0.4%
1.4%
1.4%
EVANGELICAL LUTHERAN CHURCH IN AMERICA
0.4%
0.2%
2.3%
1.9%
SEVENTH DAY ADVENTIST CHURCH
0.4%
0.5%
1.3%
2.4%
REFORMED CHURCH IN AMERICA
0.3%
0.1%
0.2%
0.2%
AMERICAN BAPTIST CHURCHES IN THE USA
0.2%
0.5%
1.7%
3.1%
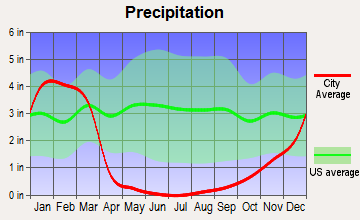
Weather
The North Coast has a milder climate with more precipitation, thanks to its coastal location. Temperatures are usually lower compared to southern California, offering a cooler, damp atmosphere. On the other hand, Pomona has a warmer climate with less rainfall. Summers can get quite hot; while winters are mild, making it a great choice for warm weather lovers.
Weather and climate
Type
North Coast
Pomona
Temperature - Average
64.4°F
63.5°F
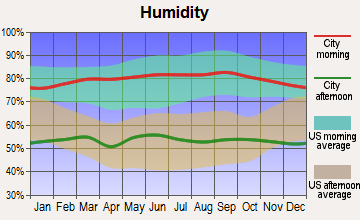
Humidity - Average morning or afternoon humidity
70.2%
65%
Humidity - Differences between morning and afternoon humidity
26.7%
19.9%
Humidity - Maximum monthly morning or afternoon humidity
78.7%
71.2%
Humidity - Minimum monthly morning or afternoon humidity
52%
51.2%
Precipitation - Yearly average
13 in
17 in
Snowfall - Yearly average
0 in
0 in
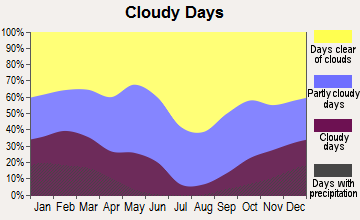
Clouds - Number of days clear of clouds
26.5%
27.8%
Sunshine amount - Average
78.4%
78.4%
Sunshine amount - Differences during a year
21.9%
21.9%
Sunshine amount - Maximum monthly
84.9%
84.9%
Sunshine amount - Minimum monthly
62.9%
63%
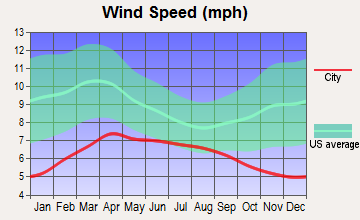
Wind speed - Average
6 mph
3.8 mph
Average climate in North Coast, California
Average climate in Pomona, California
Air pollution
Type
AQI
CO
NO2
OZONE
PB
PM10
PM25
SO2
Year
North Coast
Pomona
North Coast
Pomona
North Coast
Pomona
North Coast
Pomona
North Coast
Pomona
North Coast
Pomona
North Coast
Pomona
North Coast
Pomona
2018
119
142
0.35
0.43
14.4
19.4
26.1
24.2
N/A
0.007
27.5
32.7
12.6
14.2
0.7
0.4
2017
116
150
0.34
0.46
13.8
20.7
28.8
25.7
N/A
0.006
26.7
34.4
13.8
14.5
0.5
0.2
2016
102
137
0.33
0.31
12.2
20.3
29.3
24.4
N/A
0.007
24.1
30.2
12.5
14.4
0.2
0.3
2015
106
144
0.32
0.27
13.2
20.9
29.8
28.2
N/A
0.006
25.0
30.8
14.5
15.3
0.2
0.3
2014
110
145
0.29
0.30
12.9
22.1
28.6
28.3
N/A
0.007
26.7
33.8
15.5
14.8
0.4
0.3
2013
107
143
0.34
0.34
13.9
22.3
27.8
25.1
0.003
0.007
29.5
33.1
14.2
14.0
0.3
0.4
2012
103
147
0.30
0.38
12.7
21.4
26.8
23.5
0.004
0.006
28.2
32.8
14.3
16.8
0.1
0.5
2011
109
147
0.31
0.32
14.7
24.6
27.0
22.7
0.006
0.007
27.7
31.8
15.9
18.7
0.7
0.5
2010
102
141
0.33
0.51
14.3
26.0
26.2
23.5
0.011
0.008
23.6
28.3
14.0
16.7
0.6
1.1
2009
118
153
0.35
0.54
15.5
27.3
27.6
24.8
0.009
0.009
24.3
26.8
14.5
17.7
1.1
1.1
2008
124
159
0.39
0.59
16.5
30.1
28.2
25.0
0.010
0.009
29.5
29.4
21.6
16.0
1.1
1.3
2007
100
134
0.36
0.61
16.3
31.4
27.0
22.8
0.012
0.011
N/A
N/A
N/A
N/A
0.8
1.7
2006
114
125
0.40
0.70
17.2
30.7
26.4
21.7
0.007
0.007
N/A
N/A
N/A
N/A
1.3
1.7
2005
95
133
0.39
0.75
17.7
30.8
27.9
20.8
0.012
0.012
N/A
N/A
N/A
N/A
1.3
2.6
2004
119
141
0.50
0.85
19.2
31.3
30.5
20.3
0.014
0.013
N/A
N/A
N/A
N/A
1.6
1.8
2003
122
141
0.64
1.00
21.9
35.2
28.9
20.2
0.030
0.018
N/A
N/A
N/A
N/A
1.1
1.3
2002
106
137
0.65
1.04
22.0
36.5
25.5
18.5
0.018
0.018
N/A
N/A
N/A
N/A
1.8
0.8
2001
116
144
0.73
1.11
22.0
36.9
25.4
12.6
0.033
0.031
N/A
N/A
N/A
N/A
1.5
1.2
2000
125
152
0.80
1.18
24.4
43.9
24.0
14.6
0.027
0.034
N/A
N/A
N/A
N/A
1.9
1.7
Natural disasters
Type
North Coast
Pomona
Tornado activity compared to U.S. average
18.6%
18.4%
Earthquake activity compared to U.S. average
6,843.6%
7,323.7%
Natural disasters compared to U.S. average
32%
57%
Transportation
North Coast offers limited public transit, and most residents rely on cars for transportation. Pomona, with its extensive public transit system, offers more options for commuting, making it easier to travel to Los Angeles and other nearby cities.
Transport
Type
North Coast
Pomona
Amtrak stations
0
1
Amtrak stations nearby
3
3
FAA registered aircraft
0
33
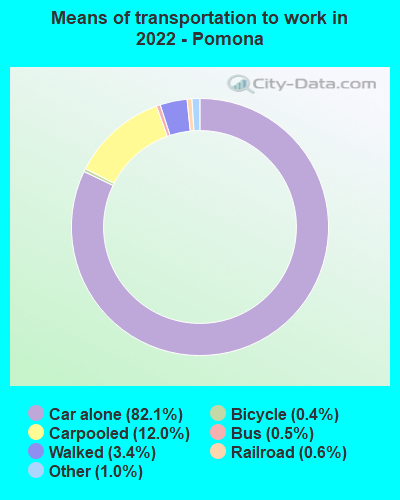
Means of transportation to work
Type
North Coast
Pomona
Bicycle
0.7%
0.2%
Bus
1.2%
1.5%
Carpooled
10.7%
11.5%
Car alone
81.4%
84.4%
Motorcycle
0.2%
0.1%
Railroad
0%
0.5%
Walked
1.4%
1.6%
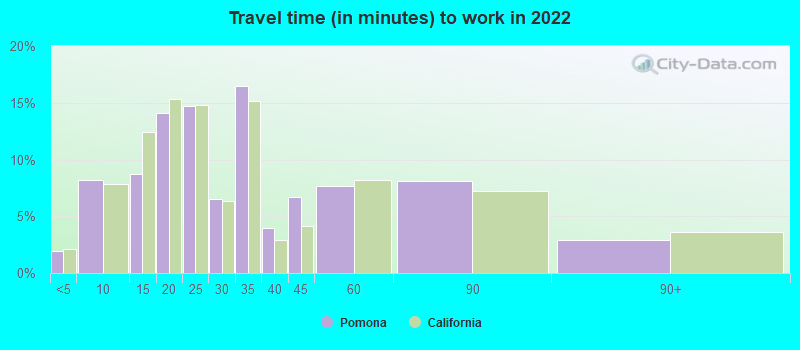
Average travel time to work
Type
North Coast
Pomona
Average
28.8 min
31.7 min
Real Estate
Real estate in North Coast is generally cheaper due to the lower demand and its distance from major urban centers. In contrast, Pomona, being part of the Greater Los Angeles area, has a more dynamic and pricier real estate market.
Neighborhoods
North Coast neighborhoods are more sparsely populated and offer a more relaxed, rural lifestyle. Pomona, on the other hand, offers a more urban environment. It has diverse neighborhoods, ranging from the bustling downtown area to quieter suburban communities.
Houses and residents
Type
North Coast
Pomona
Houses
137,450
41,376
Average household size (people)
2.7
3.8
Houses occupied
133,254 (96.9%)
40,142 (97%)
Houses occupied by owners
84,546 (63.4%)
20,591 (51.3%)
Houses occupied by renters
48,708 (36.6%)
19,551 (48.7%)
Median rent asked for vacant for-rent units
$2,340
$1,439
Median price asked for vacant for-sale houses and condos
$1,099,558
$501,466
Estimated median house or condo value
$883,291
$525,300
Median number of rooms in apartments
3.9
4
Median number of rooms in houses and condos
6.1
5.6
Renting percentage
37.7%
44.9%
Housing density (houses/condos per square mile)
2,312.7
1,811.5
Household income disparities
41.2%
43.8%
Housing units without a mortgage
13,396 (19.5%)
287 (2%)
Housing units with both a second mortgage and home equity loan
Self-employed workers in own not incorporated business
15,532
3,907
State government workers
5,751
2,100
Unpaid family workers
744
124
Industries and Occupations
Fishing, forestry, and tourism dominate the North Coast's industry landscape. The most common occupations are related to these industries. In Pomona, healthcare and education are the biggest industries, with occupations in healthcare support, education, and administration being particularly prevalent.
Both North Coast and Pomona have adequate healthcare facilities, though Pomona, being near to Los Angeles, has more advanced healthcare institutions. Residents of North Coast, though have access to rural health clinics and hospitals.
Health (county statistics)
Type
North Coast
Pomona
General health status score of residents in this county from 1 (poor) to 5 (excellent)
North Coast, being a rural area, has less advanced infrastructure compared to Pomona. Facilities such as high-speed internet, extensive road networks, and public facilities are more developed in Pomona, which benefits from its nearness to the Los Angeles metropolitan area.
Infrastructure
Type
North Coast
Pomona
TV stations
2
20
Culture and Food
North Coast offers a unique coastal culture influenced strongly by the natural environment. Seafood, especially locally caught fish, is prominent in the regional cuisine. Pomona, being more multicultural and urban, has a diverse food scene with cuisines from all over the world.
Sports Teams
While North Coast does not host any major professional sports teams, residents enjoy a plethora of outdoor activities including fishing, hiking, and surfing. Pomona, being close to Los Angeles, offers easy access to professional sports events of teams like the Lakers, Clippers, Dodgers, and LA Galaxy.
 North Coast, CA
 Pomona, CA