Newhall and Santa Clarita, both located in California, are desirable areas that present various distinct qualities. Offering individual flavors, they extend different costs of living, crime rates, infrastructures, and more. While Santa Clarita is a large, bustling city that provides an urban experience along with suburban comforts, Newhall, within Santa Clarita Valley, provides a quieter, quaint ambiance. Reading further will present a complete comparison for those looking to relocate or simply explore either of the aforementioned places.
While both have rates lower than the national average, Santa Clarita is slightly safer than Newhall in terms of crime. Santa Clarita's crime index is 30.6, beating the US average of 22.7 and Newhall's statistics. However, Newhall also has a moderate crime rate, making it relatively safe compared to other communities in California.
Cost of Living
Living costs in Santa Clarita are higher on average than in Newhall. Despite both locations being more expensive than the US average, prospective residents might find Newhall more cost-friendly, especially regarding housing costs.
Income Tax
Similarly, the State Income tax for both Santa Clarita and Newhall as part of California is the same following the state's progressive income tax system, with rates ranging from 1% to 13.3%, based on income level.
Property Tax
Property tax rates for both Santa Clarita and Newhall lie within California's standard, which averages at around 0.77%, one of the lowest rates in the United States.
Sales Tax
Both these places fall under Los Angeles County and therefore abide by the same sales tax rate of 9.5%. This uniformity is due to state and county-wide tax rates and regulations.
Income
Type
Newhall
Santa Clarita
Estimated median household income
$122,713
$109,336
Estimated per capita income
$50,120
$44,697
Cost of living index (U.S. average is 100)
150.6
134.5
If you make $50,000 in Santa Clarita, you will have to make $55,985 in Newhall to maintain the same standard of living.
Geographical Conditions
Both Santa Clarita and Newhall are set in the Santa Clarita Valley, known for its picturesque hills and canyons. Santa Clarita has a more urban landscape, whereas Newhall has managed to retain a rustic charm, epitomized by its historical downtown district.
Geographical information
Type
Newhall
Santa Clarita
Land area
496.7 sq. miles
47.8 sq. miles
Population density
388.5 people per sq. mile
4,696 people per sq. mile
Elevation
1,272 feet
1,200 feet
Relative area comparison
Newhall, CA Santa Clarita, CA
Education
Santa Clarita offers a rich selection of educational institutions, including top-rated schools and colleges such as College of the Canyons. Meanwhile, Newhall, while smaller, is home to several excellent schools like the Newhall School District, providing quality education for its residents.
Santa Clarita's economy is more diversified with sectors like entertainment, healthcare, and retail contributing significantly. The unemployment rate is slightly lower than in Newhall. However, while smaller, Newhall's economy is steadily rising with sectors such as education, health, and retail playing an instrumental role.
Biggest Employers
The Six Flags Magic Mountain theme park and Princess Cruises are among the largest employers in Santa Clarita. In Newhall, the Newhall School District is a significant employer, followed by several healthcare providers and retail establishments.
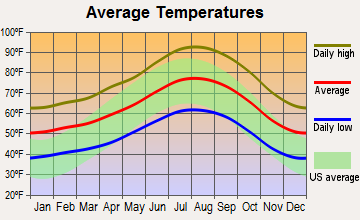
Weather
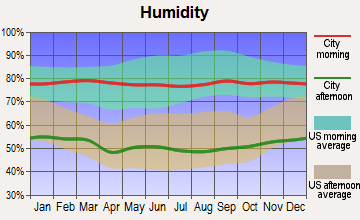
Weather in Santa Clarita and Newhall is similar due to their geographical proximity. Both offer Mediterranean climates with hot, dry summers and mild, wet winters. Santa Clarita's average high temperature in July is about 95 degrees, while Newhall records similar figures. Moreover, both boast of over 280 sunny days a year, higher than the US average.
Weather and climate
Type
Newhall
Santa Clarita
Temperature - Average
63°F
63.2°F
Humidity - Average morning or afternoon humidity
63.9%
63.6%
Humidity - Differences between morning and afternoon humidity
18.6%
18.3%
Humidity - Maximum monthly morning or afternoon humidity
69.3%
68.9%
Humidity - Minimum monthly morning or afternoon humidity
50.7%
50.5%
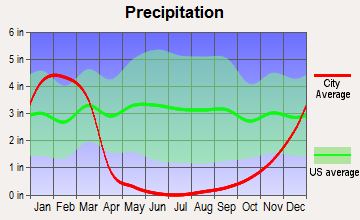
Precipitation - Yearly average
18.2 in
18.2 in
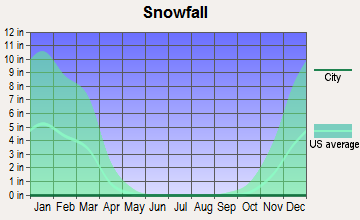
Snowfall - Yearly average
0 in
0 in
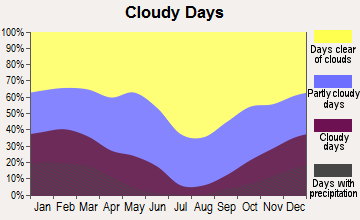
Clouds - Number of days clear of clouds
27.8%
27.8%
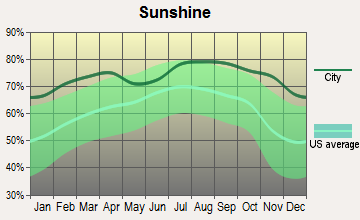
Sunshine amount - Average
78.4%
78.4%
Sunshine amount - Differences during a year
21.9%
21.9%
Sunshine amount - Maximum monthly
84.9%
84.9%
Sunshine amount - Minimum monthly
63%
63%
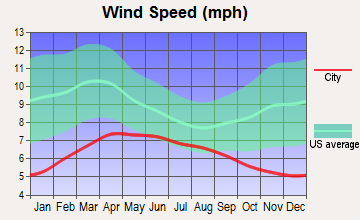
Wind speed - Average
3.1 mph
3 mph
Average climate in Newhall, California
Average climate in Santa Clarita, California
Air pollution
Type
AQI
CO
NO2
OZONE
PB
PM10
PM25
SO2
Year
Newhall
Santa Clarita
Newhall
Santa Clarita
Newhall
Santa Clarita
Newhall
Santa Clarita
Newhall
Santa Clarita
Newhall
Santa Clarita
Newhall
Santa Clarita
Newhall
Santa Clarita
2018
130
129
0.24
0.24
11.0
10.9
31.8
31.8
0.002
0.002
24.4
24.4
10.7
10.4
N/A
N/A
2017
129
129
0.27
0.26
10.7
10.5
33.7
33.6
0.002
0.002
25.0
25.0
10.6
10.3
N/A
N/A
2016
117
117
0.23
0.21
10.2
10.1
33.2
33.3
0.002
0.002
23.8
23.8
9.7
9.4
N/A
N/A
2015
123
123
0.21
0.19
11.9
11.8
33.7
33.8
0.001
0.001
21.8
21.8
9.1
8.7
N/A
N/A
2014
133
133
0.24
0.22
12.8
12.8
34.4
34.7
0.003
0.003
25.4
25.5
10.7
10.2
N/A
N/A
2013
134
134
0.24
0.22
14.5
14.4
34.6
35.1
0.004
0.004
24.8
24.8
10.0
9.8
0.3
0.3
2012
138
138
0.23
0.22
13.8
13.6
33.0
33.3
0.004
0.004
24.6
24.6
10.3
10.1
0.5
0.5
2011
135
135
0.25
0.23
13.9
13.6
31.7
32.0
0.006
0.006
24.3
24.3
13.0
12.5
0.5
0.5
2010
126
124
0.22
0.20
14.7
14.3
29.6
29.6
0.005
0.005
21.5
21.5
13.8
13.7
0.8
0.8
2009
147
147
0.26
0.25
15.5
15.1
30.8
31.2
0.006
0.006
N/A
N/A
14.6
14.5
0.5
0.5
2008
143
143
0.30
0.28
16.9
16.5
32.1
32.6
N/A
N/A
31.7
31.7
18.6
18.6
0.8
0.8
2007
117
114
0.35
0.33
19.9
19.7
29.5
29.8
0.008
0.008
N/A
N/A
N/A
N/A
1.0
1.0
2006
120
120
0.26
0.23
18.6
18.4
30.9
31.4
N/A
N/A
N/A
N/A
N/A
N/A
0.6
0.6
2005
127
127
0.35
0.32
19.5
19.2
29.5
29.8
N/A
N/A
N/A
N/A
N/A
N/A
1.6
1.6
2004
135
134
0.45
0.42
20.7
20.4
31.4
31.6
N/A
N/A
N/A
N/A
N/A
N/A
2.4
2.4
2003
142
142
0.50
0.48
21.6
21.2
31.9
32.2
N/A
N/A
N/A
N/A
N/A
N/A
1.3
1.3
2002
153
153
0.60
0.58
20.1
19.4
30.9
31.5
0.010
0.010
N/A
N/A
N/A
N/A
2.0
2.0
2001
133
130
0.73
0.72
23.0
22.4
26.8
27.3
0.011
0.011
N/A
N/A
N/A
N/A
0.7
0.7
2000
140
140
0.80
0.79
24.9
24.5
26.0
26.6
0.012
0.012
N/A
N/A
N/A
N/A
0.5
0.5
Natural disasters
Type
Newhall
Santa Clarita
Tornado activity compared to U.S. average
11.9%
12.3%
Earthquake activity compared to U.S. average
7,354.1%
7,347.5%
Natural disasters compared to U.S. average
57%
57%
Transportation
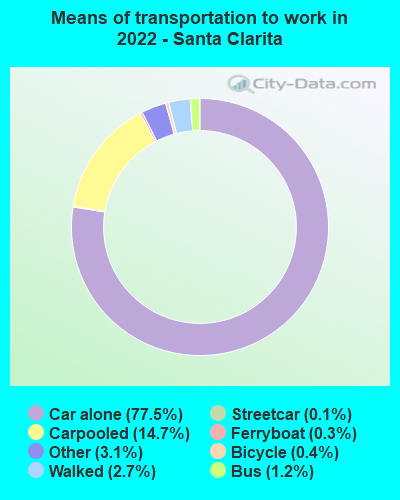
Public transportation in Santa Clarita is more robust due to the city's larger size. Santa Clarita Transit provides local, commuter, and dial-a-ride services. Newhall, being compact, can be easily navigated by car, bike, or on foot, although it also benefits from Santa Clarita Transit services.
Transport
Type
Newhall
Santa Clarita
Amtrak stations
0
1
Amtrak stations nearby
3
3
FAA registered aircraft
20
43
Means of transportation to work
Type
Newhall
Santa Clarita
Bicycle
0.4%
0.2%
Bus
1.9%
0.4%
Carpooled
13.7%
12.2%
Car alone
78.1%
82.9%
Motorcycle
0.2%
0.2%
Railroad
0.8%
0.9%
Walked
1.3%
1.9%
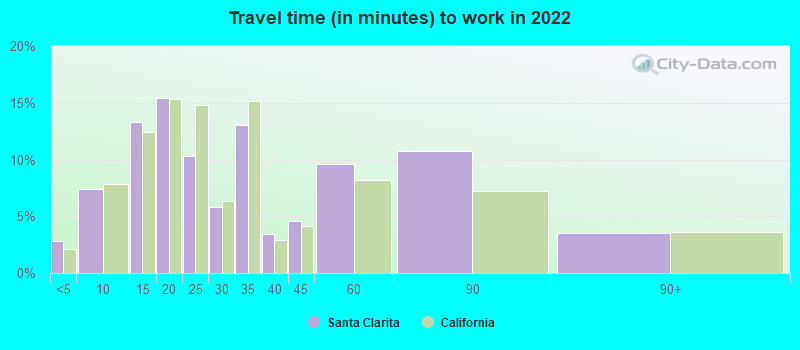
Average travel time to work
Type
Newhall
Santa Clarita
Average
34.2 min
28.9 min
Real Estate
Santa Clarita's real estate market is more expensive than Newhall's, yet the latter has seen a steady increase in its home values. Both areas are attractive for homeowners and investors, with Santa Clarita offering a more diverse real estate market in terms of property types.
Neighborhoods
Santa Clarita is made up of several distinct neighborhoods, each with a unique personality. Newhall, being a smaller community, provides a more uniform experience with its historical and charming downtown district being the focus.
Houses and residents
Type
Newhall
Santa Clarita
Houses
64,094
74,788
Average household size (people)
3
2.9
Houses occupied
61,472 (95.9%)
73,509 (98.3%)
Houses occupied by owners
45,056 (73.3%)
53,424 (72.7%)
Houses occupied by renters
16,416 (26.7%)
20,085 (27.3%)
Median rent asked for vacant for-rent units
$2,587
$3,305
Median price asked for vacant for-sale houses and condos
$1,138,428
$765,753
Estimated median house or condo value
$792,187
$656,000
Median number of rooms in apartments
3.7
4.2
Median number of rooms in houses and condos
7.1
6.2
Renting percentage
28.8%
28.9%
Housing density (houses/condos per square mile)
129
1,563.7
Household income disparities
34.9%
39.5%
Housing units without a mortgage
3,256 (8.5%)
398 (1%)
Housing units with both a second mortgage and home equity loan
166 (0.4%)
2,546 (6.2%)
Housing units with a mortgage
35,177 (91.5%)
40,480 (99%)
Housing units with a home equity loan
3,084 (8%)
298 (0.7%)
Housing units with a second mortgage
6,491 (16.9%)
3,012 (7.4%)
Housing units lacking complete kitchen facilities
0.5%
1.5%
Housing units lacking complete plumbing facilities
Self-employed workers in own not incorporated business
6,940
8,028
State government workers
2,785
3,883
Unpaid family workers
293
332
Industries and Occupations
In Santa Clarita, entertainment and healthcare are dominant industries. Conversely, in Newhall, the education sector plays a significant role along with health services and retail. Both have a good mix of white-collar and blue-collar jobs, with a slightly higher concentration of white-collar jobs in Santa Clarita.
Health Care
Santa Clarita houses several top-ranked hospitals and healthcare providers. Newhall, though smaller in scale, offers quality healthcare services, including the comprehensive Henry Mayo Newhall Hospital.
Santa Clarita boasts a robust infrastructure, including well-maintained roads and public facilities, exemplified by the Santa Clarita Transit system. On the other hand, Newhall, being a smaller community, has a simplistic infrastructure, but it is efficiently planned and well-maintained.
Infrastructure
Type
Newhall
Santa Clarita
TV stations
6
10
Bank branches located here
4
16
Bank institutions located here
4
9
Schools
School facilities
Type
Newhall
Santa Clarita
Private elementary/middle schools
1
1
Private high schools
0
2
Public elementary/middle schools
6
6
Public high schools
1
8
Colleges/Universities
0
2
Culture and Food
The culture and food scene in Santa Clarita reflect its diverse population featuring a wide range of culinary offerings from around the globe. Newhall, too, although smaller, boasts of a vibrant food scene with a notable concentration of Mexican food outlets, reflecting its rich Hispanic influence.
Sports Teams
Despite being smaller cities, both share the enthusiasm for sports, mainly through youth and school teams. Professional sports teams of nearby Los Angeles, like the Lakers (NBA), Dodgers (MLB), and Rams (NFL), garner significant support.
 Newhall, CA
 Santa Clarita, CA