Newark and Elizabeth are two of the largest cities in New Jersey, each with its unique attributes and challenges. Both cities are located in the heart of the state, with Newark being the largest city and Elizabeth the fourth largest. Comparing these two cities will hopefully provide a comprehensive picture of what it's like to live, work, or visit Newark and Elizabeth, including aspects such as crime rates, weather, cost of living, and cultural opportunities.
Distance between
Newark, NJ and
Elizabeth, NJ : 5.2 miles
Newark's population is larger by 127%. Its population has grown by 33,674 people (12.3%) since 2000. The population of Elizabeth has grown by 14,839 people (12.3%) during that time.
Newark has a higher crime rate compared to Elizabeth. However, it is essential to note that crime is heavily concentrated in certain neighborhoods, meaning some areas are safer than others in both cities. For visitors, both cities are generally safe during the day, especially in busier downtown areas. Police presence and community initiatives have also contributed to decreasing trends in crime rates in both cities.
City-data.com crime index counts serious crimes and violent crime more heavily. It adjusts for the number of visitors and daily workers commuting into cities. (higher means more crime, U.S. average = 301.1)
City-data.com crime index counts serious crimes and violent crime more heavily. It adjusts for the number of visitors and daily workers commuting into cities. (higher means more crime, U.S. average = 301.1)
Sex Offenders
According to our data, there are 598 registered sex offenders living in Newark and 119 registered sex offenders living in . The ratio of residents to sex offenders in Newark is 471 to 1; the ratio in Elizabeth is 1,081 to 1. The number of registered sex offenders compared to the number of residents is larger in Newark than in Elizabeth.
Cost of Living
The cost of living in Newark is generally higher than in Elizabeth. This difference is primarily due to Newark's status as a major city and business hub, which drives up housing costs. However, both cities are substantially cheaper than nearby New York City, providing an affordable alternative for those working in the metropolis.
Income Tax
Both cities fall under New Jersey's state income tax, which varies from 1.4% to 10.75% depending on income level. There are no additional city income taxes in Newark or Elizabeth.
Property Tax
New Jersey has one of the highest property tax rates in the U.S., with Newark and Elizabeth residents both paying an average rate of around 2.2%.
Sales Tax
Both Newark and Elizabeth are subject to New Jersey's 6.625% state sales tax. Neither city imposes additional local sales tax.
Income
Type
Newark
Elizabeth
Estimated median household income
$43,242
$51,549
Estimated per capita income
$23,767
$24,973
Cost of living index (U.S. average is 100)
118.1
119.1
If you make $50,000 in Newark, you will have to make $50,423 in Elizabeth to maintain the same standard of living.
Geographical Conditions
Both cities sit within the urban sprawl of the Northeast Megalopolis, with Newark being closer to New York City. They both also have access to waterfronts – Newark with the Passaic River and Elizabeth with the Arthur Kill strait.
Both cities have varied educational opportunities, with numerous public and private schools and universities. However, Newark has a larger number of schools and educational institutions, including the prestigious Rutgers University-Newark. Elizabeth is known for its Union County College and the Trinitas School of Nursing.
Newark boasts a more robust economy, with a larger variety of industries including services, healthcare, and education. Elizabeth, while its economy is smaller, has a significant presence in shipping and logistics, thanks to its massive deep-water port.
Biggest Employers
The biggest employers in Newark include Prudential Financial, Rutgers University, and the City of Newark. In Elizabeth, top employers include Trinitas Regional Medical Center, Wakefern Food Corporation, and the City of Elizabeth.
There were 1 building permits issued in Newark in 2012, compared to 4 building permits issued in Elizabeth in 2012 (2 more than in 2011).
In Newark (Essex County), 78.3% voted for Democrats and 21.4% for Republicans in 2012 Presidential Election. In Elizabeth (Union County), 66.9% voted for Democrats and 32.7% for Republicans.
Elections
Type
Democrats
Republicans
Other
Year
Newark
Elizabeth
Newark
Elizabeth
Newark
Elizabeth
2020
77.4%
67.2%
21.9%
31.6%
0.7%
1.3%
2016
77.2%
66.2%
20.2%
30.6%
2.6%
3.1%
2012
78.3%
66.9%
21.4%
32.7%
0.3%
0.5%
2008
76.2%
63.9%
23.5%
35.6%
0.3%
0.5%
2004
70.7%
58.8%
28.9%
40.7%
0.4%
0.5%
2000
71.9%
60.4%
25.9%
37.0%
2.2%
2.7%
1996
69.0%
56.8%
25.6%
34.6%
5.4%
8.5%
Breakdown of population affiliated with a religious congregation
Type
Adherents
Congregations
Religion
Newark
Elizabeth
Newark
Elizabeth
CATHOLIC CHURCH
33.4%
46.1%
10.7%
11.0%
MUSLIM ESTIMATE
3.0%
2.0%
2.8%
2.1%
AMERICAN BAPTIST CHURCHES IN THE USA
2.1%
2.1%
8.2%
7.1%
EPISCOPAL CHURCH
0.9%
1.3%
3.6%
3.7%
SEVENTH DAY ADVENTIST CHURCH
0.8%
0.4%
2.8%
3.1%
EVANGELICAL LUTHERAN CHURCH IN AMERICA
0.1%
0.6%
1.0%
2.6%
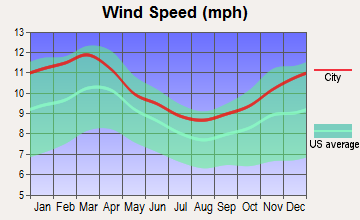
Weather
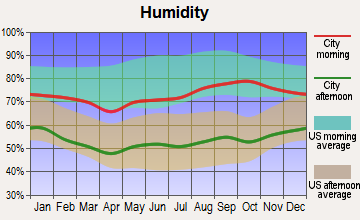
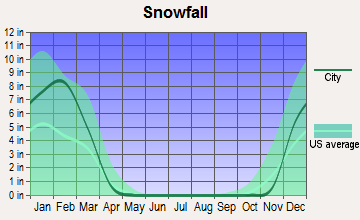
The weather in both Newark and Elizabeth is virtually identical, given their close proximity in New Jersey. They both enjoy a humid subtropical climate, with hot, humid summers and cold winters. Snowfall is common in winter, while fall tends to be the most pleasant season.
Weather and climate
Type
Newark
Elizabeth
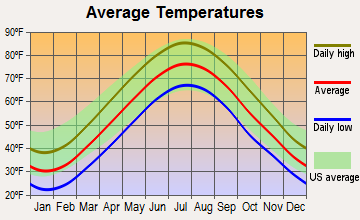
Temperature - Average
54°F
53.6°F
Humidity - Average morning or afternoon humidity
67.3%
67.3%
Humidity - Differences between morning and afternoon humidity
30%
30%
Humidity - Maximum monthly morning or afternoon humidity
77%
77%
Humidity - Minimum monthly morning or afternoon humidity
47%
47%
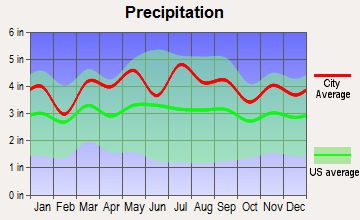
Precipitation - Yearly average
47 in
47.9 in
Snowfall - Yearly average
60.3 in
60.4 in
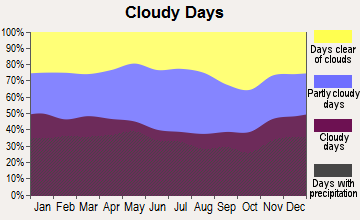
Clouds - Number of days clear of clouds
15.7%
15.7%
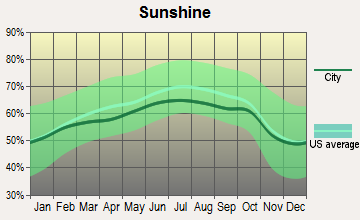
Sunshine amount - Average
60.2%
60.2%
Sunshine amount - Differences during a year
20%
20%
Sunshine amount - Maximum monthly
64%
64%
Sunshine amount - Minimum monthly
44%
44%
Wind speed - Average
10.6 mph
10.6 mph
Average climate in Newark, New Jersey
Average climate in Elizabeth, New Jersey
Air pollution
Type
AQI
CO
NO2
OZONE
PB
PM10
PM25
SO2
Year
Newark
Elizabeth
Newark
Elizabeth
Newark
Elizabeth
Newark
Elizabeth
Newark
Elizabeth
Newark
Elizabeth
Newark
Elizabeth
Newark
Elizabeth
2018
95
94
0.30
0.38
14.4
19.5
23.4
23.9
N/A
N/A
N/A
N/A
8.7
10.5
0.2
0.4
2017
99
98
0.30
0.35
15.1
19.4
22.7
23.6
N/A
N/A
N/A
N/A
8.7
10.4
0.2
0.2
2016
95
94
0.31
0.42
15.5
20.3
23.6
24.3
N/A
N/A
N/A
N/A
8.8
10.1
0.3
0.2
2015
100
100
0.33
0.40
16.7
22.2
23.2
24.4
N/A
N/A
N/A
N/A
8.7
8.9
0.5
0.5
2014
95
95
0.33
0.37
18.8
22.0
23.5
23.8
N/A
N/A
N/A
N/A
8.2
8.6
0.8
0.6
2013
97
96
0.35
0.38
18.3
22.2
23.5
24.4
N/A
N/A
N/A
N/A
9.1
8.9
0.8
0.8
2012
99
98
0.33
0.42
18.5
22.1
23.5
23.9
N/A
N/A
N/A
N/A
9.2
9.3
1.1
1.0
2011
108
108
0.36
0.45
21.2
24.6
22.7
23.2
N/A
N/A
N/A
N/A
8.5
10.0
2.0
1.6
2010
114
114
0.33
0.43
19.4
22.2
26.3
25.7
N/A
N/A
N/A
N/A
8.2
9.3
1.9
1.2
2009
104
104
0.38
0.41
21.6
26.4
19.6
21.2
N/A
N/A
N/A
N/A
9.8
9.6
2.3
1.9
2008
111
111
0.46
0.38
22.4
26.1
21.8
22.3
0.013
0.013
N/A
N/A
12.4
11.6
3.4
2.9
2007
123
123
0.51
0.41
23.5
27.5
22.3
22.8
0.016
0.016
N/A
N/A
12.7
12.1
4.3
4.1
2006
116
116
0.64
0.57
24.6
29.8
21.5
22.0
0.018
0.018
N/A
N/A
12.9
13.3
5.3
4.7
2005
113
112
0.78
0.71
26.1
31.9
20.5
20.8
N/A
N/A
N/A
N/A
N/A
N/A
7.2
6.5
2004
108
107
0.79
0.71
25.4
30.4
19.5
19.9
0.030
0.030
N/A
N/A
N/A
N/A
6.8
6.5
2003
108
108
0.76
0.80
26.1
32.0
18.1
19.0
0.013
0.009
26.9
26.9
N/A
N/A
6.0
7.0
2002
124
124
0.65
0.79
28.5
39.6
18.3
20.8
0.008
0.008
26.1
26.1
N/A
N/A
3.8
6.9
2001
125
124
0.79
0.87
30.1
40.2
21.2
22.1
0.020
0.020
26.7
26.8
N/A
N/A
6.2
7.0
2000
116
116
1.02
0.99
31.2
40.6
20.0
20.4
0.022
0.022
22.2
22.2
N/A
N/A
6.7
7.0
Natural disasters
Type
Newark
Elizabeth
Tornado activity compared to U.S. average
64.1%
64.4%
Earthquake activity compared to U.S. average
31.6%
31.5%
Natural disasters compared to U.S. average
30%
27%
Transportation
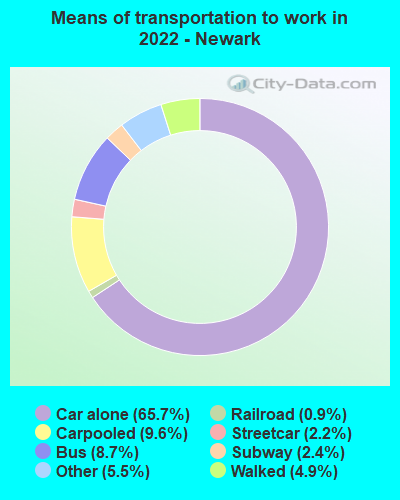
Both cities are highly accessible, with extensive public transportation options. Newark has more transportation methods, including Newark Liberty International Airport, multiple train stations, and the PATH system for easy New York City access. Elizabeth also offers good public transport but lacks an airport within city limits.
Transport
Type
Newark
Elizabeth
Amtrak stations
2
0
Amtrak stations nearby
3
3
FAA registered aircraft
20
8
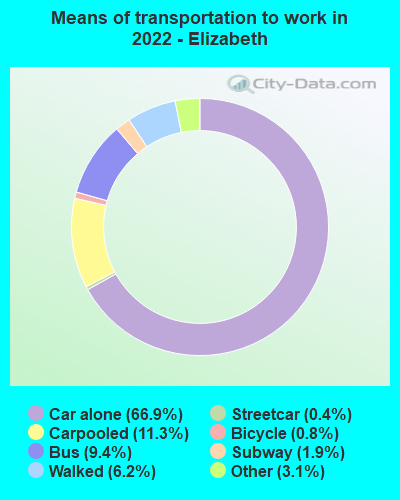
Means of transportation to work
Type
Newark
Elizabeth
Bicycle
0.2%
0.2%
Bus
6.8%
5.7%
Carpooled
9.2%
12.5%
Car alone
69.3%
71.5%
Railroad
0.2%
3.2%
Streetcar
0.9%
0.1%
Subway
1.2%
0.8%
Taxicab
0.7%
0.4%
Walked
3.5%
4.3%
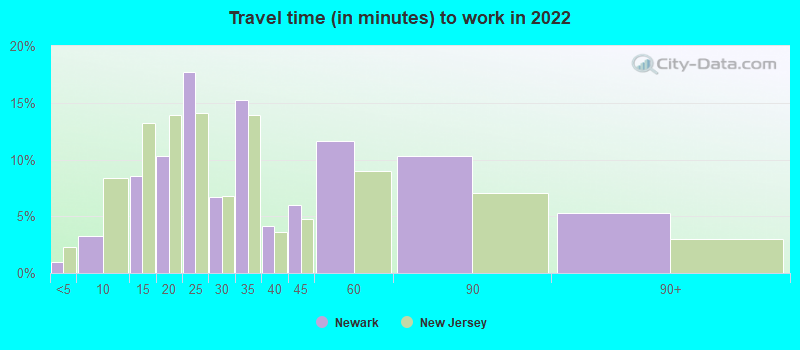
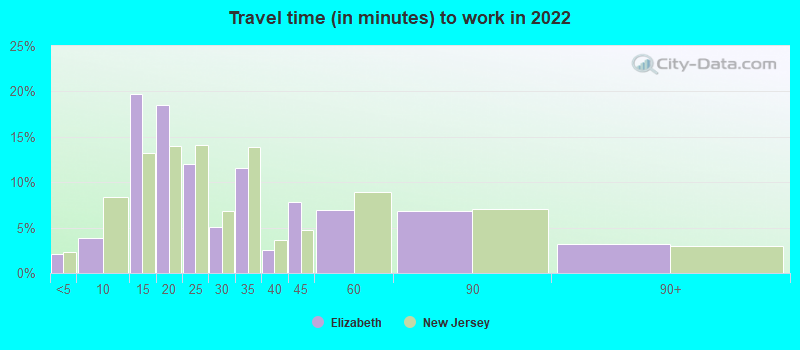
Average travel time to work
Type
Newark
Elizabeth
Average
33.2 min
31.3 min
Other means
28 min
26.7 min
Public transportation
45.1 min
42.6 min
Private vehicle occupancy
Type
Newark
Elizabeth
Average
1.2
1.6
Drove alone
81.7%
77.3%
In 2 person carpool
14.8%
10.4%
In 3 person carpool
2.4%
2.3%
In 4 person carpool
0.6%
3.4%
In 5-6 person carpool
0.1%
6.4%
In 7+ person carpool
0.4%
0.2%
How many people usually rode to work in the car, truck or van.
Real Estate
Real-estate prices in Newark are generally higher than in Elizabeth. However, this difference is less noticeable in terms of rent, and both cities offer less expensive alternatives to New York City.
Neighborhoods
Newark's more popular neighborhoods include Ironbound, University Heights, and Downtown. Elizabeth's appealing neighborhoods are Elmora, Peterstown, and Westminster. Each city offers a range of neighborhood types, from bustling urban areas to quieter, residential zones.
Houses and residents
Type
Newark
Elizabeth
Houses
122,145
49,554
Average household size (people)
2.8
2.9
Median year apartment built
1967
1958
Median year house/condo built
1960
1950
Length of stay in the house since moving in
17.1 years
12.4 years
Houses occupied
115,145 (94.3%)
46,107 (93%)
Houses occupied by owners
24,002 (20.8%)
11,319 (24.5%)
Houses occupied by renters
91,143 (79.2%)
34,788 (75.5%)
Median rent asked for vacant for-rent units
$408.22
$1,835
Median monthly housing costs
$1,277
$1,348
Median price asked for vacant for-sale houses and condos
$153,754
$194,520
Estimated median house or condo value
$323,200
$405,800
Median numbers of rooms
4.5
4.2
Median number of rooms in apartments
4.2
4
Median number of rooms in houses and condos
5.7
5.9
Median house price - detached houses
$321,688
$375,446
Median house price - in 2-unit structures
$347,644
$406,479
Median house price - in 3-to-4-unit structures
$337,992
$555,438
Median house price - in 5 or more unit structures
$210,604
$68,365
Median house price - Townhouses or other attached units
$224,107
$315,255
Median house price - All housing units
$325,388
$385,852
Median house age
55
67
Renting percentage
77.9%
73.3%
Housing density (houses/condos per square mile)
5,132.8
4,054.7
House value disparities
31.5%
23.5%
Household income disparities
47.8%
46.9%
Median household income for houses/condes with a mortgage
$71,676
$95,614
Median household income for apartments without a mortgage
$62,906
$75,520
Housing units without a mortgage
459 (2.7%)
366 (5.2%)
Housing units with both a second mortgage and home equity loan
647 (3.8%)
176 (2.5%)
Housing units with a mortgage
16,603 (97.3%)
6,656 (94.8%)
Housing units with a home equity loan
0 (0%)
43 (0.6%)
Housing units with a second mortgage
769 (4.5%)
257 (3.7%)
House/condo owner moved in on average (years ago)
18
10
House/condo renter moved in on average (years ago)
5
4
Housing units lacking complete kitchen facilities
2.3%
3.6%
Housing units lacking complete plumbing facilities
1%
0.6%
Housing units in structures
Housing units in structures
Newark
Elizabeth
One, detached
10.7%
11.8%
One, attached
11.4%
6.3%
Two
19.5%
31.4%
3 or 4
21.1%
15.5%
5 to 9
8.2%
7.6%
10 to 19
6.0%
7.9%
20 to 49
6.5%
11.5%
50 or more
15.8%
8.0%
Mobile homes
0.9%
0.0%
Boats, RVs, vans, etc.
0.1%
0.0%
Median real estate property taxes paid for housing units
Self-employed workers in own not incorporated business
7,752
2,299
State government workers
5,591
1,237
Unpaid family workers
121
0
Industries and Occupations
In Newark, the healthcare, education, and service sectors dominate employment. Conversely, in Elizabeth, the major employers are primarily within the shipping, logistics, and retail industries.
Healthcare in both cities is well-equipped and readily available, with several hospitals and clinics. Newark, having a larger area and population, is home to more healthcare facilities like the University Hospital.
Health (county statistics)
Type
Newark
Elizabeth
General health status score of residents in this county from 1 (poor) to 5 (excellent)
Newark surpasses Elizabeth when it comes to infrastructure primarily due to its larger size and the presence of significant facilities like Newark Liberty International Airport. Elizabeth, while smaller, has an efficient road network and is home to the largest containerized freight facility on the East Coast.
Infrastructure
Type
Newark
Elizabeth
Hospitals
8
3
TV stations
31
31
Bank branches located here
69
31
Bank institutions located here
19
12
Drinking water stations with no reported violations in the past
0
1
Drinking water stations with reported violations in the past
HMDA - Conventional home purchase loans - Applications denied
Year
Newark
Elizabeth
1999
429
124
2000
515
200
2001
536
141
2002
547
156
2003
740
261
2004
1,167
438
2005
2,198
955
2006
3,193
1,156
2007
2,300
823
2008
508
251
2009
182
104
Culture and Food
Newark and Elizabeth both boast diverse cultures, influenced heavily by their large immigrant populations. Newark, with its significant Portuguese community, is particularly famous for its Ironbound district's food scene, while Elizabeth's cuisine reflects its diverse inhabitants, from Latin American to Italian and Polish.
Sports Teams
Newark hosts the New Jersey Devils NHL team and serves as the training center for the NBA's Brooklyn Nets. Elizabeth does not host any major league teams but has a thriving local sports culture.


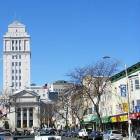


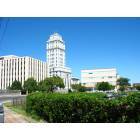
 Newark, NJ
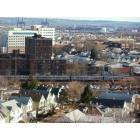
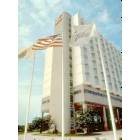
 Elizabeth, NJ