Living in New York, NY (commonly referenced as Manhattan), and Brooklyn, NY provides unique, albeit distinctive, experiences. Both boroughs are part of the larger New York City metropolitan area, offering vibrant cultural scenes, diverse populations, and challenges common in urban living such as high living costs and bustling environments. Differences exist in aspects like the cost of living, housing opportunities, and overall lifestyle. This comprehensive comparison will delve into their disparities and similarities, which affects both residents and visitors alike.
Both Manhattan and Brooklyn have parts that are very safe and parts that are less so. It mostly depends on the neighborhood. While Manhattan may generally be considered safer, some neighborhoods in Brooklyn, such as Park Slope and Brooklyn Heights, have low crime rates. It's essential for residents and tourists to stay alert and aware of their surroundings in any urban environment. Crime rates can vary greatly within each borough.
Cost of Living
The cost of living in Manhattan is significantly higher than in Brooklyn. Everything from housing to groceries is typically more expensive in Manhattan, arguably due to its world-renowned status and concentration of high-income individuals. However, Brooklyn is not cheap either, with its cost of living still considerably higher compared to the national average.
Income Tax
City and State income tax rates in Manhattan and Brooklyn are the same because they are both part of New York City. The city income tax rates range from 3.078% to 3.876% and the state rates range from 4% to 8.82%.
Property Tax
Although subject to fluctuation, Brooklyn homeowners generally pay less in property taxes compared to Manhattan due to less expensive property valuations on average.
Sales Tax
Both Manhattan and Brooklyn come under New York City’s jurisdiction and have the same sales tax rate of 8.875%.
Income
Type
New York
Brooklyn
Estimated median household income
$67,997
$67,567
Estimated per capita income
$42,406
$39,536
Cost of living index (U.S. average is 100)
160.2
185.4
If you make $50,000 in New York, you will have to make $57,865 in Brooklyn to maintain the same standard of living.
Geographical Conditions
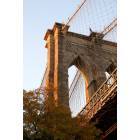
Geographically, both Manhattan and Brooklyn are part of the New York City archipelago. Manhattan is an island bounded by three rivers, while Brooklyn is on the western tip of Long Island, linked to Manhattan by bridges and tunnels.
Geographical information
Type
New York
Brooklyn
Land area
303.3 sq. miles
70.6 sq. miles
Population density
27,917 people per sq. mile
35,956 people per sq. mile
Relative area comparison
New York, NY Brooklyn, NY
Education
Manhattan houses some of the highest-ranking public schools in New York State, as well as prestigious universities like Columbia University and New York University. Similarly, Brooklyn boasts strong public, magnet, and charter schools, and is home to educational institutions like the Pratt Institute and Brooklyn College. Educational quality and opportunities are abundant in both boroughs.
Manhattan is an economic powerhouse, with a strong job market focused on finance, media, arts, and technology sectors. Brooklyn's economy is also robust, trending towards entrepreneurship, technology, arts, and small businesses. There are ample job opportunities in both, but Manhattan is known for higher salaries and more corporate jobs.
Biggest Employers
Manhattan's biggest employers are JP Morgan Chase, Citigroup, and New York-Presbyterian Hospital. In Brooklyn, the top employers include JP Morgan Chase, the City of New York, and the State of New York.
In New York (New York County), 83.9% voted for Democrats and 14.9% for Republicans in 2012 Presidential Election. In Brooklyn (Kings County), 82.1% voted for Democrats and 16.9% for Republicans.
Elections
Type
Democrats
Republicans
Other
Year
New York
Brooklyn
New York
Brooklyn
New York
Brooklyn
2020
86.5%
76.9%
12.2%
22.2%
1.2%
1.0%
2016
86.7%
79.6%
9.7%
17.5%
3.6%
2.9%
2012
83.9%
82.1%
14.9%
16.9%
1.2%
0.9%
2008
86.1%
79.9%
13.5%
20.1%
0.3%
0.0%
2004
82.3%
75.0%
16.8%
24.3%
0.9%
0.7%
2000
80.0%
81.0%
14.5%
15.7%
5.5%
3.3%
1996
80.0%
80.1%
13.8%
15.1%
6.3%
4.9%
Breakdown of population affiliated with a religious congregation
Type
Adherents
Congregations
Religion
New York
Brooklyn
New York
Brooklyn
CATHOLIC CHURCH
20.4%
24.9%
12.6%
7.5%
MUSLIM ESTIMATE
2.7%
3.8%
2.4%
4.2%
EPISCOPAL CHURCH
1.7%
0.7%
5.3%
2.3%
AMERICAN BAPTIST CHURCHES IN THE USA
1.6%
1.9%
4.7%
3.8%
REFORMED CHURCH IN AMERICA
0.6%
0.1%
1.2%
0.9%
PATRIAR PARISHE RUSSIAN ORTHODO CHURCH USA
0.4%
0.0%
0.2%
0.0%
SEVENTH DAY ADVENTIST CHURCH
0.3%
1.0%
2.4%
5.2%
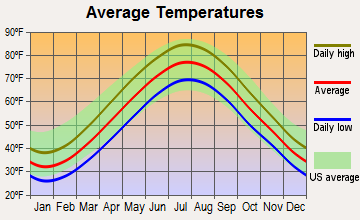
Weather
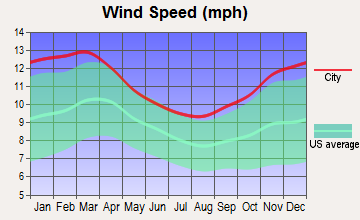
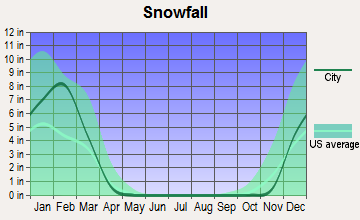
Weather conditions in Manhattan and Brooklyn are virtually identical, given their geographic proximity. Both experience a humid subtropical climate with all four seasons. Summers can be hot and humid, winters can be cold and snowy, and fall and spring are typically mild and pleasant. The East River slightly influences microclimate differences but these are largely indistinguishable.
Weather and climate
Type
New York
Brooklyn
Temperature - Average
54.9°F
55.1°F
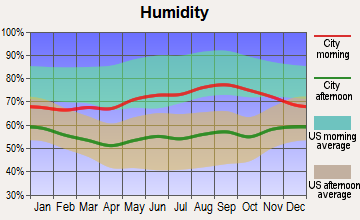
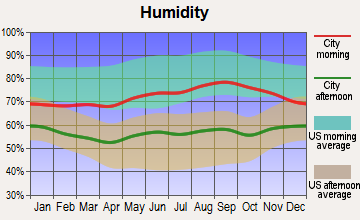
Humidity - Average morning or afternoon humidity
67.6%
68.7%
Humidity - Differences between morning and afternoon humidity
26.5%
26.1%
Humidity - Maximum monthly morning or afternoon humidity
75.9%
76.8%
Humidity - Minimum monthly morning or afternoon humidity
49.4%
50.7%
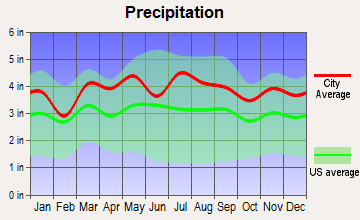
Precipitation - Yearly average
46.6 in
46.5 in
Snowfall - Yearly average
54.4 in
53.4 in
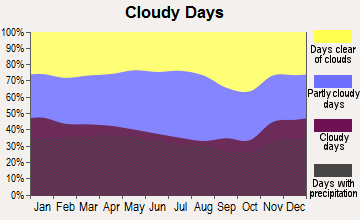
Clouds - Number of days clear of clouds
16.6%
16.7%
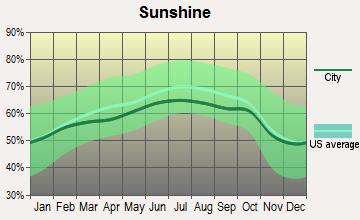
Sunshine amount - Average
60.2%
60.2%
Sunshine amount - Differences during a year
20%
20%
Sunshine amount - Maximum monthly
64%
64%
Sunshine amount - Minimum monthly
44%
44%
Wind speed - Average
10.4 mph
10.6 mph
Average climate in New York, New York
Average climate in Brooklyn, New York
Air pollution
Type
AQI
CO
NO2
OZONE
PB
PM10
PM25
SO2
Year
New York
Brooklyn
New York
Brooklyn
New York
Brooklyn
New York
Brooklyn
New York
Brooklyn
New York
Brooklyn
New York
Brooklyn
New York
Brooklyn
2018
93
93
0.28
0.31
15.7
16.8
24.2
24.2
N/A
N/A
N/A
N/A
7.1
7.0
0.5
0.4
2017
95
95
0.08
0.25
15.8
17.0
25.0
24.5
N/A
N/A
N/A
N/A
7.0
7.1
0.6
0.3
2016
93
93
0.27
0.31
16.6
17.7
25.3
24.8
N/A
N/A
N/A
N/A
7.1
7.2
0.7
0.5
2015
100
100
0.29
0.38
18.2
18.2
24.0
24.1
N/A
N/A
N/A
N/A
8.3
8.0
1.3
0.7
2014
95
95
0.32
0.38
18.0
18.5
23.5
23.5
N/A
N/A
N/A
N/A
8.2
7.8
1.5
0.9
2013
96
96
0.34
0.41
18.8
18.9
24.2
24.4
N/A
N/A
N/A
N/A
8.9
8.5
1.6
1.0
2012
98
98
0.37
0.44
18.4
18.3
24.8
24.4
N/A
N/A
N/A
N/A
9.2
9.2
2.5
1.6
2011
107
107
0.40
0.43
20.5
20.7
24.0
23.6
N/A
N/A
N/A
N/A
10.8
10.3
3.7
2.4
2010
112
112
0.45
0.43
20.2
19.4
24.6
24.7
N/A
N/A
N/A
N/A
10.2
10.0
4.1
2.3
2009
104
104
0.47
0.43
22.4
21.5
20.5
20.7
N/A
N/A
N/A
N/A
10.3
10.2
5.0
3.1
2008
109
109
0.48
0.47
23.5
22.6
20.9
21.3
0.013
0.013
N/A
N/A
11.7
11.8
5.4
4.1
2007
121
121
0.54
0.53
24.3
23.5
19.9
20.8
0.016
0.016
N/A
N/A
12.6
12.4
6.3
4.8
2006
116
116
0.47
0.61
24.9
24.2
19.9
20.7
0.018
0.018
N/A
N/A
12.9
13.0
6.9
5.7
2005
107
107
0.56
0.74
26.9
26.1
18.9
19.6
N/A
N/A
N/A
N/A
N/A
N/A
8.7
7.5
2004
106
106
0.58
0.74
26.7
25.8
17.7
18.5
0.030
0.030
N/A
N/A
N/A
N/A
8.2
7.1
2003
107
107
0.69
0.81
28.2
27.4
18.0
18.4
0.015
0.021
27.0
26.9
N/A
N/A
8.8
7.4
2002
122
122
0.62
0.76
28.3
27.9
19.1
19.9
0.008
0.008
25.8
26.2
N/A
N/A
8.3
6.5
2001
121
121
0.61
0.80
29.2
29.5
20.3
22.3
0.020
0.020
23.1
27.3
N/A
N/A
9.2
7.8
2000
115
115
0.63
0.92
29.0
29.8
18.2
20.3
0.022
0.022
22.2
22.2
N/A
N/A
8.8
7.4
Natural disasters
Type
New York
Brooklyn
Tornado activity compared to U.S. average
56.5%
56.4%
Earthquake activity compared to U.S. average
30.8%
30.8%
Natural disasters compared to U.S. average
18%
17%
Transportation
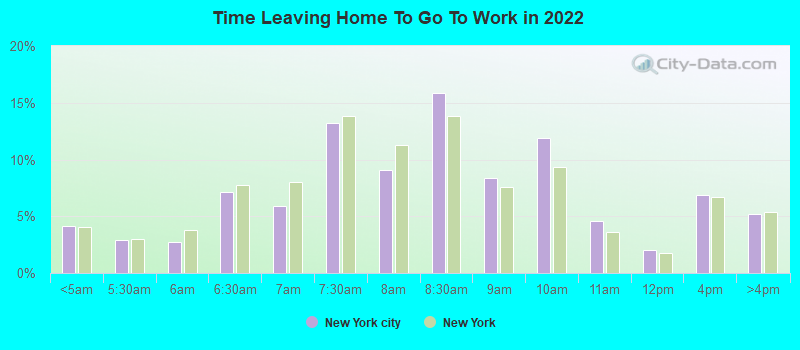
Public transportation in Manhattan and Brooklyn is comprehensive and robust. Manhattan, being compact, also offers more walkability. Brooklyn residents often spend more time commuting, but the borough boasts excellent bike lanes and more opportunities for driving.
Transport
Type
New York
Brooklyn
Amtrak stations
1
0
Amtrak stations nearby
3
3
FAA registered aircraft
753
149
FAA registered aircraft manufacturers and dealers
8
2
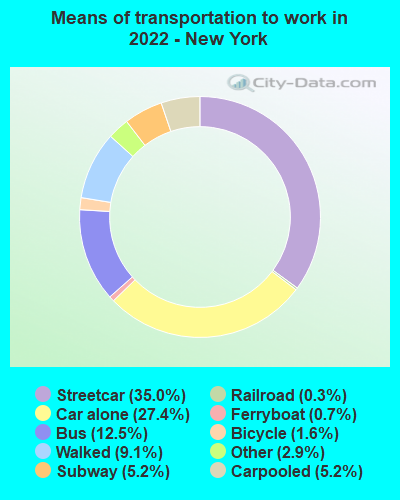
Means of transportation to work
Type
New York
Brooklyn
Bicycle
1.7%
0.5%
Bus
12.3%
10.4%
Carpooled
5.6%
8%
Car alone
30.5%
22.4%
Ferryboat
0.4%
0%
Railroad
0.3%
1.4%
Streetcar
32%
0.2%
Subway
4%
44.8%
Taxicab
1.7%
0.7%
Walked
10.1%
8.8%
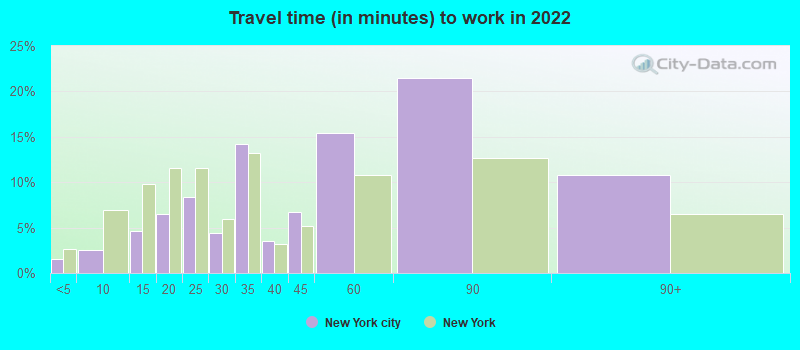
Average travel time to work
Type
New York
Brooklyn
Average
46.2 min
44.5 min
Real Estate
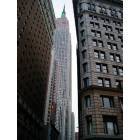
Manhattan is known for its pricey real estate market with towering condos and apartment buildings. Brooklyn, while still expensive, offers more variety in housing options, with traditional brownstones and newly constructed condos.
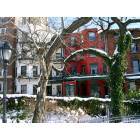
Neighborhoods
Manhattan neighborhoods, such as the Upper East Side and Tribeca, have a more polished feel, while Brooklyn neighborhoods like Williamsburg and Dumbo offer an eclectic, creative vibe.
Houses and residents
Type
New York
Brooklyn
Houses
3,641,931
930,866
Average household size (people)
2.6
2.7
Houses occupied
3,263,895 (89.6%)
880,727 (94.6%)
Houses occupied by owners
1,085,936 (33.3%)
238,290 (27.1%)
Houses occupied by renters
2,177,959 (66.7%)
642,437 (72.9%)
Median rent asked for vacant for-rent units
$2,362
$1,589
Median price asked for vacant for-sale houses and condos
$1,459,403
$1,621,117
Estimated median house or condo value
$685,700
$793,300
Median number of rooms in apartments
3.6
3.6
Median number of rooms in houses and condos
5.2
5.2
Renting percentage
69%
72.3%
Housing density (houses/condos per square mile)
12,007
13,184
Household income disparities
48.8%
48.5%
Housing units without a mortgage
14,867 (2.4%)
29,251 (32.9%)
Housing units with both a second mortgage and home equity loan
43,914 (7.1%)
183 (0.2%)
Housing units with a mortgage
601,226 (97.6%)
59,793 (67.1%)
Housing units with a home equity loan
2,495 (0.4%)
4,512 (5.1%)
Housing units with a second mortgage
55,108 (8.9%)
5,098 (5.7%)
Housing units lacking complete kitchen facilities
1.3%
1.5%
Housing units lacking complete plumbing facilities
Self-employed workers in own not incorporated business
231,322
45,971
State government workers
104,763
27,527
Unpaid family workers
8,965
2,234
Industries and Occupations
Manhattan is globally renowned for its finance, publishing, media, and entertainment industries. Wall Street, Madison Avenue, and Broadway highlight the rich industry landscape in Manhattan. Brooklyn, on the other hand, has seen a significant increase in technology start-ups, creative industries, and local artisanal businesses, with a growing reputation as an entrepreneurial hub.
Manhattan and Brooklyn both offer top-quality health care facilities. Manhattan has some of the nation's best hospitals, such as NewYork-Presbyterian Hospital and Mt. Sinai Hospital. Brooklyn is also equipped with good hospitals, including Maimonides Medical Center and NYU Langone Hospital-Brooklyn.
Health (county statistics)
Type
New York
Brooklyn
General health status score of residents in this county from 1 (poor) to 5 (excellent)
Manhattan's infrastructure represents a dense urban landscape, with a high concentration of high-rises, and well-maintained roads and public spaces. Brooklyn's infrastructure is a mix of residential and commercial zones, with more single-family homes and fewer skyscrapers.
Infrastructure
Type
New York
Brooklyn
Hospitals
58
104
TV stations
29
29
Bank branches located here
487
271
Bank institutions located here
87
41
Main business address for public companies
395
9
Drinking water stations with no reported violations in the past
5
12
Drinking water stations with reported violations in the past
12
75
Schools
School facilities
Type
New York
Brooklyn
Private elementary/middle schools
77
151
Private high schools
52
128
Public elementary/middle schools
214
405
Public high schools
149
176
Colleges/Universities
97
48
Culture and Food
Both Manhattan and Brooklyn stand as global cultural and food hubs with a myriad of museums, galleries, music events, and world-class restaurants. Manhattan is renowned for its theatre and fine-dining scenes, while Brooklyn is notable for its emerging indie music, artisanal food markets, and cuisine reflecting its diverse population.
Sports Teams
Manhattan is home to the iconic Madison Square Garden, hosting the New York Knicks (NBA) and the New York Rangers (NHL). Brooklyn houses the Barclays Center, home to the Brooklyn Nets (NBA), and is close to the home stadium for the New York Islanders (NHL).


 New York, NY
 Brooklyn, NY