Comparing the lifestyle between Nashville-Davidson, TN, and Northeast Cobb, GA can reveal a tale of two cities - bustling and vibrant Nashville-Davidson with its strong economy, thriving music scene, and diverse culture, against the quieter, more suburban atmosphere of Northeast Cobb with top-notch education, low crime rates, and less hectic lifestyle. Both have their unique appeal and offer different lifestyles based upon individual preferences, career opportunities, and personal lifestyle choices.
In comparison to Northeast Cobb, GA, Nashville-Davidson, TN, has a higher crime rate. According to the FBI crime data, violent crime is significantly higher in Nashville. However, it's worth noting that Nashville's downtown area, heavily frequented by tourists, tends to be safer than some outlying areas. In contrast, Northeast Cobb has a lower crime rate, making it safer and more appealing for families.
Cost of Living
The cost of living in Nashville-Davidson is slightly higher than the national average, driven by housing costs, especially in popular neighborhoods. Conversely, Northeast Cobb has a higher cost of living than Nashville-Davidson, but less than the Atlanta metropolitan area. The higher costs are primarily related to housing and transportation.
Income Tax
Tennessee, where Nashville-Davidson is located, does not have a state income tax. On the other hand, Georgia, home to Northeast Cobb, has a state income tax rate ranging from 1%-6%.
Property Tax
On average, Nashville-Davidson homeowners pay a lower effective property tax rate compared to those in Northeast Cobb. However, given the higher home prices in Nashville, this doesn’t necessarily translate to lower tax bills.
Sales Tax
The combined state and local sales tax rate in Nashville-Davidson is significantly higher at 9.25% compared to Northeast Cobb's 6%. This could have implications for both cost of living and meeting daily expenditure needs.
Income
Type
Nashville-Davidson
Northeast Cobb
Estimated median household income
$64,857
$124,910
Estimated per capita income
$42,268
$58,954
Cost of living index (U.S. average is 100)
90.9
108.8
If you make $50,000 in Nashville-Davidson, you will have to make $59,846 in Northeast Cobb to maintain the same standard of living.
Geographical Conditions
With the Cumberland River flowing through, Nashville-Davidson has a hilly landscape, offering scenic views. Northeast Cobb is less hilly and is characterized by suburban landscapes.
Geographical information
Type
Nashville-Davidson
Northeast Cobb
Land area
473.3 sq. miles
67.4 sq. miles
Population density
1,434.2 people per sq. mile
2,519.5 people per sq. mile
Education
The education system in Northeast Cobb is highly reputable, offering top-ranked public and private schools and a lower student-to-teacher ratio, ensuring more personalized attention. Nashville-Davidson, home to Vanderbilt University, offers quality education opportunities, but public schools tend to perform lower on standardized tests compared to those in Northeast Cobb.
Nashville-Davidson has a booming economy with diverse sectors like healthcare, education, music, and tourism providing numerous job opportunities. Northeast Cobb also boasts a strong economy, heavily reliant on sectors such as retail, healthcare, and education. The unemployment rate is lower in Nashville-Davidson, but the average income is higher in Northeast Cobb.
Biggest Employers
Top employers in Nashville-Davidson include Vanderbilt University and Medical Center, Nissan North America, and HCA Healthcare. In Northeast Cobb, The Home Depot, Cobb County School District, and WellStar Health System are among the biggest employers.
In Nashville-Davidson (Davidson County), 58.5% voted for Democrats and 39.9% for Republicans in 2012 Presidential Election. In Northeast Cobb (Cobb County), 43.0% voted for Democrats and 55.4% for Republicans.
Elections
Type
Democrats
Republicans
Other
Year
Nashville-Davidson
Northeast Cobb
Nashville-Davidson
Northeast Cobb
Nashville-Davidson
Northeast Cobb
2020
65.0%
56.3%
32.6%
42.0%
2.3%
1.6%
2016
60.1%
48.0%
34.1%
45.8%
5.7%
6.3%
2012
58.5%
43.0%
39.9%
55.4%
1.6%
1.6%
2008
60.0%
44.8%
39.0%
54.2%
1.0%
0.9%
2004
54.9%
37.2%
44.6%
62.1%
0.4%
0.7%
2000
57.9%
36.9%
40.4%
59.8%
1.7%
3.3%
1996
79.3%
36.8%
18.1%
56.9%
2.6%
6.3%
Breakdown of population affiliated with a religious congregation
Type
Adherents
Congregations
Religion
Nashville-Davidson
Northeast Cobb
Nashville-Davidson
Northeast Cobb
SOUTHERN BAPTIST CONVENTION
14.1%
15.3%
19.6%
27.6%
CATHOLIC CHURCH
4.9%
11.2%
2.3%
1.6%
EPISCOPAL CHURCH
1.5%
0.9%
1.8%
1.8%
SEVENTH DAY ADVENTIST CHURCH
1.1%
0.4%
1.7%
2.5%
COPTIC ORTHODOX CHURCH
1.0%
0.0%
0.5%
0.0%
MUSLIM ESTIMATE
0.8%
0.6%
1.4%
1.3%
PRESBYTERIAN CHURCH IN AMERICA
0.8%
0.3%
0.9%
2.0%
CUMBERLAND PRESBYTERIAN CHURCH
0.4%
0.0%
1.3%
0.0%
EVANGELICAL LUTHERAN CHURCH IN AMERICA
0.2%
0.5%
0.8%
1.3%
Weather
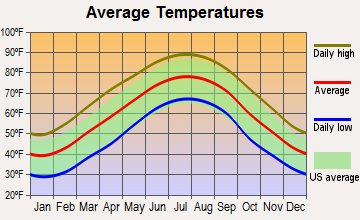
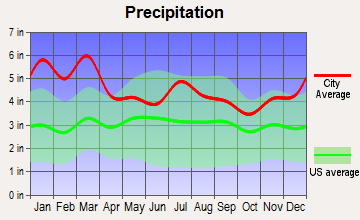
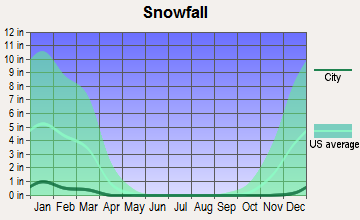
Both cities experience a typical southeastern state climate, with hot summers and mild winters. However, Nashville-Davidson gets significantly more rainfall annually, leading to more humid summers. Winters in Nashville-Davidson can bring a mixture of rain and snow, while Northeast Cobb primarily experiences rain in its cooler months.
Weather and climate
Type
Nashville-Davidson
Northeast Cobb
Temperature - Average
58.5°F
59.5°F
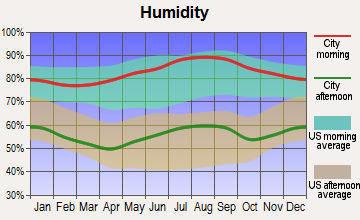
Humidity - Average morning or afternoon humidity
75.9%
74%
Humidity - Differences between morning and afternoon humidity
38%
38.2%
Humidity - Maximum monthly morning or afternoon humidity
89%
87.2%
Humidity - Minimum monthly morning or afternoon humidity
51%
49%
Precipitation - Yearly average
49 in
54.4 in
Snowfall - Yearly average
17.8 in
4.1 in
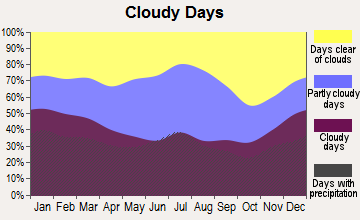
Clouds - Number of days clear of clouds
17.1%
18.4%
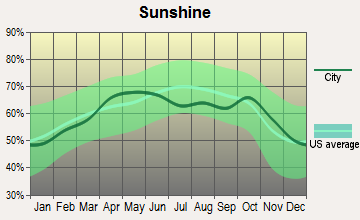
Sunshine amount - Average
59.7%
65.5%
Sunshine amount - Differences during a year
23%
17%
Sunshine amount - Maximum monthly
65%
66.9%
Sunshine amount - Minimum monthly
42%
49.9%
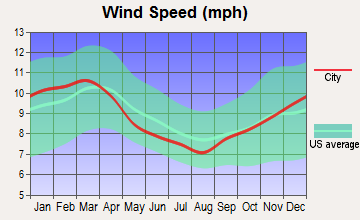
Wind speed - Average
7.7 mph
8.8 mph
Average climate in Nashville-Davidson, Tennessee
Average climate in Northeast Cobb, Georgia
Air pollution
Type
AQI
CO
NO2
OZONE
PB
PM10
PM25
SO2
Year
Nashville-Davidson
Northeast Cobb
Nashville-Davidson
Northeast Cobb
Nashville-Davidson
Northeast Cobb
Nashville-Davidson
Northeast Cobb
Nashville-Davidson
Northeast Cobb
Nashville-Davidson
Northeast Cobb
Nashville-Davidson
Northeast Cobb
Nashville-Davidson
Northeast Cobb
2018
71
84
0.40
0.27
13.8
N/A
24.1
24.0
N/A
N/A
15.2
17.5
9.2
10.0
0.2
0.5
2017
70
85
0.38
0.31
14.4
N/A
26.8
23.6
N/A
N/A
15.3
17.5
8.7
9.6
0.1
0.8
2016
90
105
0.42
0.31
16.1
N/A
26.4
26.2
N/A
N/A
N/A
17.2
10.1
10.4
0.0
0.7
2015
68
91
0.43
0.31
15.5
N/A
23.6
23.2
N/A
N/A
N/A
17.6
10.8
9.9
0.1
0.7
2014
66
87
N/A
0.31
N/A
N/A
26.3
23.2
N/A
N/A
N/A
18.4
9.8
9.8
1.4
0.8
2013
62
87
N/A
0.30
N/A
N/A
N/A
23.8
N/A
N/A
N/A
18.0
9.7
9.4
N/A
0.7
2012
81
109
N/A
0.33
N/A
N/A
28.3
25.7
N/A
N/A
N/A
19.8
11.0
10.8
2.3
0.8
2011
81
98
N/A
0.33
N/A
N/A
25.9
26.9
N/A
N/A
N/A
21.1
11.0
12.4
1.7
1.4
2010
80
102
N/A
0.35
N/A
N/A
24.3
26.0
N/A
N/A
N/A
18.5
12.2
12.3
2.2
1.8
2009
72
96
N/A
N/A
N/A
N/A
22.5
24.5
N/A
N/A
N/A
18.5
11.5
11.9
2.4
1.7
2008
81
99
N/A
0.53
N/A
15.3
25.7
30.2
N/A
0.003
N/A
22.5
13.4
14.3
2.5
2.5
2007
99
123
N/A
0.45
N/A
17.0
27.4
32.6
N/A
0.003
N/A
29.4
15.5
16.9
2.7
2.7
2006
93
124
0.69
0.58
N/A
15.5
24.9
32.4
N/A
0.003
N/A
22.9
14.9
16.9
2.9
3.4
2005
104
117
0.56
0.55
N/A
16.0
23.5
28.9
N/A
0.005
N/A
25.5
16.9
15.0
3.1
3.2
2004
83
118
0.61
0.54
N/A
16.2
22.0
26.9
0.006
0.004
N/A
22.9
N/A
14.3
2.6
2.8
2003
93
109
0.67
0.56
N/A
16.3
18.5
25.8
0.005
0.004
N/A
22.2
15.8
15.2
3.8
3.0
2002
92
121
0.67
0.60
N/A
17.7
20.2
28.6
N/A
N/A
N/A
23.2
15.3
13.1
4.3
3.0
2001
95
115
0.89
0.69
N/A
20.3
19.5
28.2
N/A
N/A
N/A
27.0
15.6
N/A
4.5
3.1
2000
97
129
0.74
0.50
N/A
20.2
19.8
30.3
N/A
N/A
N/A
28.4
N/A
N/A
4.1
3.2
Natural disasters
Type
Nashville-Davidson
Northeast Cobb
Tornado activity compared to U.S. average
169.1%
164.6%
Earthquake activity compared to U.S. average
296.1%
161.9%
Natural disasters compared to U.S. average
17%
14%
Transportation
Nashville-Davidson has a better transit system, including public buses, the Music City Star commuter rail, and rideshares. Northeast Cobb is heavily car-dependent, with limited public transportation options.
Transport
Type
Nashville-Davidson
Northeast Cobb
Amtrak stations nearby
1
1
Means of transportation to work
Type
Nashville-Davidson
Northeast Cobb
Bicycle
0.3%
0.1%
Bus
1.2%
0.4%
Carpooled
9.8%
8%
Car alone
85.5%
83.1%
Subway
0%
0.2%
Taxicab
0.1%
0.1%
Walked
1.8%
0.8%
Average travel time to work
Type
Nashville-Davidson
Northeast Cobb
Average
31.3 min
29.9 min
Real Estate
Nashville-Davidson's real estate market is more dynamic with a mix of modern condos, historic homes, and single-family houses, but higher-priced than Northeast Cobb. Northeast Cobb offers a more suburban housing style with large yards at lower costs.
Neighborhoods
Nashville-Davidson offers a variety of neighborhoods from the bustling downtown, trendy East Nashville to the upscale Green Hills. Northeast Cobb is characterized by suburban neighborhoods with large houses and top-rated schools.
Houses and residents
Type
Nashville-Davidson
Northeast Cobb
Houses
331,262
55,687
Average household size (people)
2.3
2.7
Houses occupied
305,247 (92.1%)
53,995 (97%)
Houses occupied by owners
162,426 (53.2%)
44,004 (81.5%)
Houses occupied by renters
142,821 (46.8%)
9,991 (18.5%)
Median rent asked for vacant for-rent units
$1,391
$1,359
Median price asked for vacant for-sale houses and condos
$221,129
$288,766
Estimated median house or condo value
$346,700
$434,285
Median number of rooms in apartments
4.2
4.2
Median number of rooms in houses and condos
6.3
8.7
Renting percentage
44.6%
20.2%
Housing density (houses/condos per square mile)
699.9
826.5
Household income disparities
45.4%
33.9%
Housing units without a mortgage
3,189 (2.8%)
5,031 (12.1%)
Housing units with both a second mortgage and home equity loan
10,988 (9.6%)
162 (0.4%)
Housing units with a mortgage
110,850 (97.2%)
36,398 (87.9%)
Housing units with a home equity loan
333 (0.3%)
6,379 (15.4%)
Housing units with a second mortgage
13,192 (11.6%)
4,164 (10.1%)
Housing units lacking complete kitchen facilities
1.3%
0.2%
Housing units lacking complete plumbing facilities
Self-employed workers in own not incorporated business
31,952
5,127
State government workers
15,693
1,584
Unpaid family workers
463
233
Industries and Occupations
Healthcare is the leading industry in Nashville-Davidson, followed by manufacturing, and education. The music industry also provides a multitude of opportunities. Northeast Cobb's principal sectors include retail trade, scientific and professional services, and healthcare.
Nashville-Davidson has a robust healthcare system, being the home of renowned Vanderbilt University Medical Center. Healthcare in Northeast Cobb is also top-notch with easy access to some of the best medical facilities within the Atlanta metro area.
Health (county statistics)
Type
Nashville-Davidson
Northeast Cobb
General health status score of residents in this county from 1 (poor) to 5 (excellent)
Nashville-Davidson offers excellent infrastructure, with Nashville International Airport, extensive highway networks, and robust public transit. Conversely, Northeast Cobb relies heavily on motorways, lacks major public transportation, and is located approximately an hour from Hartsfield-Jackson Atlanta International Airport.
Infrastructure
Type
Nashville-Davidson
Northeast Cobb
TV stations
19
24
Culture and Food
Nashville-Davidson is renowned for its vibrant music scene, arts, and food culture, with a special emphasis on hot chicken and barbecue. Northeast Cobb provides a more subdued cultural scene, with an emphasis on family-friendly activities and traditional Southern cuisine.
Sports Teams
Nashville-Davidson hosts professional NFL and NHL teams, Nashville Titans and Nashville Predators respectively, adding a vibrant sporting culture. Northeast Cobb doesn’t have any professional sports teams, but residents can enjoy Atlanta metro area's teams within a short drive.


 Nashville-Davidson, TN and
  Northeast Cobb, GA : 197.1 miles