Milwaukee and Madison are both popular cities located in Wisconsin. Both cities offer unique amenities, cultures, and lifestyles that draw tourists and new residents alike. This article seeks to provide a comprehensive comparison between these two cities in terms of crime and safety, weather, cost of living, education, work and economy, infrastructure, industries and occupations, largest employers, real estate, neighborhoods, transportation and commuting, taxes, culture, sports, geographical conditions, and healthcare.
Distance between
Milwaukee, WI and
Madison, WI : 72.6 miles
Milwaukee's population is larger by 112%. Its population has decreased by 27,644 people (4.6%) since 2000. The population of Madison has grown by 61,142 people (29.4%) during that time.
On average, the crime rate in Milwaukee is higher than Madison, which often ranks among the safest cities in Wisconsin and the U.S. However, like all cities, crime levels can vary significantly by neighborhood. It is worth noting, though, that both cities have effective law enforcement agencies that work towards ensuring the safety and security of residents and visitors alike.
City-data.com crime index counts serious crimes and violent crime more heavily. It adjusts for the number of visitors and daily workers commuting into cities. (higher means more crime, U.S. average = 301.1)
City-data.com crime index counts serious crimes and violent crime more heavily. It adjusts for the number of visitors and daily workers commuting into cities. (higher means more crime, U.S. average = 301.1)
Sex Offenders
According to our data, there are 2,403 registered sex offenders living in Milwaukee and 563 registered sex offenders living in . The ratio of residents to sex offenders in Milwaukee is 248 to 1; the ratio in Madison is 449 to 1. The number of registered sex offenders compared to the number of residents is larger in Milwaukee than in Madison.
Cost of Living
Overall, Madison's cost of living indices is somewhat higher than that of Milwaukee, mainly due to housing costs. However, the overall difference is not significant and varies depending on the specific expenses, like food, healthcare, utilities, and transportation.
Income Tax
Both cities fall under the same Wisconsin state income tax rates, which range from 3.54% - 7.65% based on your income level.
Property Tax
Property taxes in Madison tend to be higher than in Milwaukee, reflecting higher home values. However, it's crucial to consider the specific property and neighborhood when evaluating tax expenses.
Sales Tax
The sales tax rates are relatively similar in both cities, with minor variations depending on the type of product or service purchased. Residents in both cities pay the same state sales tax rate of 5%.
Income
Type
Milwaukee
Madison
Estimated median household income
$46,637
$67,270
Estimated per capita income
$26,998
$42,473
Cost of living index (U.S. average is 100)
97.5
98.2
If you make $50,000 in Milwaukee, you will have to make $50,359 in Madison to maintain the same standard of living.
Geographical Conditions
Milwaukee is located on the shores of Lake Michigan, offering beautiful lakefront views and opportunities for water-based activities. Madison, located between Lakes Mendota and Monona, is known as "The City of Four Lakes" and also offers numerous recreational opportunities.
Madison is home to the University of Wisconsin-Madison, one of the top research universities in the world, which contributes to the city's strong educational sector. Milwaukee also offers good educational opportunities, with institutions like Marquette University and the University of Wisconsin-Milwaukee, but Madison often ranks higher in educational attainment.
Milwaukee, as a larger city, has a more diverse economy with more job opportunities in manufacturing, healthcare, and financial services. Madison, with its state university and position as the state capital, has an economy leaning more towards public sector jobs and education.
Biggest Employers
In Milwaukee, some of the largest employers include the Aurora Health Care, Kohl's Corp, and Ascension Wisconsin. In Madison, the largest employers are the State of Wisconsin, University of Wisconsin-Madison, and American Family Insurance.
There were 28 building permits issued in Milwaukee in 2012 (103 less than in 2011) compared to 327 building permits issued in Madison in 2012 (150 more than in 2011).
In Milwaukee (Milwaukee County), 67.8% voted for Democrats and 31.6% for Republicans in 2012 Presidential Election. In Madison (Dane County), 71.2% voted for Democrats and 27.6% for Republicans.
Elections
Type
Democrats
Republicans
Other
Year
Milwaukee
Madison
Milwaukee
Madison
Milwaukee
Madison
2020
69.3%
75.9%
29.4%
23.0%
1.3%
1.1%
2016
65.6%
70.5%
28.6%
23.1%
5.8%
6.5%
2012
67.8%
71.2%
31.6%
27.6%
0.5%
1.2%
2008
67.8%
73.2%
31.7%
26.0%
0.5%
0.9%
2004
62.0%
66.2%
37.5%
33.0%
0.5%
0.8%
2000
58.5%
61.4%
37.9%
32.7%
3.6%
6.0%
1996
58.3%
56.9%
32.2%
30.9%
9.5%
12.2%
Breakdown of population affiliated with a religious congregation
Type
Adherents
Congregations
Religion
Milwaukee
Madison
Milwaukee
Madison
CATHOLIC CHURCH
21.0%
21.7%
10.8%
9.7%
LUTHERAN CHURCH
3.0%
0.8%
5.9%
3.4%
EVANGELICAL LUTHERAN CHURCH IN AMERICA
2.4%
10.0%
6.7%
13.7%
WISCONSIN EVANGELICAL LUTHERAN SYNOD
2.2%
0.9%
6.0%
3.1%
SOUTHERN BAPTIST CONVENTION
1.3%
0.1%
4.3%
2.3%
MUSLIM ESTIMATE
1.0%
0.5%
1.1%
0.9%
AMERICAN BAPTIST CHURCHES IN THE USA
0.7%
0.8%
3.1%
0.9%
EPISCOPAL CHURCH
0.4%
0.3%
1.7%
1.4%
Weather
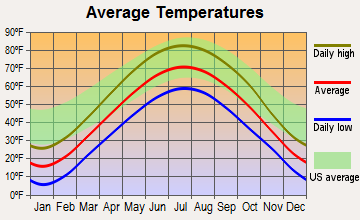
Both cities experience a continental climate with hot summers and chilling winters. Milwaukee, being on Lake Michigan, might have colder winters than Madison due to the lake-effect snow. However, both cities offer wonderful opportunities to enjoy outdoor activities during every season.
Weather and climate
Type
Milwaukee
Madison
Temperature - Average
48.1°F
45.4°F
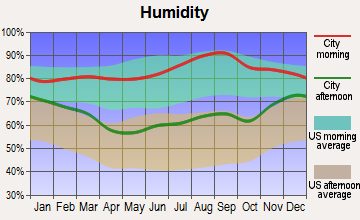
Humidity - Average morning or afternoon humidity
77%
77.7%
Humidity - Differences between morning and afternoon humidity
26%
37%
Humidity - Maximum monthly morning or afternoon humidity
85%
90%
Humidity - Minimum monthly morning or afternoon humidity
59%
53%
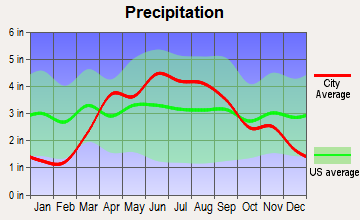
Precipitation - Yearly average
33.3 in
35.2 in
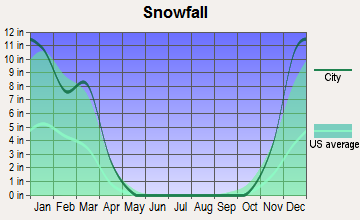
Snowfall - Yearly average
95.8 in
88.6 in
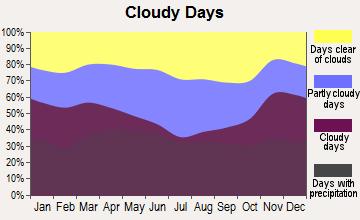
Clouds - Number of days clear of clouds
14.9%
14.7%
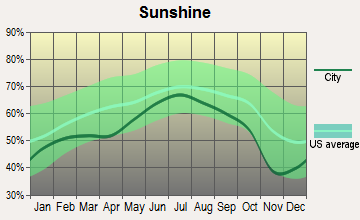
Sunshine amount - Average
57.6%
56.6%
Sunshine amount - Differences during a year
34%
31%
Sunshine amount - Maximum monthly
69%
67%
Sunshine amount - Minimum monthly
35%
36%
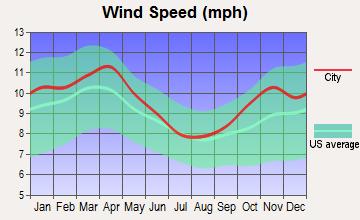
Wind speed - Average
11 mph
8.8 mph
Average climate in Milwaukee, Wisconsin
Average climate in Madison, Wisconsin
Air pollution
Type
AQI
CO
NO2
OZONE
PB
PM10
PM25
SO2
Year
Milwaukee
Madison
Milwaukee
Milwaukee
Milwaukee
Madison
Milwaukee
Madison
Milwaukee
Milwaukee
Madison
Milwaukee
Madison
2018
84
72
N/A
N/A
8.8
N/A
28.2
31.7
N/A
N/A
15.3
N/A
7.8
8.6
0.2
0.2
2017
80
67
N/A
N/A
8.9
N/A
27.7
31.0
N/A
N/A
14.3
N/A
6.9
7.4
0.3
0.8
2016
86
68
N/A
N/A
9.4
N/A
27.0
31.3
N/A
N/A
15.0
N/A
7.4
8.5
1.2
0.0
2015
78
72
N/A
N/A
9.6
N/A
27.2
32.2
N/A
N/A
14.9
N/A
7.8
7.6
1.1
0.1
2014
89
79
N/A
N/A
9.9
N/A
26.0
32.2
N/A
N/A
15.4
N/A
9.2
8.8
1.0
1.1
2013
81
75
N/A
N/A
10.4
N/A
26.9
34.0
N/A
N/A
15.4
N/A
9.6
9.2
0.7
1.4
2012
108
92
N/A
N/A
11.5
N/A
28.3
36.6
N/A
N/A
17.2
N/A
9.6
9.3
1.0
N/A
2011
95
85
N/A
N/A
11.4
N/A
27.3
32.0
N/A
N/A
16.2
N/A
10.1
10.5
1.2
N/A
2010
83
81
N/A
N/A
12.9
N/A
26.9
30.9
N/A
N/A
N/A
N/A
N/A
12.6
N/A
N/A
2009
69
49
N/A
N/A
12.2
N/A
23.7
27.9
N/A
N/A
N/A
N/A
N/A
N/A
N/A
N/A
2008
61
54
N/A
N/A
12.4
N/A
24.6
29.3
N/A
N/A
17.3
N/A
N/A
N/A
N/A
N/A
2007
80
68
N/A
N/A
14.2
N/A
24.1
29.0
N/A
N/A
19.9
N/A
N/A
N/A
N/A
N/A
2006
66
56
0.35
N/A
14.7
N/A
22.8
27.8
0.017
N/A
19.9
N/A
N/A
N/A
2.6
N/A
2005
99
88
0.36
N/A
16.6
N/A
25.1
34.6
0.015
0.004
25.4
N/A
N/A
N/A
3.1
N/A
2004
75
62
0.41
N/A
16.6
N/A
21.2
29.2
0.011
N/A
21.4
N/A
N/A
N/A
3.3
N/A
2003
76
85
0.41
N/A
16.7
N/A
27.1
34.2
0.017
0.005
N/A
N/A
N/A
N/A
3.3
N/A
2002
92
89
0.40
N/A
N/A
N/A
28.9
33.3
0.018
0.005
N/A
N/A
N/A
N/A
3.7
N/A
2001
96
83
0.34
N/A
15.8
N/A
28.3
33.6
0.020
N/A
N/A
N/A
N/A
N/A
3.0
N/A
2000
84
78
0.29
N/A
16.5
N/A
27.0
28.5
0.018
N/A
N/A
N/A
N/A
N/A
3.4
N/A
Natural disasters
Type
Milwaukee
Madison
Tornado activity compared to U.S. average
118.1%
172.3%
Earthquake activity compared to U.S. average
109.3%
137.1%
Natural disasters compared to U.S. average
19%
18%
Transportation
Milwaukee has a comprehensive public transit system including buses, shuttles, and Amtrak. Madison also has a good local bus service, with less reach than Milwaukee's and often caters to university students. Commute times in both cities are comparable and largely depend on the distance between work and home.
Transport
Type
Milwaukee
Madison
Amtrak stations
1
1
Amtrak stations nearby
1
1
FAA registered aircraft
202
192
FAA registered aircraft manufacturers and dealers
1
0
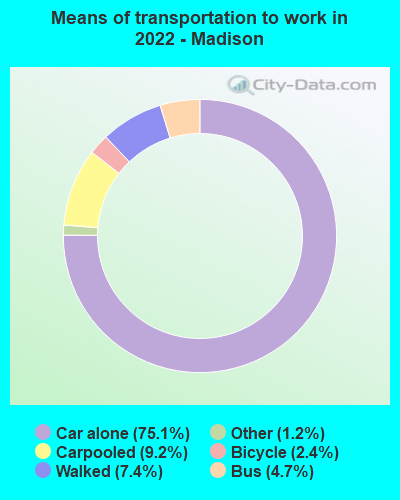
Means of transportation to work
Type
Milwaukee
Madison
Bicycle
0.5%
2.6%
Bus
4.2%
2.7%
Carpooled
8.4%
6%
Car alone
81.1%
78.7%
Motorcycle
0.1%
0.2%
Taxicab
0.2%
0.2%
Walked
3.9%
8%
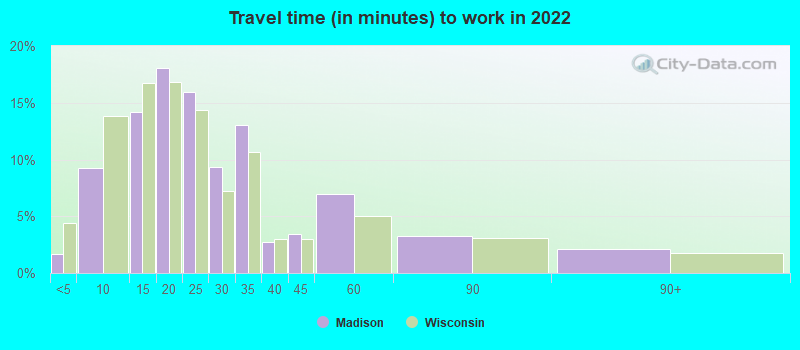
Average travel time to work
Type
Milwaukee
Madison
Average
24.2 min
24.5 min
Other means
21.1 min
19 min
Public transportation
40.3 min
29.2 min
Private vehicle occupancy
Type
Milwaukee
Madison
Average
1.2
1.1
Drove alone
88.7%
91.8%
In 2 person carpool
8.4%
6.5%
In 3 person carpool
1.6%
0.9%
In 4 person carpool
0.7%
0.2%
In 5-6 person carpool
0.4%
0.2%
In 7+ person carpool
0.1%
0%
How many people usually rode to work in the car, truck or van.
Real Estate
Real estate in Madison is generally more expensive than Milwaukee's, reflecting the higher cost of living. However, both cities offer diverse housing options that can cater to different budgets and lifestyle preferences.
Neighborhoods
In both cities, neighborhoods vary significantly. Madison, with its downtown area packed around the Capitol and University of Wisconsin-Madison, has a more concentrated city vibe. Milwaukee offers a more diverse mix, from quiet suburbs to bustling downtown areas.
Houses and residents
Type
Milwaukee
Madison
Houses
257,812
129,717
Average household size (people)
2.5
2.2
Median year apartment built
1956
1982
Median year house/condo built
1952
1974
Length of stay in the house since moving in
14.1 years
13.2 years
Houses occupied
232,362 (90.1%)
123,938 (95.5%)
Houses occupied by owners
96,044 (41.3%)
60,243 (48.6%)
Houses occupied by renters
136,318 (58.7%)
63,695 (51.4%)
Median rent asked for vacant for-rent units
$854.05
$2,135
Median monthly housing costs
$965
$1,351
Median price asked for vacant for-sale houses and condos
$172,751
$175,077
Estimated median house or condo value
$160,100
$321,800
Median numbers of rooms
4.9
4.9
Median number of rooms in apartments
4.3
3.7
Median number of rooms in houses and condos
5.7
6.5
Median house price - detached houses
$177,554
$351,769
Median house price - in 2-unit structures
$161,248
$350,485
Median house price - in 3-to-4-unit structures
$178,933
$238,103
Median house price - in 5 or more unit structures
$222,376
$277,140
Median house price - mobile homes
$67,466
$9,290
Median house price - Townhouses or other attached units
$171,473
$258,266
Median house price - All housing units
$176,965
$335,361
Median house age
68
43
Renting percentage
56.4%
50.7%
Housing density (houses/condos per square mile)
2,683.8
1,888.9
House value disparities
33%
27.2%
Household income disparities
46.1%
45.9%
Median household income for houses/condes with a mortgage
$72,490
$112,726
Median household income for apartments without a mortgage
$53,843
$80,181
Housing units without a mortgage
1,800 (2.8%)
1,001 (2.3%)
Housing units with both a second mortgage and home equity loan
3,918 (6.2%)
5,840 (13.7%)
Housing units with a mortgage
61,602 (97.2%)
41,600 (97.7%)
Housing units with a home equity loan
270 (0.4%)
44 (0.1%)
Housing units with a second mortgage
5,023 (7.9%)
6,790 (15.9%)
House/condo owner moved in on average (years ago)
13
11
House/condo renter moved in on average (years ago)
1
1
Housing units lacking complete kitchen facilities
4.5%
0.6%
Housing units lacking complete plumbing facilities
1.1%
0.2%
Housing units in structures
Housing units in structures
Milwaukee
Madison
One, detached
38.9%
41.5%
One, attached
4.5%
5.7%
Two
23.5%
4.5%
3 or 4
6.3%
7.1%
5 to 9
6.3%
8.0%
10 to 19
4.1%
5.2%
20 to 49
6.6%
12.3%
50 or more
9.5%
15.4%
Mobile homes
0.3%
0.2%
Median real estate property taxes paid for housing units
Self-employed workers in own not incorporated business
10,069
7,087
State government workers
7,334
26,258
Unpaid family workers
199
73
Industries and Occupations
Milwaukee is known for manufacturing, financial services, and healthcare sectors. Conversely, Madison's economy is dominated by government jobs, healthcare, and higher education.
Both cities have excellent healthcare facilities. Milwaukee is home to world-class healthcare providers like the Aurora Health Care and the Froedtert Hospital. Madison houses the University of Wisconsin Hospital and Clinics, which is nationally ranked in various specialties.
Health (county statistics)
Type
Milwaukee
Madison
General health status score of residents in this county from 1 (poor) to 5 (excellent)
Milwaukee has a more developed infrastructure due to its size and age. It possesses international airports, larger ports, and more developed transport links. Madison, however, is smaller and less crowded, which may appeal to those desiring a slower pace of life.
Infrastructure
Type
Milwaukee
Madison
Hospitals
29
10
TV stations
17
9
Arenas or stadiums
3
2
Bank branches located here
146
90
Bank institutions located here
29
23
Main business address for public companies
32
7
Drinking water stations with no reported violations in the past
24
169
Drinking water stations with reported violations in the past
HMDA - Conventional home purchase loans - Applications denied
Year
Milwaukee
Madison
1999
1,506
218
2000
1,666
210
2001
1,410
157
2002
1,157
167
2003
1,641
305
2004
2,251
398
2005
3,325
532
2006
4,218
453
2007
2,555
354
2008
719
196
2009
456
160
Culture and Food
Both cities boast rich cultures and diverse food scenes. Madison's culture is shaped by its status as a university town and state capital, with many cultural events and festivals throughout the year. Milwaukee, located on Lake Michigan, showcases a unique blend of cultural influences reflected in its food, music, and art scenes.
Sports Teams
Milwaukee is home to the Milwaukee Bucks in the NBA and the Brewers in the MLB. Madison doesn't have any major league sports teams but does have a very passionate fan base for the University of Wisconsin-Madison's sports teams, collectively known as the Badgers.


 Milwaukee, WI
 Madison, WI