Milwaukee, Wisconsin and Grand Rapids, Michigan, two Midwestern cities with unique characteristics, offer different yet compelling lifestyles. While Milwaukee is larger and more diverse, with a rich history of brewing and manufacturing, Grand Rapids has a smaller, hometown feel with a dynamic arts scene. Differences in crime, weather, cost of living, and economy, combined with cultural contrasts, make these cities interesting subjects for comparison and contrast. The following discussion will delve into these distinctive features to aid those considering relocation or just a visit.
Distance between
Milwaukee, WI and
Grand Rapids, MI : 116.3 miles
Milwaukee's population is larger by 188%. Its population has decreased by 27,644 people (4.6%) since 2000. The population of Grand Rapids has decreased by 384 people (0.2%) during that time.
In crime rate comparisons, both cities have areas to improve. According to FBI statistics, Milwaukee has a higher overall crime rate when compared to the national average. Grand Rapids, on the other hand, has a lower crime rate than Milwaukee, but it's still above the national average. Milwaukee has several initiatives in place to address crime issues, such as Safe & Sound and Bear Clan Patrol. Grand Rapids has made similar efforts, including a "Safe Alliances for Everyone" Task Force (SAFE).
City-data.com crime index counts serious crimes and violent crime more heavily. It adjusts for the number of visitors and daily workers commuting into cities. (higher means more crime, U.S. average = 301.1)
City-data.com crime index counts serious crimes and violent crime more heavily. It adjusts for the number of visitors and daily workers commuting into cities. (higher means more crime, U.S. average = 301.1)
Sex Offenders
According to our data, there are 2,403 registered sex offenders living in Milwaukee and 1,547 registered sex offenders living in . The ratio of residents to sex offenders in Milwaukee is 248 to 1; the ratio in Grand Rapids is 127 to 1. The number of registered sex offenders compared to the number of residents is a smaller in Milwaukee than in Grand Rapids.
Cost of Living
If we talk about the cost of living, Grand Rapids typically has a lower cost of living compared to Milwaukee. Housing is the most considerable factor in cost of living differences. In Grand Rapids, homes are generally more affordable, though prices are rising because of increased demand.
Income Tax
Wisconsin's state income tax rates range from 3.54% to 7.65%, which are applicable in Milwaukee. Grand Rapids residents, however, are subjected to Michigan’s flat-rate state income tax, which is currently 4.25%.
Property Tax
Property taxes are another area where you see a difference. The average property tax rate in Milwaukee is higher than that in Grand Rapids, according to the Tax Foundation.
Sales Tax
The sales tax in Milwaukee is 5.6%, while Grand Rapids has a sales tax of 6%. Though the difference isn't huge, it can make a slight impact on overall cost of living.
Income
Type
Milwaukee
Grand Rapids
Estimated median household income
$46,637
$59,596
Estimated per capita income
$26,998
$30,939
Cost of living index (U.S. average is 100)
97.5
86
If you make $50,000 in Grand Rapids, you will have to make $56,686 in Milwaukee to maintain the same standard of living.
Geographical Conditions
Both cities are on the shores of Lake Michigan, offering waterfront views and activities. Milwaukee rests along lake's western shore, while Grand Rapids sits just a bit inland, on the Grand River.
Both cities have strong education sectors. Milwaukee has more schools and universities, including the University of Wisconsin-Milwaukee and Marquette University. Grand Rapids is home to institutions such as Grand Valley State University and Calvin University. Both cities value education and are continually improving their K-12 public education systems.
Economically, Milwaukee has a diverse mix of manufacturing, healthcare, and service industries. The city is home to several Fortune 500 companies. Grand Rapids is known as a hub for health care and manufacturing, and has been named one of the best places to start a business. Both cities have a strong job market with opportunities in multiple sectors.
Biggest Employers
In Milwaukee, some of the biggest employers include healthcare providers such as Aurora Health Care and Ascension Wisconsin, along with schools like the University of Wisconsin-Milwaukee. Grand Rapids also boasts major healthcare employers, including Spectrum Health and Mercy Health, as well as large manufacturers like Steelcase and Amway.
There were 28 building permits issued in Milwaukee in 2012 (103 less than in 2011) compared to 43 building permits issued in Grand Rapids in 2012 (20 more than in 2011).
In Milwaukee (Milwaukee County), 67.8% voted for Democrats and 31.6% for Republicans in 2012 Presidential Election. In Grand Rapids (Kent County), 45.5% voted for Democrats and 53.2% for Republicans.
Elections
Type
Democrats
Republicans
Other
Year
Milwaukee
Grand Rapids
Milwaukee
Grand Rapids
Milwaukee
Grand Rapids
2020
69.3%
52.0%
29.4%
45.9%
1.3%
2.1%
2016
65.6%
44.6%
28.6%
47.7%
5.8%
7.6%
2012
67.8%
45.5%
31.6%
53.2%
0.5%
1.3%
2008
67.8%
49.5%
31.7%
49.0%
0.5%
1.5%
2004
62.0%
40.4%
37.5%
59.1%
0.5%
0.5%
2000
58.5%
38.2%
37.9%
59.5%
3.6%
2.3%
1996
58.3%
38.5%
32.2%
54.3%
9.5%
7.2%
Breakdown of population affiliated with a religious congregation
Type
Adherents
Congregations
Religion
Milwaukee
Grand Rapids
Milwaukee
Grand Rapids
CATHOLIC CHURCH
21.0%
19.0%
10.8%
6.5%
LUTHERAN CHURCH
3.0%
1.1%
5.9%
3.0%
EVANGELICAL LUTHERAN CHURCH IN AMERICA
2.4%
1.2%
6.7%
2.3%
WISCONSIN EVANGELICAL LUTHERAN SYNOD
2.2%
0.2%
6.0%
0.5%
SOUTHERN BAPTIST CONVENTION
1.3%
0.0%
4.3%
0.9%
MUSLIM ESTIMATE
1.0%
1.4%
1.1%
0.9%
AMERICAN BAPTIST CHURCHES IN THE USA
0.7%
0.0%
3.1%
0.4%
EPISCOPAL CHURCH
0.4%
0.4%
1.7%
1.2%
SEVENTH DAY ADVENTIST CHURCH
0.3%
0.5%
1.3%
2.8%
REFORMED CHURCH IN AMERICA
0.1%
2.5%
0.4%
6.7%
CHRISTIAN REFORMED CHURCH NORTH AMERICA
0.0%
7.2%
0.1%
14.1%
PROTESTANT REFORMED CHURCHES IN AMERICA
0.0%
0.3%
0.0%
1.1%
Weather
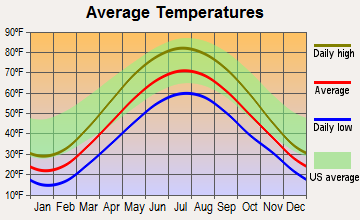
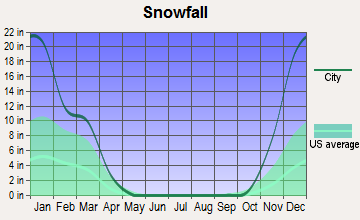
In terms of climate, both cities experience the typical Midwest weather: cold winters and warm summers. Lake Michigan creates a significant impact on the weather patterns in both locations. Milwaukee tends to have slightly colder winters due to its northern location. Grand Rapids, however, gets more snowfall due to the lake-effect snow from Lake Michigan.
Weather and climate
Type
Milwaukee
Grand Rapids
Temperature - Average
48.1°F
47.4°F
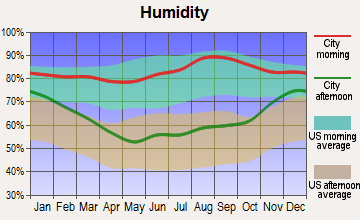
Humidity - Average morning or afternoon humidity
77%
77.8%
Humidity - Differences between morning and afternoon humidity
26%
35%
Humidity - Maximum monthly morning or afternoon humidity
85%
88%
Humidity - Minimum monthly morning or afternoon humidity
59%
53%
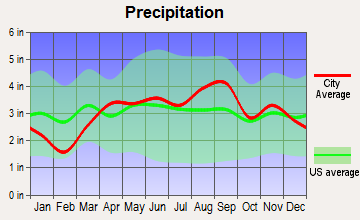
Precipitation - Yearly average
33.3 in
37.1 in
Snowfall - Yearly average
95.8 in
150 in
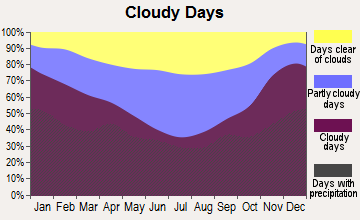
Clouds - Number of days clear of clouds
14.9%
10.8%
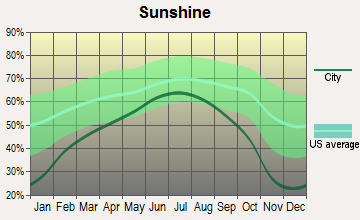
Sunshine amount - Average
57.6%
50.5%
Sunshine amount - Differences during a year
34%
45%
Sunshine amount - Maximum monthly
69%
66%
Sunshine amount - Minimum monthly
35%
21%
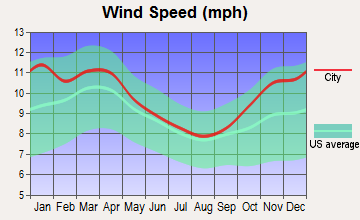
Wind speed - Average
11 mph
10.3 mph
Average climate in Milwaukee, Wisconsin
Average climate in Grand Rapids, Michigan
Air pollution
Type
AQI
CO
NO2
OZONE
PB
PM10
PM25
SO2
Year
Milwaukee
Grand Rapids
Milwaukee
Grand Rapids
Milwaukee
Grand Rapids
Milwaukee
Grand Rapids
Milwaukee
Grand Rapids
Milwaukee
Milwaukee
Grand Rapids
Milwaukee
Grand Rapids
2018
84
68
N/A
0.24
8.8
N/A
28.2
26.9
N/A
N/A
15.3
N/A
7.8
8.0
0.2
0.2
2017
80
64
N/A
0.22
8.9
N/A
27.7
27.5
N/A
N/A
14.3
N/A
6.9
8.2
0.3
0.5
2016
86
80
N/A
0.24
9.4
N/A
27.0
28.3
N/A
N/A
15.0
N/A
7.4
8.5
1.2
0.4
2015
78
78
N/A
0.23
9.6
N/A
27.2
27.8
N/A
N/A
14.9
N/A
7.8
9.4
1.1
0.7
2014
89
76
N/A
0.24
9.9
N/A
26.0
26.8
N/A
N/A
15.4
N/A
9.2
9.6
1.0
0.9
2013
81
79
N/A
0.24
10.4
N/A
26.9
29.1
N/A
N/A
15.4
N/A
9.6
9.1
0.7
0.7
2012
108
86
N/A
0.28
11.5
N/A
28.3
27.5
N/A
N/A
17.2
N/A
9.6
9.4
1.0
0.8
2011
95
80
N/A
0.28
11.4
N/A
27.3
26.3
N/A
N/A
16.2
N/A
10.1
9.3
1.2
0.7
2010
83
62
N/A
0.32
12.9
N/A
26.9
27.7
N/A
0.006
N/A
N/A
N/A
N/A
N/A
1.0
2009
69
51
N/A
0.28
12.2
N/A
23.7
24.7
N/A
N/A
N/A
N/A
N/A
N/A
N/A
0.9
2008
61
57
N/A
0.27
12.4
N/A
24.6
N/A
N/A
N/A
17.3
N/A
N/A
N/A
N/A
1.1
2007
80
93
N/A
0.26
14.2
N/A
24.1
N/A
N/A
N/A
19.9
N/A
N/A
N/A
N/A
N/A
2006
66
78
0.35
0.37
14.7
14.3
22.8
N/A
0.017
0.006
19.9
N/A
N/A
N/A
2.6
0.8
2005
99
85
0.36
0.34
16.6
15.1
25.1
N/A
0.015
0.008
25.4
N/A
N/A
N/A
3.1
1.1
2004
75
62
0.41
0.34
16.6
14.1
21.2
N/A
0.011
0.009
21.4
N/A
N/A
N/A
3.3
1.1
2003
76
84
0.41
0.38
16.7
17.5
27.1
N/A
0.017
0.009
N/A
N/A
N/A
N/A
3.3
1.4
2002
92
86
0.40
0.38
N/A
17.2
28.9
N/A
0.018
0.008
N/A
N/A
N/A
N/A
3.7
1.6
2001
96
69
0.34
0.33
15.8
N/A
28.3
N/A
0.020
0.011
N/A
N/A
N/A
N/A
3.0
1.3
2000
84
62
0.29
0.45
16.5
N/A
27.0
N/A
0.018
0.017
N/A
N/A
N/A
N/A
3.4
1.0
Natural disasters
Type
Milwaukee
Grand Rapids
Tornado activity compared to U.S. average
118.1%
104.1%
Earthquake activity compared to U.S. average
109.3%
73.2%
Natural disasters compared to U.S. average
19%
11%
Transportation
Both cities have a variety of public transportation options. Milwaukee’s Milwaukee County Transit System (MCTS) provides bus services throughout the county. Grand Rapids’ transportation system, The Rapid, serves the city and surrounding areas. Both cities also encourage biking and walking, with bike lanes and trails available.
Transport
Type
Milwaukee
Grand Rapids
Amtrak stations
1
1
Amtrak stations nearby
1
2
FAA registered aircraft
202
186
FAA registered aircraft manufacturers and dealers
1
12
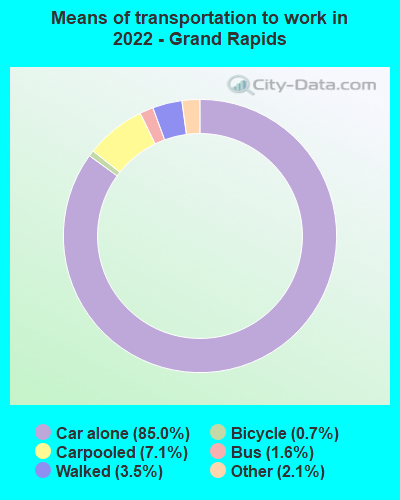
Means of transportation to work
Type
Milwaukee
Grand Rapids
Bicycle
0.5%
0.8%
Bus
4.2%
1.7%
Carpooled
8.4%
7.2%
Car alone
81.1%
86.1%
Taxicab
0.2%
0.2%
Walked
3.9%
3.4%
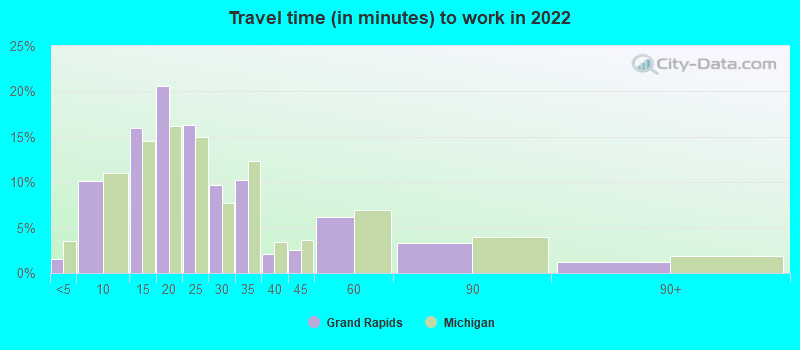
Average travel time to work
Type
Milwaukee
Grand Rapids
Average
24.2 min
23.8 min
Other means
21.1 min
20 min
Public transportation
40.3 min
34.8 min
Private vehicle occupancy
Type
Milwaukee
Grand Rapids
Average
1.2
1.2
Drove alone
88.7%
88.6%
In 2 person carpool
8.4%
9.5%
In 3 person carpool
1.6%
0.9%
In 4 person carpool
0.7%
0.2%
In 5-6 person carpool
0.4%
0.5%
In 7+ person carpool
0.1%
0.2%
How many people usually rode to work in the car, truck or van.
Real Estate
The real estate market in Milwaukee shows stability, with a mixed range of affordable housing and high-value properties. Grand Rapids' market is a bit tighter, with supply often falling short of demand, leading to rising home prices.
Neighborhoods
Each city has a diverse range of neighborhoods with unique characteristics. Milwaukee's neighborhoods, such as the Historic Third Ward and Bay View, offer a variety of culture and history. In Grand Rapids, neighborhoods like Cherry Hill or Eastown are known for their unique shops, restaurants, and festivals.
Houses and residents
Type
Milwaukee
Grand Rapids
Houses
257,812
85,623
Average household size (people)
2.5
2.5
Median year apartment built
1956
1966
Median year house/condo built
1952
1951
Length of stay in the house since moving in
14.1 years
13.2 years
Houses occupied
232,362 (90.1%)
79,486 (92.8%)
Houses occupied by owners
96,044 (41.3%)
44,840 (56.4%)
Houses occupied by renters
136,318 (58.7%)
34,646 (43.6%)
Median rent asked for vacant for-rent units
$854.05
$1,161
Median monthly housing costs
$965
$1,010
Median price asked for vacant for-sale houses and condos
$172,751
$572,720
Estimated median house or condo value
$160,100
$206,200
Median numbers of rooms
4.9
5.5
Median number of rooms in apartments
4.3
4.3
Median number of rooms in houses and condos
5.7
6.6
Median house price - detached houses
$177,554
$207,641
Median house price - in 2-unit structures
$161,248
$208,452
Median house price - in 3-to-4-unit structures
$178,933
$296,091
Median house price - in 5 or more unit structures
$222,376
$241,999
Median house price - mobile homes
$67,466
$46,432
Median house price - Townhouses or other attached units
$171,473
$193,455
Median house price - All housing units
$176,965
$206,880
Median house age
68
67
Renting percentage
56.4%
44%
Housing density (houses/condos per square mile)
2,683.8
1,918.2
House value disparities
33%
26.2%
Household income disparities
46.1%
43.5%
Median household income for houses/condes with a mortgage
$72,490
$83,547
Median household income for apartments without a mortgage
$53,843
$57,895
Housing units without a mortgage
1,800 (2.8%)
614 (2%)
Housing units with both a second mortgage and home equity loan
3,918 (6.2%)
2,367 (7.8%)
Housing units with a mortgage
61,602 (97.2%)
29,818 (98%)
Housing units with a home equity loan
270 (0.4%)
16 (0.1%)
Housing units with a second mortgage
5,023 (7.9%)
2,696 (8.9%)
House/condo owner moved in on average (years ago)
13
10
House/condo renter moved in on average (years ago)
1
1
Housing units lacking complete kitchen facilities
4.5%
1.8%
Housing units lacking complete plumbing facilities
1.1%
0.2%
Housing units in structures
Housing units in structures
Milwaukee
Grand Rapids
One, detached
38.9%
58.1%
One, attached
4.5%
5.7%
Two
23.5%
9.1%
3 or 4
6.3%
4.5%
5 to 9
6.3%
3.5%
10 to 19
4.1%
4.8%
20 to 49
6.6%
3.4%
50 or more
9.5%
10.7%
Mobile homes
0.3%
0.2%
Boats, RVs, vans, etc.
0.0%
0.1%
Median real estate property taxes paid for housing units
Self-employed workers in own not incorporated business
10,069
4,150
State government workers
7,334
2,418
Unpaid family workers
199
130
Industries and Occupations
Milwaukee's economy is diversified, with major industry sectors including manufacturing, health care, and education. Grand Rapids has a vibrant health care industry, and it's a leading city in office furniture production.
Both cities have excellent healthcare facilities. Milwaukee's hospitals, including the Children's Hospital of Wisconsin and Froedtert Hospital, are nationally recognized. Grand Rapids has some of the top hospitals in Michigan, such as the Helen DeVos Children's Hospital and Spectrum Health Butterworth Hospital.
Health (county statistics)
Type
Milwaukee
Grand Rapids
General health status score of residents in this county from 1 (poor) to 5 (excellent)
Infrastructure can be seen as a strength for both cities. Milwaukee's robust infrastructure places it as a regional hub, while Grand Rapids' well-planned city layout and continued improvements make it attractive for growth. Both cities have international airports and robust public transit systems.
Infrastructure
Type
Milwaukee
Grand Rapids
Hospitals
29
12
TV stations
17
19
Arenas or stadiums
3
1
Bank branches located here
146
136
Bank institutions located here
29
20
Main business address for public companies
32
7
Drinking water stations with no reported violations in the past
24
48
Drinking water stations with reported violations in the past
HMDA - Conventional home purchase loans - Applications denied
Year
Milwaukee
Grand Rapids
1999
1,506
674
2000
1,666
843
2001
1,410
506
2002
1,157
380
2003
1,641
550
2004
2,251
855
2005
3,325
1,191
2006
4,218
1,253
2007
2,555
692
2008
719
291
2009
456
152
Culture and Food
Milwaukee and Grand Rapids both have vibrant art and food scenes. Milwaukee offers a mix of cultural activities, including a thriving music scene, art galleries, and food festivals. Grand Rapids, named "Beer City USA," has a bustling brewery scene. The city also holds the internationally recognized ArtPrize event.
Sports Teams
Sports are a big deal in both cities. Milwaukee has the MLB's Brewers, the NBA's Bucks, and the AHL's Admirals. Grand Rapids has minor league teams such as the West Michigan Whitecaps (baseball) and the Grand Rapids Griffins (hockey). They also have a strong local sports culture with high school and college sports.


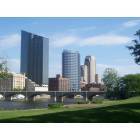


 Milwaukee, WI
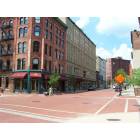
 Grand Rapids, MI