Milwaukee, Wisconsin, and Colorado Springs, Colorado, offer unique experiences whether as a place to live or a travel destination. The two cities contrast in climate, cost of living, education, and employment opportunities. With different tax systems and cultural infusions, relocation and tourism considerations offer a wide-ranging spectrum. The quality of infrastructure, public transit, and healthcare facilities also differ, making each city's allure distinct yet equally engaging.
Distance between
Milwaukee, WI and
Colorado Springs, CO : 923.0 miles
Milwaukee's population is larger by 18%. Its population has decreased by 27,644 people (4.6%) since 2000. The population of Colorado Springs has grown by 123,066 people (34.1%) during that time.
Comparing Milwaukee and Colorado Springs in terms of crime and safety, both cities have their own challenges. Milwaukee has a higher crime rate than the national average, while Colorado Springs has a rate closer to the national average. It's crucial to consider crime rates when deciding on neighborhoods to either visit or live. Safety is a cornerstone of a city's appeal, so make informed decisions based on the local information.
City-data.com crime index counts serious crimes and violent crime more heavily. It adjusts for the number of visitors and daily workers commuting into cities. (higher means more crime, U.S. average = 301.1)
City-data.com crime index counts serious crimes and violent crime more heavily. It adjusts for the number of visitors and daily workers commuting into cities. (higher means more crime, U.S. average = 301.1)
Sex Offenders
According to our data, there are 2,403 registered sex offenders living in Milwaukee and 1,683 registered sex offenders living in . The ratio of residents to sex offenders in Milwaukee is 248 to 1; the ratio in Colorado Springs is 276 to 1. The number of registered sex offenders compared to the number of residents in Milwaukee is near to than in Colorado Springs.
Cost of Living
In terms of cost of living, Colorado Springs is generally more expensive than Milwaukee. Everything from groceries, health care, housing, and utilities tends to be higher in the former. Yet, aspects such as dining out and clothing are relatively similar between the two cities.
Income Tax
Wisconsin's state income tax is more complex and typically higher than Colorado's, which utilizes a flat rate. Taxes are an important consideration when choosing a place to live or travel long-term.
Property Tax
Property taxes in Wisconsin are typically higher than in Colorado. It's critical to factor taxes into your budget when buying a home in either city.
Sales Tax
Wisconsin has a lower state sales tax at 5% compared to Colorado's 2.9%, although Colorado has additional local tax which can make it higher in some areas. Milwaukee residents have the added cost of a 0.6% county sales tax.
Income
Type
Milwaukee
Colorado Springs
Estimated median household income
$46,637
$74,579
Estimated per capita income
$26,998
$39,808
Cost of living index (U.S. average is 100)
97.5
99.6
If you make $50,000 in Milwaukee, you will have to make $51,077 in Colorado Springs to maintain the same standard of living.
Geographical Conditions
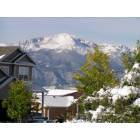
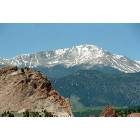
Milwaukee sits along Lake Michigan, while Colorado Springs is located at the eastern foot of the Rocky Mountains. Each possesses distinctive geographical attributes ideal for outdoor activities.
In terms of education, both cities have plenty of higher-education institutions. Colorado Springs is home to the United States Air Force Academy and Colorado College, while Milwaukee boasts Marquette University and the University of Wisconsin-Milwaukee. Quality education is a common attribute shared by these cities, making them ideal for students and families.
Milwaukee has a diversified economy with a focus on manufacturing, health care, and services, whereas Colorado Springs economy is primarily driven by the military, high-tech industry, and tourism. Job opportunities differ between the two, catering to different skill sets.
Biggest Employers
Some of Milwaukee's major employers include Aurora Health Care, Kohl's, and Harley-Davidson, while in Colorado Springs, notable employers include the United States Air Force and Lockheed Martin. Opportunities within these companies provide a robust employment scene in both areas.
In Milwaukee (Milwaukee County), 67.8% voted for Democrats and 31.6% for Republicans in 2012 Presidential Election. In Colorado Springs (El Paso County), 38.7% voted for Democrats and 59.2% for Republicans.
Elections
Type
Democrats
Republicans
Other
Year
Milwaukee
Colorado Springs
Milwaukee
Colorado Springs
Milwaukee
Colorado Springs
2020
69.3%
43.0%
29.4%
53.9%
1.3%
3.1%
2016
65.6%
34.1%
28.6%
56.6%
5.8%
9.4%
2012
67.8%
38.7%
31.6%
59.2%
0.5%
2.0%
2008
67.8%
40.0%
31.7%
58.9%
0.5%
1.1%
2004
62.0%
32.2%
37.5%
66.9%
0.5%
0.9%
2000
58.5%
30.9%
37.9%
64.1%
3.6%
5.0%
1996
58.3%
32.2%
32.2%
59.0%
9.5%
8.8%
Breakdown of population affiliated with a religious congregation
Type
Adherents
Congregations
Religion
Milwaukee
Colorado Springs
Milwaukee
Colorado Springs
CATHOLIC CHURCH
21.0%
8.4%
10.8%
5.4%
LUTHERAN CHURCH
3.0%
0.7%
5.9%
1.9%
EVANGELICAL LUTHERAN CHURCH IN AMERICA
2.4%
1.0%
6.7%
2.3%
WISCONSIN EVANGELICAL LUTHERAN SYNOD
2.2%
0.1%
6.0%
0.5%
SOUTHERN BAPTIST CONVENTION
1.3%
2.6%
4.3%
11.3%
MUSLIM ESTIMATE
1.0%
0.0%
1.1%
0.2%
AMERICAN BAPTIST CHURCHES IN THE USA
0.7%
0.3%
3.1%
1.2%
EPISCOPAL CHURCH
0.4%
0.4%
1.7%
1.6%
PRESBYTERIAN CHURCH IN AMERICA
0.0%
0.4%
0.1%
1.2%
Weather
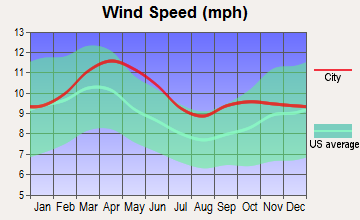
Weather-wise, the two cities are much different. Milwaukee is known for its long, chilly winters and short summers, while Colorado Springs has a semi-arid climate with mild and dry winters and a substantial amount of sunshine throughout the year. For residents and tourists alike, these contrasting climates offer distinctly different experiences across the year.
Weather and climate
Type
Milwaukee
Colorado Springs
Temperature - Average
48.1°F
43.4°F
Humidity - Average morning or afternoon humidity
77%
53.3%
Humidity - Differences between morning and afternoon humidity
26%
30%
Humidity - Maximum monthly morning or afternoon humidity
85%
64%
Humidity - Minimum monthly morning or afternoon humidity
59%
34%
Precipitation - Yearly average
33.3 in
18.6 in
Snowfall - Yearly average
95.8 in
77 in
Clouds - Number of days clear of clouds
14.9%
21.2%
Sunshine amount - Average
57.6%
82.2%
Sunshine amount - Differences during a year
34%
10.5%
Sunshine amount - Maximum monthly
69%
79.7%
Sunshine amount - Minimum monthly
35%
69.2%
Wind speed - Average
11 mph
10.3 mph
Average climate in Milwaukee, Wisconsin
Average climate in Colorado Springs, Colorado
Air pollution
Type
AQI
CO
NO2
OZONE
PB
PM10
PM25
SO2
Year
Milwaukee
Colorado Springs
Milwaukee
Colorado Springs
Milwaukee
Colorado Springs
Milwaukee
Milwaukee
Colorado Springs
Milwaukee
Colorado Springs
Milwaukee
Colorado Springs
Milwaukee
Colorado Springs
2018
84
60
N/A
N/A
8.8
N/A
28.2
N/A
N/A
N/A
15.3
N/A
7.8
6.3
0.2
N/A
2017
80
58
N/A
N/A
8.9
N/A
27.7
N/A
N/A
N/A
14.3
N/A
6.9
6.1
0.3
N/A
2016
86
48
N/A
N/A
9.4
N/A
27.0
N/A
N/A
N/A
15.0
N/A
7.4
6.9
1.2
N/A
2015
78
N/A
N/A
N/A
9.6
N/A
27.2
N/A
N/A
N/A
14.9
N/A
7.8
N/A
1.1
N/A
2014
89
N/A
N/A
N/A
9.9
N/A
26.0
N/A
N/A
N/A
15.4
N/A
9.2
N/A
1.0
N/A
2013
81
N/A
N/A
N/A
10.4
N/A
26.9
N/A
N/A
N/A
15.4
N/A
9.6
N/A
0.7
N/A
2012
108
N/A
N/A
N/A
11.5
N/A
28.3
N/A
N/A
N/A
17.2
N/A
9.6
N/A
1.0
N/A
2011
95
N/A
N/A
N/A
11.4
N/A
27.3
N/A
N/A
N/A
16.2
N/A
10.1
N/A
1.2
N/A
2010
83
N/A
N/A
N/A
12.9
N/A
26.9
N/A
N/A
N/A
N/A
N/A
N/A
N/A
N/A
N/A
2009
69
N/A
N/A
N/A
12.2
N/A
23.7
N/A
N/A
N/A
N/A
N/A
N/A
N/A
N/A
N/A
2008
61
N/A
N/A
N/A
12.4
N/A
24.6
N/A
N/A
N/A
17.3
N/A
N/A
N/A
N/A
N/A
2007
80
N/A
N/A
N/A
14.2
N/A
24.1
N/A
N/A
N/A
19.9
N/A
N/A
N/A
N/A
N/A
2006
66
15
0.35
0.50
14.7
N/A
22.8
N/A
0.017
0.005
19.9
N/A
N/A
N/A
2.6
N/A
2005
99
17
0.36
0.55
16.6
N/A
25.1
N/A
0.015
0.027
25.4
N/A
N/A
N/A
3.1
N/A
2004
75
17
0.41
0.56
16.6
N/A
21.2
N/A
0.011
0.010
21.4
N/A
N/A
N/A
3.3
N/A
2003
76
19
0.41
0.59
16.7
N/A
27.1
N/A
0.017
0.011
N/A
N/A
N/A
N/A
3.3
N/A
2002
92
24
0.40
0.66
N/A
N/A
28.9
N/A
0.018
0.010
N/A
N/A
N/A
N/A
3.7
N/A
2001
96
51
0.34
0.63
15.8
16.7
28.3
N/A
0.020
0.005
N/A
21.3
N/A
N/A
3.0
1.9
2000
84
78
0.29
0.58
16.5
22.5
27.0
N/A
0.018
0.010
N/A
21.0
N/A
N/A
3.4
2.3
Natural disasters
Type
Milwaukee
Colorado Springs
Tornado activity compared to U.S. average
118.1%
78.4%
Earthquake activity compared to U.S. average
109.3%
816.1%
Natural disasters compared to U.S. average
19%
17%
Transportation
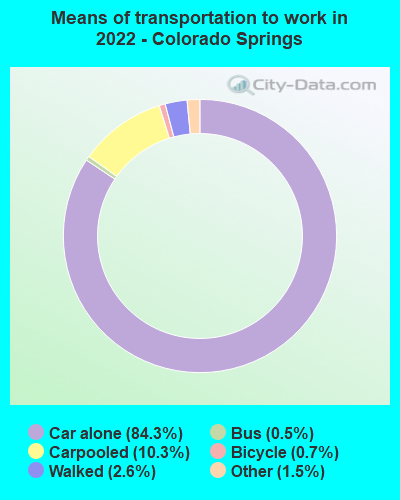
Public transportation in Milwaukee is primarily facilitated through the Milwaukee County Transit System. Colorado Springs uses Mountain Metro Transit. Both cities are bike-friendly, and travel by car is still dominant.
Transport
Type
Milwaukee
Colorado Springs
Amtrak stations
1
1
Amtrak stations nearby
1
1
FAA registered aircraft
202
552
FAA registered aircraft manufacturers and dealers
1
44
Means of transportation to work
Type
Milwaukee
Colorado Springs
Bicycle
0.5%
0.3%
Bus
4.2%
0.4%
Carpooled
8.4%
9.2%
Car alone
81.1%
87%
Motorcycle
0.1%
0.1%
Taxicab
0.2%
0.1%
Walked
3.9%
2.1%
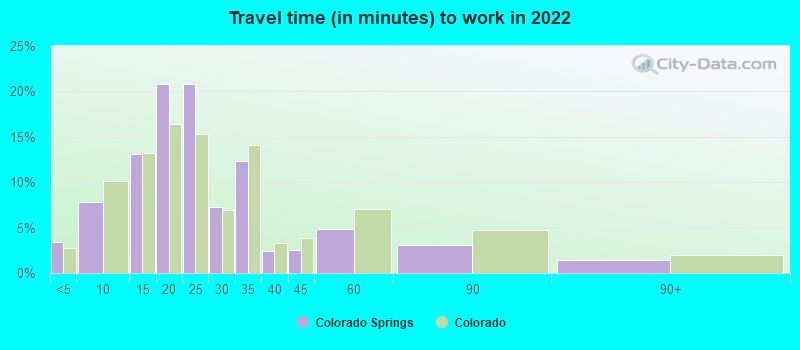
Average travel time to work
Type
Milwaukee
Colorado Springs
Average
24.2 min
23.8 min
Other means
21.1 min
21.3 min
Public transportation
40.3 min
39 min
Private vehicle occupancy
Type
Milwaukee
Colorado Springs
Average
1.2
1.1
Drove alone
88.7%
90%
In 2 person carpool
8.4%
7.5%
In 3 person carpool
1.6%
1.9%
In 4 person carpool
0.7%
0.2%
In 5-6 person carpool
0.4%
0.4%
In 7+ person carpool
0.1%
0.1%
How many people usually rode to work in the car, truck or van.
Real Estate
Real estate in Milwaukee is relatively more affordable than in Colorado Springs, although prices can vary based on the neighborhood and type of home. The housing market in both cities continues to grow, making them appealing for property investment.
Neighborhoods
Both cities offer a variety of neighborhoods to choose from, each with its unique charm. In Milwaukee, neighborhoods like the Historic Third Ward and Bay View are popular, while in Colorado Springs, Old North End and Broadmoor stand out.
Houses and residents
Type
Milwaukee
Colorado Springs
Houses
257,812
205,380
Average household size (people)
2.5
2.4
Median year apartment built
1956
1984
Median year house/condo built
1952
1987
Length of stay in the house since moving in
14.1 years
10.6 years
Houses occupied
232,362 (90.1%)
197,542 (96.2%)
Houses occupied by owners
96,044 (41.3%)
123,398 (62.5%)
Houses occupied by renters
136,318 (58.7%)
74,144 (37.5%)
Median rent asked for vacant for-rent units
$854.05
$1,458
Median monthly housing costs
$965
$1,422
Median price asked for vacant for-sale houses and condos
$172,751
$595,239
Estimated median house or condo value
$160,100
$390,500
Median numbers of rooms
4.9
6
Median number of rooms in apartments
4.3
4.1
Median number of rooms in houses and condos
5.7
7.2
Median house price - detached houses
$177,554
$427,641
Median house price - in 2-unit structures
$161,248
$389,381
Median house price - in 3-to-4-unit structures
$178,933
$295,560
Median house price - in 5 or more unit structures
$222,376
$258,564
Median house price - mobile homes
$67,466
$30,081
Median house price - Townhouses or other attached units
$171,473
$308,944
Median house price - All housing units
$176,965
$403,675
Median house age
68
35
Renting percentage
56.4%
39.9%
Housing density (houses/condos per square mile)
2,683.8
1,105.7
House value disparities
33%
25.2%
Household income disparities
46.1%
41%
Median household income for houses/condes with a mortgage
$72,490
$99,037
Median household income for apartments without a mortgage
$53,843
$72,581
Housing units without a mortgage
1,800 (2.8%)
1,835 (2.1%)
Housing units with both a second mortgage and home equity loan
3,918 (6.2%)
6,564 (7.3%)
Housing units with a mortgage
61,602 (97.2%)
87,580 (97.9%)
Housing units with a home equity loan
270 (0.4%)
86 (0.1%)
Housing units with a second mortgage
5,023 (7.9%)
7,898 (8.8%)
House/condo owner moved in on average (years ago)
13
7
House/condo renter moved in on average (years ago)
1
1
Housing units lacking complete kitchen facilities
4.5%
0.6%
Housing units lacking complete plumbing facilities
1.1%
0.3%
Housing units in structures
Housing units in structures
Milwaukee
Colorado Springs
One, detached
38.9%
62.3%
One, attached
4.5%
8.3%
Two
23.5%
1.4%
3 or 4
6.3%
4.7%
5 to 9
6.3%
4.9%
10 to 19
4.1%
6.7%
20 to 49
6.6%
6.1%
50 or more
9.5%
4.0%
Mobile homes
0.3%
1.7%
Median real estate property taxes paid for housing units
Self-employed workers in own not incorporated business
10,069
13,110
State government workers
7,334
7,029
Unpaid family workers
199
735
Industries and Occupations
As mentioned, Milwaukee's economy is based on manufacturing with top industries being beverage and food production, meanwhile, in Colorado Springs, the focus lies on military, high-tech industry, and outdoor tourism. These cities cater to an array of professions, constituting a diverse workforce.
Both cities boast robust healthcare. Milwaukee is home to the well-regarded Aurora Health Care while Colorado Springs hosts beloved Penrose-St. Francis Health Services.
Health (county statistics)
Type
Milwaukee
Colorado Springs
General health status score of residents in this county from 1 (poor) to 5 (excellent)
The infrastructure in both cities is well-developed but tailored to the local needs. Milwaukee's industrial heritage is evident in its buildings and factories, while Colorado Springs has a more outdoor-focused infrastructure with parks and recreational facilities to capitalize on its natural beauty.
Infrastructure
Type
Milwaukee
Colorado Springs
Hospitals
29
10
TV stations
17
18
Arenas or stadiums
3
3
Bank branches located here
146
133
Bank institutions located here
29
33
Main business address for public companies
32
6
Drinking water stations with no reported violations in the past
24
6
Drinking water stations with reported violations in the past
HMDA - Conventional home purchase loans - Applications denied
Year
Milwaukee
Colorado Springs
1999
1,506
1,957
2000
1,666
985
2001
1,410
756
2002
1,157
502
2003
1,641
1,131
2004
2,251
1,811
2005
3,325
2,631
2006
4,218
2,188
2007
2,555
1,246
2008
719
496
2009
456
233
Culture and Food
Milwaukee, famous for its beer and cheese traditions, has a lively brewing culture. Colorado Springs has a blossoming food scene influenced by southwestern cuisine. Both cities boast rich histories, adding layers to their charm.
Sports Teams
For sports lovers, Milwaukee offers Bucks (NBA) and Brewers (MLB) while in Colorado Springs, sports enthusiasts can enjoy minor league teams like the Sky Sox (minor league baseball) and Switchbacks FC (USL Championship).


 Milwaukee, WI
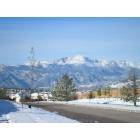
 Colorado Springs, CO