Milwaukee, Wisconsin, and Cincinnati, Ohio, two prominent Midwest cities, differ in various facets of living and tourism. This in-depth comparison explores how these two cities stand apart concerning crime/safety, weather, cost of living, education, work and economy, infrastructure, and many more areas. It particularly focuses on people considering relocating and tourists looking for a visit.
Distance between
Milwaukee, WI and
Cincinnati, OH : 324.8 miles
Milwaukee's population is larger by 84%. Its population has decreased by 27,644 people (4.6%) since 2000. The population of Cincinnati has decreased by 22,350 people (6.7%) during that time.
Milwaukee demonstrates a higher crime rate than the national average, like Cincinnati. Both cities show a more significant problem with violent crime than the national average, but Cincinnati's rate is slightly higher. Also important for residents and visitors, both cities have police departments committed to improving these figures and increasing overall safety.
City-data.com crime index counts serious crimes and violent crime more heavily. It adjusts for the number of visitors and daily workers commuting into cities. (higher means more crime, U.S. average = 301.1)
City-data.com crime index counts serious crimes and violent crime more heavily. It adjusts for the number of visitors and daily workers commuting into cities. (higher means more crime, U.S. average = 301.1)
Sex Offenders
According to our data, there are 2,403 registered sex offenders living in Milwaukee and 1,060 registered sex offenders living in . The ratio of residents to sex offenders in Milwaukee is 248 to 1; the ratio in Cincinnati is 282 to 1. The number of registered sex offenders compared to the number of residents in Milwaukee is near to than in Cincinnati.
Cost of Living
The cost of living in Milwaukee is slightly lower than in Cincinnati. Everyday expenses like groceries, housing, and utilities tend to cost less in Milwaukee than in Cincinnati. However, those relocating should also consider the cities' respective median household incomes, with Cincinnati having a slightly higher median income.
Income Tax
Wisconsin's income tax rate ranges from 4% to 7.65%. Ohio's state tax rate runs from 0% to 4.797% plus the local Cincinnati income tax of 2.1%. Depending on your income level, these differences could significantly impact your take-home pay.
Property Tax
Property taxes in Milwaukee tend to be higher than in Cincinnati. Milwaukee has a median property tax rate of 2.65% of a property's assessed fair market value, whereas Cincinnati's median is 1.67%. People considering home-ownership should factor these rates into their budgeting.
Sales Tax
The total sales tax rate in Milwaukee, Wisconsin, is 5.6%, lower than Cincinnati, Ohio's total rate of 7%. For folks looking to relocate or for regular shopping spree visitors, this difference in sales tax can mean substantial savings in the long run in Milwaukee.
Income
Type
Milwaukee
Cincinnati
Estimated median household income
$46,637
$42,733
Estimated per capita income
$26,998
$34,519
Cost of living index (U.S. average is 100)
97.5
89
If you make $50,000 in Cincinnati, you will have to make $54,775 in Milwaukee to maintain the same standard of living.
Geographical Conditions
Milwaukee sits along the western shores of Lake Michigan, offering beautiful views and opportunities for water-based activities like sailing and fishing. Cincinnati is set among rolling hills along the Ohio River. It features stunning river views and numerous parks, like the Cincinnati Zoo and Botanical Gardens, that take advantage of the city's natural beauty.
Regarding education, both cities have solid options. Cincinnati is home to the highly ranked University of Cincinnati and several top-rated public schools. Milwaukee boasts excellent educational institutions, including the University of Wisconsin-Milwaukee, and the Milwaukee School of Engineering recognized for its engineering programs.
Milwaukee and Cincinnati have strong economies based on diverse industries. Milwaukee is known for its manufacturing sector, specifically brewing and heavy machinery, while Cincinnati has a more diversified economy focusing on finance, management, and health services. Both cities have Fortune 500 companies adding to their economic stability, such as Procter & Gamble in Cincinnati and ManpowerGroup in Milwaukee.
Biggest Employers
In Milwaukee, the largest employers are healthcare providers like Aurora Health Care and Ascension Wisconsin, and manufacturers like Harley-Davidson. Cincinnati's biggest employers include Kroger Company, Procter & Gamble, and the University of Cincinnati.
There were 28 building permits issued in Milwaukee in 2012 (103 less than in 2011) compared to 206 building permits issued in Cincinnati in 2012 (122 more than in 2011).
In Milwaukee (Milwaukee County), 67.8% voted for Democrats and 31.6% for Republicans in 2012 Presidential Election. In Cincinnati (Hamilton County), 52.7% voted for Democrats and 46.4% for Republicans.
Elections
Type
Democrats
Republicans
Other
Year
Milwaukee
Cincinnati
Milwaukee
Cincinnati
Milwaukee
Cincinnati
2020
69.3%
57.2%
29.4%
41.3%
1.3%
1.5%
2016
65.6%
52.8%
28.6%
42.5%
5.8%
4.8%
2012
67.8%
52.7%
31.6%
46.4%
0.5%
0.9%
2008
67.8%
53.1%
31.7%
46.1%
0.5%
0.7%
2004
62.0%
47.3%
37.5%
52.7%
0.5%
0.0%
2000
58.5%
42.8%
37.9%
54.1%
3.6%
3.1%
1996
58.3%
43.1%
32.2%
50.1%
9.5%
6.8%
Breakdown of population affiliated with a religious congregation
Type
Adherents
Congregations
Religion
Milwaukee
Cincinnati
Milwaukee
Cincinnati
CATHOLIC CHURCH
21.0%
25.6%
10.8%
12.5%
LUTHERAN CHURCH
3.0%
0.3%
5.9%
1.5%
EVANGELICAL LUTHERAN CHURCH IN AMERICA
2.4%
0.6%
6.7%
1.8%
WISCONSIN EVANGELICAL LUTHERAN SYNOD
2.2%
0.1%
6.0%
0.2%
SOUTHERN BAPTIST CONVENTION
1.3%
1.2%
4.3%
6.5%
MUSLIM ESTIMATE
1.0%
0.2%
1.1%
0.6%
AMERICAN BAPTIST CHURCHES IN THE USA
0.7%
1.3%
3.1%
2.6%
EPISCOPAL CHURCH
0.4%
1.1%
1.7%
3.0%
VINEYARD USA
0.0%
1.8%
0.1%
1.1%
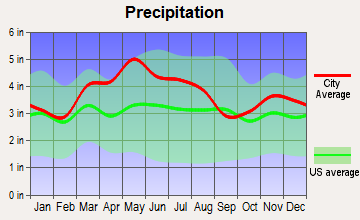
Weather
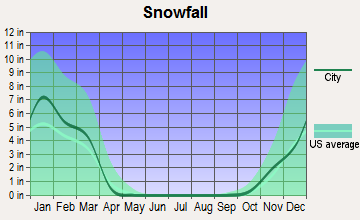
Milwaukee and Cincinnati experience the typical Midwestern climate: hot, humid summers and cold winters. However, Milwaukee on the shores of Lake Michigan, experiences more extreme temperatures, with colder winters and quieter, less humid summers than Cincinnati. Milwaukee also tends to have more snowfall, which can be a challenge for commuting, but a boon for winter sports enthusiasts.
Weather and climate
Type
Milwaukee
Cincinnati
Temperature - Average
48.1°F
52.9°F
Humidity - Average morning or afternoon humidity
77%
75.8%
Humidity - Differences between morning and afternoon humidity
26%
34%
Humidity - Maximum monthly morning or afternoon humidity
85%
87%
Humidity - Minimum monthly morning or afternoon humidity
59%
53%
Precipitation - Yearly average
33.3 in
45 in
Snowfall - Yearly average
95.8 in
47.6 in
Clouds - Number of days clear of clouds
14.9%
13.5%
Sunshine amount - Average
57.6%
57.8%
Sunshine amount - Differences during a year
34%
33.1%
Sunshine amount - Maximum monthly
69%
67%
Sunshine amount - Minimum monthly
35%
33.9%
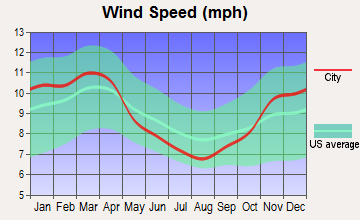
Wind speed - Average
11 mph
9 mph
Average climate in Milwaukee, Wisconsin
Average climate in Cincinnati, Ohio
Air pollution
Type
AQI
CO
NO2
OZONE
PB
PM10
PM25
SO2
Year
Milwaukee
Cincinnati
Milwaukee
Cincinnati
Milwaukee
Cincinnati
Milwaukee
Cincinnati
Milwaukee
Milwaukee
Cincinnati
Milwaukee
Cincinnati
Milwaukee
Cincinnati
2018
84
87
N/A
0.20
8.8
9.6
28.2
27.8
N/A
N/A
15.3
18.3
7.8
10.5
0.2
0.8
2017
80
81
N/A
0.23
8.9
8.5
27.7
29.2
N/A
N/A
14.3
18.8
6.9
9.2
0.3
1.1
2016
86
88
N/A
0.24
9.4
9.4
27.0
28.4
N/A
N/A
15.0
21.2
7.4
8.4
1.2
1.1
2015
78
91
N/A
0.26
9.6
11.0
27.2
26.4
N/A
N/A
14.9
21.5
7.8
9.5
1.1
1.5
2014
89
89
N/A
0.24
9.9
11.4
26.0
27.3
N/A
N/A
15.4
19.5
9.2
12.0
1.0
2.0
2013
81
92
N/A
0.24
10.4
11.5
26.9
27.0
N/A
N/A
15.4
22.9
9.6
11.9
0.7
2.6
2012
108
97
N/A
0.26
11.5
4.8
28.3
27.6
N/A
N/A
17.2
23.4
9.6
13.6
1.0
3.4
2011
95
102
N/A
0.26
11.4
12.9
27.3
28.1
N/A
N/A
16.2
22.1
10.1
13.1
1.2
4.0
2010
83
113
N/A
N/A
12.9
14.7
26.9
29.7
N/A
N/A
N/A
26.6
N/A
18.7
N/A
3.7
2009
69
77
N/A
N/A
12.2
14.4
23.7
25.6
N/A
N/A
N/A
22.6
N/A
8.2
N/A
2.2
2008
61
85
N/A
N/A
12.4
16.0
24.6
26.5
N/A
N/A
17.3
N/A
N/A
9.4
N/A
3.0
2007
80
100
N/A
N/A
14.2
17.1
24.1
30.2
N/A
N/A
19.9
N/A
N/A
12.7
N/A
4.0
2006
66
83
0.35
N/A
14.7
18.0
22.8
29.3
0.017
N/A
19.9
21.9
N/A
N/A
2.6
4.2
2005
99
110
0.36
0.49
16.6
20.6
25.1
30.9
0.015
N/A
25.4
N/A
N/A
N/A
3.1
5.6
2004
75
91
0.41
0.36
16.6
18.7
21.2
27.7
0.011
N/A
21.4
N/A
N/A
N/A
3.3
5.5
2003
76
86
0.41
0.33
16.7
21.9
27.1
27.6
0.017
N/A
N/A
N/A
N/A
N/A
3.3
4.9
2002
92
98
0.40
0.32
N/A
21.4
28.9
29.4
0.018
N/A
N/A
20.0
N/A
N/A
3.7
4.5
2001
96
102
0.34
0.41
15.8
21.4
28.3
29.4
0.020
N/A
N/A
22.9
N/A
N/A
3.0
5.0
2000
84
104
0.29
0.40
16.5
22.1
27.0
28.0
0.018
N/A
N/A
N/A
N/A
N/A
3.4
6.3
Natural disasters
Type
Milwaukee
Cincinnati
Tornado activity compared to U.S. average
118.1%
166.3%
Earthquake activity compared to U.S. average
109.3%
148.2%
Natural disasters compared to U.S. average
19%
15%
Transportation
While both cities offer public transportation options, Cincinnati recently launched the Cincinnati Bell Connector, a modern streetcar system connecting the city's riverfront at The Banks with Downtown and Over-The-Rhine. Milwaukee's transportation system has been recognized for its convenience and frequency of bus service; however, Cincinnati’s growing efforts to expand cycling infrastructure provides an additional commuting option.
Transport
Type
Milwaukee
Cincinnati
Amtrak stations
1
1
Amtrak stations nearby
1
2
FAA registered aircraft
202
454
FAA registered aircraft manufacturers and dealers
1
16
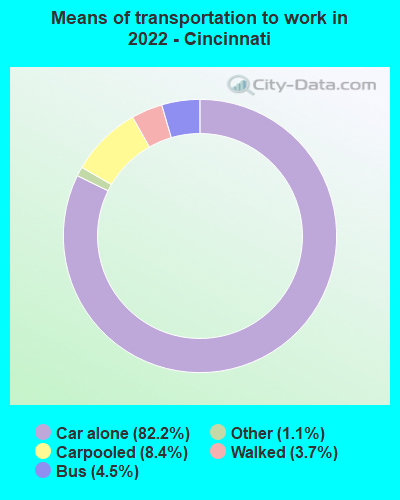
Means of transportation to work
Type
Milwaukee
Cincinnati
Bicycle
0.5%
0.3%
Bus
4.2%
3.2%
Carpooled
8.4%
7.2%
Car alone
81.1%
84.7%
Taxicab
0.2%
0.3%
Walked
3.9%
3.4%
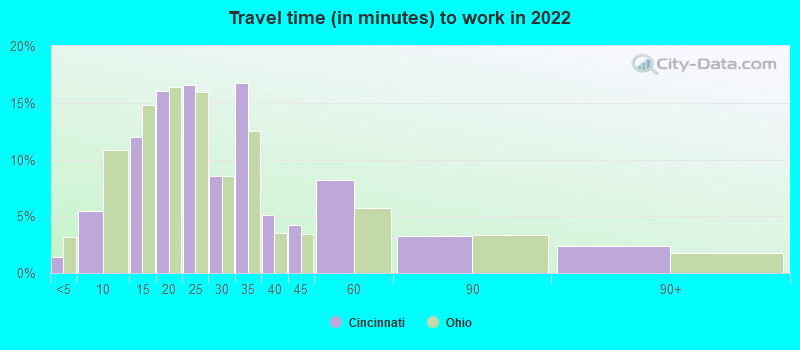
Average travel time to work
Type
Milwaukee
Cincinnati
Average
24.2 min
26.9 min
Other means
21.1 min
21.8 min
Public transportation
40.3 min
38 min
Private vehicle occupancy
Type
Milwaukee
Cincinnati
Average
1.2
1.1
Drove alone
88.7%
89.6%
In 2 person carpool
8.4%
8.6%
In 3 person carpool
1.6%
1%
In 4 person carpool
0.7%
0.6%
In 5-6 person carpool
0.4%
0.2%
In 7+ person carpool
0.1%
0%
How many people usually rode to work in the car, truck or van.
Real Estate
Real estate is more affordable in Milwaukee, with lower median home prices compared to Cincinnati. Rental prices also tend to be lower in Milwaukee. For investors, this indicates a favorable market for affordable property in Milwaukee, but Cincinnati offers a more competitive real estate market, which could represent higher potential returns.
Neighborhoods
Both Milwaukee and Cincinnati boast beautiful neighborhoods. In Milwaukee, the Historic Third Ward is known for its shopping, dining, and art galleries. Bay View offers a vibrant dining scene and picturesque views of Lake Michigan. Cincinnati's Over-the-Rhine neighborhood is beloved for its historic architecture, trendy restaurants, and Findlay Market, one of the country's oldest public markets.
Houses and residents
Type
Milwaukee
Cincinnati
Houses
257,812
160,420
Average household size (people)
2.5
2.1
Median year apartment built
1956
1961
Length of stay in the house since moving in
14.1 years
13.7 years
Houses occupied
232,362 (90.1%)
144,929 (90.3%)
Houses occupied by owners
96,044 (41.3%)
55,411 (38.2%)
Houses occupied by renters
136,318 (58.7%)
89,518 (61.8%)
Median rent asked for vacant for-rent units
$854.05
$823.02
Median monthly housing costs
$965
$918
Median price asked for vacant for-sale houses and condos
$172,751
$55,446
Estimated median house or condo value
$160,100
$190,300
Median numbers of rooms
4.9
4.6
Median number of rooms in apartments
4.3
3.7
Median number of rooms in houses and condos
5.7
6.5
Median house price - detached houses
$177,554
$271,565
Median house price - in 2-unit structures
$161,248
$236,559
Median house price - in 3-to-4-unit structures
$178,933
$378,023
Median house price - in 5 or more unit structures
$222,376
$288,600
Median house price - mobile homes
$67,466
$76,176
Median house price - Townhouses or other attached units
$171,473
$269,604
Median house price - All housing units
$176,965
$273,493
Median house age
68
70
Renting percentage
56.4%
61.1%
Housing density (houses/condos per square mile)
2,683.8
2,057.5
House value disparities
33%
42.9%
Household income disparities
46.1%
51.8%
Median household income for houses/condes with a mortgage
$72,490
$87,346
Median household income for apartments without a mortgage
$53,843
$63,683
Housing units without a mortgage
1,800 (2.8%)
1,063 (2.8%)
Housing units with both a second mortgage and home equity loan
3,918 (6.2%)
2,466 (6.5%)
Housing units with a mortgage
61,602 (97.2%)
36,710 (97.2%)
Housing units with a home equity loan
270 (0.4%)
116 (0.3%)
Housing units with a second mortgage
5,023 (7.9%)
3,803 (10.1%)
House/condo owner moved in on average (years ago)
13
11
House/condo renter moved in on average (years ago)
1
1
Housing units lacking complete kitchen facilities
4.5%
2.4%
Housing units lacking complete plumbing facilities
1.1%
1.5%
Housing units in structures
Housing units in structures
Milwaukee
Cincinnati
One, detached
38.9%
36.6%
One, attached
4.5%
4.9%
Two
23.5%
7.5%
3 or 4
6.3%
12.0%
5 to 9
6.3%
8.8%
10 to 19
4.1%
10.0%
20 to 49
6.6%
6.7%
50 or more
9.5%
13.2%
Mobile homes
0.3%
0.3%
Median real estate property taxes paid for housing units
Self-employed workers in own not incorporated business
10,069
6,809
State government workers
7,334
4,546
Unpaid family workers
199
42
Industries and Occupations
Milwaukee's job market is dominated by the manufacturing industry, including major breweries and heavy machinery companies. Cincinnati has a diversified job market with strong representation from professional and business services, education and health services, and the trade, transportation, and utilities sector. The top occupations in Cincinnati are in management, while in Milwaukee, production occupations prevail.
Milwaukee offers excellent health care with facilities like the Froedtert Hospital and the Children's Hospital of Wisconsin highly ranked regionally. Cincinnati is also well regarded for health care, boasting the nationally recognized Cincinnati Children's Hospital Medical Center and the University of Cincinnati Medical Center.
Health (county statistics)
Type
Milwaukee
Cincinnati
General health status score of residents in this county from 1 (poor) to 5 (excellent)
Several infrastructure projects are underway or planned in both cities. Milwaukee has been improving its roads, bridges, and public transportation networks, while Cincinnati has been focusing on infrastructure that promotes walkability and cycling. Cincinnati also has recently renovated its riverfront area into a thriving destination known as The Banks.
Infrastructure
Type
Milwaukee
Cincinnati
Hospitals
29
46
TV stations
17
16
Arenas or stadiums
3
6
Bank branches located here
146
289
Bank institutions located here
29
35
Main business address for public companies
32
30
Drinking water stations with no reported violations in the past
24
2
Drinking water stations with reported violations in the past
HMDA - Conventional home purchase loans - Applications denied
Year
Milwaukee
Cincinnati
1999
1,506
1,027
2000
1,666
1,294
2001
1,410
1,046
2002
1,157
978
2003
1,641
1,051
2004
2,251
1,275
2005
3,325
1,694
2006
4,218
1,584
2007
2,555
991
2008
719
436
2009
456
279
Culture and Food
Autentic, cultural experiences are abundant in both cities. Milwaukee's German heritage is reflected in its many beer gardens and festivals like Oktoberfest. Furthermore, its food scene includes famous dairy products, like Wisconsin cheese and frozen custards. Cincinnati boasts a unique chili style, served over spaghetti, and Goetta, a German-American breakfast staple. Music and art festivals, like the Cincinnati Music Festival and BLINK Cincinnati, also regularly take place.
Sports Teams
Sports fans will find much to love in both cities. Milwaukee boasts the Milwaukee Bucks (NBA) and the Milwaukee Brewers (MLB), while Cincinnati is home to the Cincinnati Bengals (NFL) and Cincinnati Reds (MLB). Both cities also have passionate college fan bases, with the University of Cincinnati Bearcats and the University of Wisconsin-Milwaukee Panthers.


 Milwaukee, WI
 Cincinnati, OH