When comparing living in Metropolitan Government, TN, and Toledo, OH, there are various factors to be considered. Both locations offer distinctive qualities that make them uniquely desirable. Each city has its own charm, industries, and cultural experiences. Apart from cultural differences, other factors such as crime rate, cost of living, education system, work opportunities, and infrastructure also play critical roles in the decision-making process of individuals who wish to relocate or visit as tourists.
While no city is immune to crime, Toledo, OH, tends to have higher crime rates compared to the national average, which may affect perceptions of safety. On the other hand, Metropolitan Government, TN, has lower crime rates. However, safety perceptions can vary by neighborhood and personal experience. Tourists are advised to stay alert and stick to recommended tourist areas in both cities.
Cost of Living
The cost of living in Toledo, OH, is significantly lower than the US average. Housing, in particular, is quite affordable, making it a great location for families to settle down. On the contrary, the cost of living in Metropolitan Government, TN, is slightly above the national average, mainly driven by housing costs.
Income Tax
While Toledo, OH, residents have to pay a local and state income tax, Tennessee does not charge a state or local income tax.
Property Tax
Property taxes are higher in Metropolitan Government, TN, compared to Toledo, OH, reflecting the value of property and housing demand in these cities.
Sales Tax
Ohio has lower sales tax than Tennessee. Toledo, OH, has a City Sales tax of 7.25%, while Metropolitan Government, TN, has a total sales tax rate of 9.75%.
Income
Type
Metropolitan Government
Toledo
Estimated median household income
$65,348
$44,150
Estimated per capita income
$43,994
$25,641
Cost of living index (U.S. average is 100)
97.9
91.8
If you make $50,000 in Toledo, you will have to make $53,322 in Metropolitan Government to maintain the same standard of living.
Geographical Conditions
Toledo, OH, located in the Great Lakes region, provides beautiful lake views and enjoying water activities. Metropolitan Government, TN, on the Cumberland River, offers beautiful riverfront views and lovely rolling hills.
Geographical information
Type
Metropolitan Government
Toledo
Land area
502.3 sq. miles
80.6 sq. miles
Population density
1,236.2 people per sq. mile
3,330.4 people per sq. mile
Relative area comparison
Metropolitan Government, TN Toledo, OH
Education
Both locations offer high-quality education. Toledo boasts a healthy mix of public and private schools and a strong charter school movement. However, Metropolitan Government, TN, is home to renowned universities such as Vanderbilt University and Tennessee State University, providing excellent higher education opportunities.
The economy in both cities is diverse, yet Toledo, OH, leans more towards manufacturing, while Metropolitan Government, TN, is known for healthcare services, music, and entertainment. Both cities offer ample opportunities for job seekers and investors.
Biggest Employers
Some of the largest employers in Toledo include Promedica Health Systems, University of Toledo, and Jeep. In Metropolitan Government, TN, top employers include Vanderbilt University Medical Center, HCA Healthcare, and Nissan North America.
In Metropolitan Government (Davidson County), 58.5% voted for Democrats and 39.9% for Republicans in 2012 Presidential Election. In Toledo (Lucas County), 65.2% voted for Democrats and 33.4% for Republicans.
Elections
Type
Democrats
Republicans
Other
Year
Metropolitan Government
Toledo
Metropolitan Government
Toledo
Metropolitan Government
Toledo
2020
65.0%
57.5%
32.6%
40.8%
2.3%
1.7%
2016
60.1%
55.9%
34.1%
38.2%
5.7%
5.9%
2012
58.5%
65.2%
39.9%
33.4%
1.6%
1.4%
2008
60.0%
65.1%
39.0%
33.6%
1.0%
1.4%
2004
54.9%
60.4%
44.6%
39.6%
0.4%
0.0%
2000
57.9%
57.9%
40.4%
39.2%
1.7%
2.8%
1996
79.3%
57.7%
18.1%
32.0%
2.6%
10.3%
Breakdown of population affiliated with a religious congregation
Type
Adherents
Congregations
Religion
Metropolitan Government
Toledo
Metropolitan Government
Toledo
SOUTHERN BAPTIST CONVENTION
14.1%
0.3%
19.6%
3.5%
CATHOLIC CHURCH
4.9%
20.9%
2.3%
9.4%
EPISCOPAL CHURCH
1.5%
0.5%
1.8%
2.2%
SEVENTH DAY ADVENTIST CHURCH
1.1%
0.2%
1.7%
0.5%
COPTIC ORTHODOX CHURCH
1.0%
0.0%
0.5%
0.3%
MUSLIM ESTIMATE
0.8%
0.4%
1.4%
0.8%
PRESBYTERIAN CHURCH IN AMERICA
0.8%
0.0%
0.9%
0.3%
CUMBERLAND PRESBYTERIAN CHURCH
0.4%
0.0%
1.3%
0.0%
LUTHERAN CHURCH
0.3%
0.7%
0.9%
2.7%
EVANGELICAL LUTHERAN CHURCH IN AMERICA
0.2%
4.1%
0.8%
9.1%
AMERICAN BAPTIST CHURCHES IN THE USA
0.1%
0.5%
0.3%
3.2%
NATIONA ASSOCIA CONGREG CHRISTIAN CHURCHES
0.0%
0.3%
0.0%
1.3%
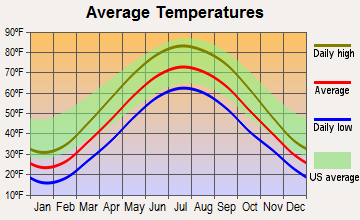
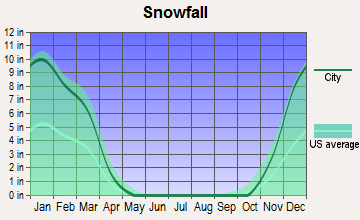
Weather
Weather-wise, Toledo, OH, experiences a traditional Midwest climate with cold winters and warm summers. Those who enjoy a white Christmas and don't mind bundling up could appreciate Toledo. Metropolitan Government, TN, known as Nashville, enjoys a more moderate climate with mild winters and hot, humid summers.
Weather and climate
Type
Metropolitan Government
Toledo
Temperature - Average
58.4°F
49.2°F
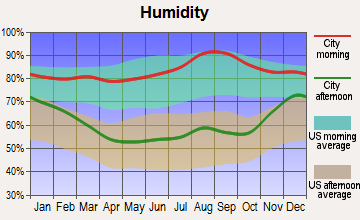
Humidity - Average morning or afternoon humidity
75.9%
76.9%
Humidity - Differences between morning and afternoon humidity
38%
37%
Humidity - Maximum monthly morning or afternoon humidity
89%
89%
Humidity - Minimum monthly morning or afternoon humidity
51%
52%
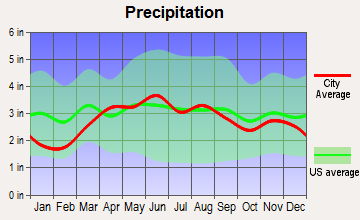
Precipitation - Yearly average
49 in
33.3 in
Snowfall - Yearly average
17.8 in
75.3 in
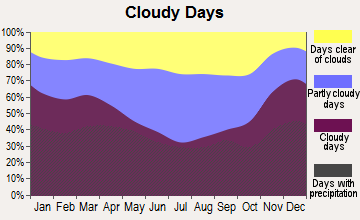
Clouds - Number of days clear of clouds
17.1%
12.3%
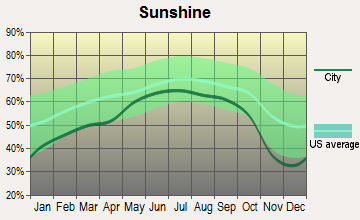
Sunshine amount - Average
59.7%
55.1%
Sunshine amount - Differences during a year
23%
36%
Sunshine amount - Maximum monthly
65%
65%
Sunshine amount - Minimum monthly
42%
29%
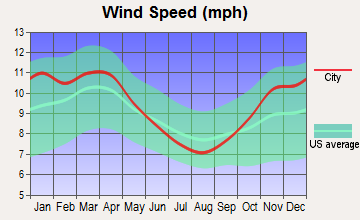
Wind speed - Average
7.7 mph
9.4 mph
Average climate in Metropolitan Government, Tennessee
Average climate in Toledo, Ohio
Air pollution
Type
AQI
CO
NO2
OZONE
PB
PM10
PM25
SO2
Year
Metropolitan Government
Toledo
Metropolitan Government
Metropolitan Government
Metropolitan Government
Toledo
Metropolitan Government
Metropolitan Government
Toledo
Metropolitan Government
Metropolitan Government
Toledo
2018
71
47
0.40
N/A
13.8
N/A
24.1
30.1
N/A
N/A
15.2
N/A
9.2
N/A
0.2
0.7
2017
70
45
0.38
N/A
14.4
N/A
26.8
29.0
N/A
N/A
15.3
N/A
8.7
N/A
0.1
0.4
2016
90
50
0.42
N/A
16.1
N/A
26.4
29.9
N/A
N/A
N/A
N/A
10.1
N/A
0.0
0.5
2015
68
45
0.43
N/A
15.5
N/A
23.6
28.7
N/A
N/A
N/A
N/A
10.8
N/A
0.1
0.9
2014
66
50
N/A
N/A
N/A
N/A
26.3
28.8
N/A
N/A
N/A
N/A
9.8
N/A
1.4
1.7
2013
62
40
N/A
N/A
N/A
N/A
N/A
25.2
N/A
N/A
N/A
N/A
9.7
N/A
N/A
1.0
2012
81
84
N/A
N/A
N/A
N/A
28.3
30.6
N/A
N/A
N/A
23.5
11.0
N/A
2.3
N/A
2011
81
65
N/A
N/A
N/A
N/A
25.9
25.7
N/A
N/A
N/A
21.0
11.0
N/A
1.7
N/A
2010
80
69
N/A
N/A
N/A
N/A
24.3
27.2
N/A
N/A
N/A
24.6
12.2
N/A
2.2
N/A
2009
72
64
N/A
N/A
N/A
N/A
22.5
25.4
N/A
N/A
N/A
21.4
11.5
N/A
2.4
N/A
2008
81
68
N/A
N/A
N/A
N/A
25.7
26.8
N/A
N/A
N/A
21.6
13.4
N/A
2.5
N/A
2007
99
86
N/A
N/A
N/A
N/A
27.4
25.9
N/A
N/A
N/A
24.2
15.5
N/A
2.7
3.8
2006
93
70
0.69
N/A
N/A
N/A
24.9
24.7
N/A
N/A
N/A
22.8
14.9
N/A
2.9
3.7
2005
104
84
0.56
N/A
N/A
N/A
23.5
27.8
N/A
N/A
N/A
21.6
16.9
N/A
3.1
5.1
2004
83
67
0.61
N/A
N/A
N/A
22.0
23.6
0.006
N/A
N/A
19.2
N/A
N/A
2.6
5.6
2003
93
77
0.67
N/A
N/A
N/A
18.5
26.0
0.005
N/A
N/A
18.5
15.8
N/A
3.8
6.5
2002
92
85
0.68
N/A
N/A
N/A
20.2
27.5
N/A
N/A
N/A
23.5
15.3
N/A
4.3
5.7
2001
95
76
0.90
N/A
N/A
N/A
19.5
26.9
N/A
N/A
N/A
23.4
15.6
N/A
4.5
5.3
2000
97
64
0.75
N/A
N/A
N/A
19.8
24.0
N/A
N/A
N/A
23.4
N/A
N/A
4.1
4.2
Natural disasters
Type
Metropolitan Government
Toledo
Tornado activity compared to U.S. average
169%
144.4%
Earthquake activity compared to U.S. average
296.3%
67.7%
Natural disasters compared to U.S. average
17%
13%
Transportation
Both cities offer public transportation, with Toledo focusing on buses and Metropolitan Government, TN, providing buses and commuter train service. Traffic is less congested in Toledo than in Metropolitan Government, TN.
Transport
Type
Metropolitan Government
Toledo
Amtrak stations
0
1
Amtrak stations nearby
1
1
FAA registered aircraft
0
102
FAA registered aircraft manufacturers and dealers
0
7
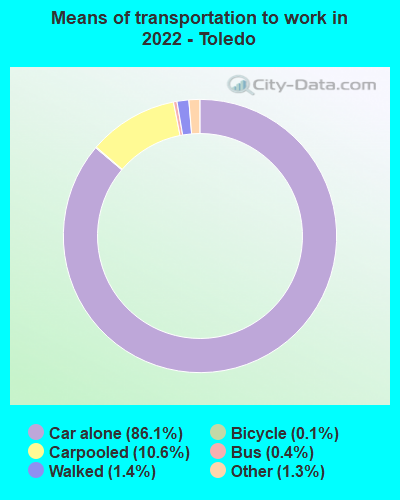
Means of transportation to work
Type
Metropolitan Government
Toledo
Bicycle
0.1%
0.2%
Bus
1.6%
1.1%
Carpooled
13.3%
9.2%
Car alone
78.6%
85.7%
Taxicab
0.1%
0.2%
Walked
2.3%
2.2%
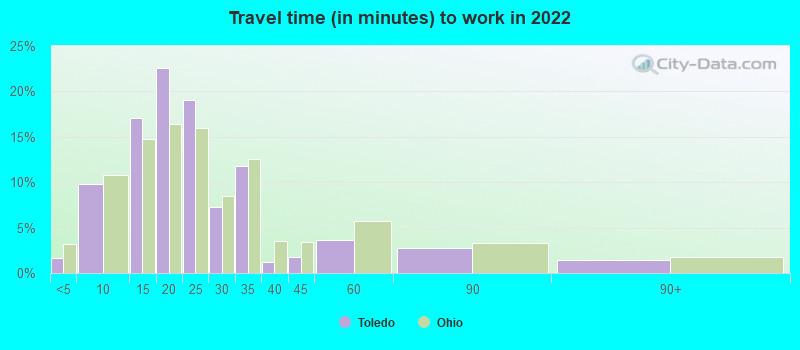
Average travel time to work
Type
Metropolitan Government
Toledo
Average
23.7 min
22.9 min
Real Estate
In Toledo, OH, real-estate is quite affordable, offering an attractive option for first-time homebuyers. In Metropolitan Government, TN, the real-estate market is competitive and pricier but guarantees a good return on investment due to the city's growing popularity.
Neighborhoods
Toledo is known for its family-friendly neighborhoods like Ottawa Hills and Perrysburg. Metropolitan Government, TN, has trendy areas like East Nashville and historic districts like Germantown, catering to a wide variety of residents.
Houses and residents
Type
Metropolitan Government
Toledo
Houses
252,977
133,129
Average household size (people)
2.3
2.3
Houses occupied
237,405 (93.8%)
120,895 (90.8%)
Houses occupied by owners
131,384 (55.3%)
67,831 (56.1%)
Houses occupied by renters
106,021 (44.7%)
53,064 (43.9%)
Median rent asked for vacant for-rent units
$1,207
$666.64
Median price asked for vacant for-sale houses and condos
$226,967
$77,176
Estimated median house or condo value
$350,700
$100,100
Median number of rooms in apartments
4.2
4.5
Median number of rooms in houses and condos
6.4
6.4
Housing density (houses/condos per square mile)
503.7
1,651.3
Household income disparities
45.5%
45.1%
Housing units without a mortgage
32,597 (28.1%)
1,756 (4.5%)
Housing units with both a second mortgage and home equity loan
342 (0.3%)
2,444 (6.2%)
Housing units with a mortgage
83,416 (71.9%)
37,635 (95.5%)
Housing units with a home equity loan
8,009 (6.9%)
70 (0.2%)
Housing units with a second mortgage
9,691 (8.4%)
3,377 (8.6%)
Housing units lacking complete kitchen facilities
0.7%
4.1%
Housing units lacking complete plumbing facilities
Self-employed workers in own not incorporated business
20,090
5,059
State government workers
13,081
3,238
Unpaid family workers
668
91
Industries and Occupations
In Toledo, OH, manufacturing, healthcare, and education are some of the most prevalent industries. In contrast, Metropolitan Government, TN, being the country music capital, has a significant entertainment industry alongside healthcare.
Toledo is home to ProMedica Toledo Hospital, which is nationally recognized. Metropolitan Government, TN, houses some of the top healthcare providers in the nation, including Vanderbilt University Medical Center.
Health (county statistics)
Type
Metropolitan Government
Toledo
General health status score of residents in this county from 1 (poor) to 5 (excellent)
When it comes to infrastructure, both cities are quite developed, offering reliable utility services, maintained roadways, and constant infrastructure development. Metropolitan Government, TN, stands out with its substantial live music infrastructure.
Infrastructure
Type
Metropolitan Government
Toledo
TV stations
19
12
Culture and Food
Toledo boasts a diverse food scene, hosting many ethnic food festivals. Metropolitan Government, TN, is famous for its music culture, particularly country music, and Southern cuisine.
Sports Teams
Toledo is home to minor league teams like the Toledo Mud Hens (baseball) and Toledo Walleye (hockey). Metropolitan Government, TN, hosts major league teams such as the Tennessee Titans (NFL) and Nashville Predators (NHL).
 Metropolitan Government, TN
 Toledo, OH