When comparing the Metropolitan Government of Nashville & Davidson County, also known as Metro Nashville or simply Nashville, TN, and Staten Island, NY, distinctions can be found in terms of cost of living, crime rates, education, work and economy, as well as culture. Nashville is known for its music history and vibrant nightlife, while Staten Island offers a quieter residential feel, with the advantage of proximity to the bustling city of New York. This comparison will also take into account other important relocation factors including weather, quality of healthcare, taxes, and transportation among others.
Nashville and Staten Island differ significantly in terms of safety and crime rates. Nashville has a somewhat higher crime rate, particularly in terms of property crime, compared to the national average. Although efforts are being put into improving safety, it's something relocators and tourists should be aware of. On the other hand, Staten Island, while not devoid of crime, tends to be quieter and safer than many other NYC boroughs, with crime rates below the national average.
Cost of Living
When it comes to cost of living, Nashville is generally more affordable than Staten Island. Housing is a significant factor in this respect, with median home prices and rent costs being noticeably lower in Nashville. In terms of groceries, healthcare, and transportation, Nashville maintains its edge in affordability, making it a more economical choice for those considering relocation.
Income Tax
Tennessee does not impose a state income tax, which can result in significant savings for residents. New York, on the other hand, has a progressive income tax system, and residents of Staten Island are subject to this tax.
Property Tax
The property tax rate in Nashville is relatively high when compared to the rest of the country. In contrast, Staten Island has lower property tax rates compared to the rest of NYC, but still higher than in Nashville due to the higher property values.
Sales Tax
Tennessee has one of the highest sales tax rates in the U.S. at 9.53%, which includes both state and local sales taxes. New York sales tax is about 8.875% which applies to Staten Island as well.
Income
Type
Metropolitan Government
Staten Island
Estimated median household income
$65,348
$86,054
Estimated per capita income
$43,994
$38,678
Cost of living index (U.S. average is 100)
97.9
164.1
If you make $50,000 in Metropolitan Government, you will have to make $83,810 in Staten Island to maintain the same standard of living.
Geographical Conditions
Nashville is located in the hills of Tennessee, offering beautiful landscapes, while Staten Island is the most suburban borough in NYC, known for its parks and historic sites.
Geographical information
Type
Metropolitan Government
Staten Island
Land area
502.3 sq. miles
58.5 sq. miles
Population density
1,236.2 people per sq. mile
8,225.7 people per sq. mile
Relative area comparison
Metropolitan Government, TN Staten Island, NY
Education
Both Nashville and Staten Island have quality public school systems. Nashville is home to highly-rated public schools, as well as prestigious universities, such as Vanderbilt University. Staten Island also offers strong educational opportunities, with well-regarded public and private schools and easy access to the many universities located throughout New York City.
Nashville's economy thrives on sectors like healthcare, education, and music production. It also boasts a low unemployment rate. In contrast, Staten Island's economy heavily relies on healthcare, retail trade, and educational services. Its proximity to Manhattan presents abundant job opportunities in diverse fields.
Biggest Employers
In Nashville, some of the biggest employers include the Vanderbilt University and Medical Center, the state government, and the Nashville Metro government. For Staten Island, top employers are in the healthcare sector, including Richmond University Medical Center and Staten Island University Hospital. There are also plenty of job opportunities within commuting distance in NYC.
In Metropolitan Government (Davidson County), 58.5% voted for Democrats and 39.9% for Republicans in 2012 Presidential Election. In Staten Island (Richmond County), 50.8% voted for Democrats and 48.3% for Republicans.
Elections
Type
Democrats
Republicans
Other
Year
Metropolitan Government
Staten Island
Metropolitan Government
Staten Island
Metropolitan Government
Staten Island
2020
65.0%
42.2%
32.6%
57.1%
2.3%
0.7%
2016
60.1%
41.0%
34.1%
56.1%
5.7%
2.9%
2012
58.5%
50.8%
39.9%
48.3%
1.6%
0.9%
2008
60.0%
47.8%
39.0%
51.9%
1.0%
0.4%
2004
54.9%
42.8%
44.6%
56.5%
0.4%
0.7%
2000
57.9%
52.1%
40.4%
45.1%
1.7%
2.9%
1996
79.3%
50.5%
18.1%
40.8%
2.6%
8.7%
Breakdown of population affiliated with a religious congregation
Type
Adherents
Congregations
Religion
Metropolitan Government
Staten Island
Metropolitan Government
Staten Island
SOUTHERN BAPTIST CONVENTION
14.1%
0.2%
19.6%
3.5%
CATHOLIC CHURCH
4.9%
54.2%
2.3%
20.6%
EPISCOPAL CHURCH
1.5%
0.4%
1.8%
5.0%
SEVENTH DAY ADVENTIST CHURCH
1.1%
0.1%
1.7%
2.5%
COPTIC ORTHODOX CHURCH
1.0%
0.5%
0.5%
1.0%
MUSLIM ESTIMATE
0.8%
1.7%
1.4%
3.0%
PRESBYTERIAN CHURCH IN AMERICA
0.8%
0.0%
0.9%
0.0%
CUMBERLAND PRESBYTERIAN CHURCH
0.4%
0.0%
1.3%
0.0%
EVANGELICAL LUTHERAN CHURCH IN AMERICA
0.2%
0.6%
0.8%
4.0%
AMERICAN BAPTIST CHURCHES IN THE USA
0.1%
0.6%
0.3%
1.0%
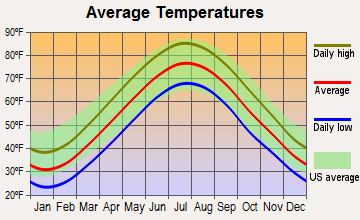
Weather
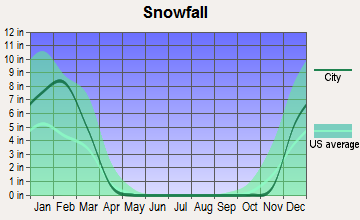
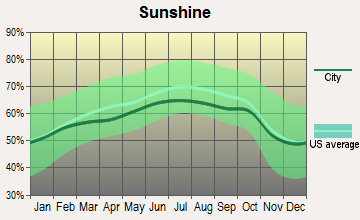
Nashville experiences a humid subtropical climate with hot summers and mild to cool winters. It gets more sunny days per year than the national average, enticing to those who appreciate warmer weather. Staten Island, on the other hand, has a temperate maritime climate. Here, it's common to encounter cold winters and warm, humid summers. Winter can bring heavy snowfall and summers can be quite humid.
Weather and climate
Type
Metropolitan Government
Staten Island
Temperature - Average
58.4°F
54.1°F
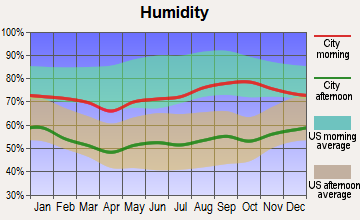
Humidity - Average morning or afternoon humidity
75.9%
67.4%
Humidity - Differences between morning and afternoon humidity
38%
29.9%
Humidity - Maximum monthly morning or afternoon humidity
89%
77%
Humidity - Minimum monthly morning or afternoon humidity
51%
47.2%
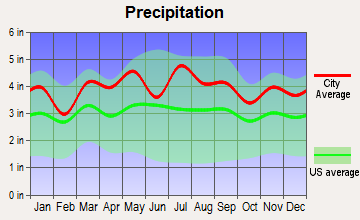
Precipitation - Yearly average
49 in
47.4 in
Snowfall - Yearly average
17.8 in
60 in
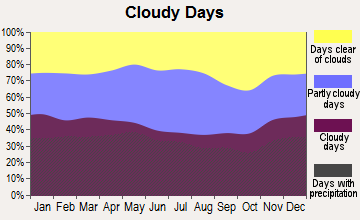
Clouds - Number of days clear of clouds
17.1%
15.8%
Sunshine amount - Average
59.7%
60.2%
Sunshine amount - Differences during a year
23%
20%
Sunshine amount - Maximum monthly
65%
64%
Sunshine amount - Minimum monthly
42%
44%
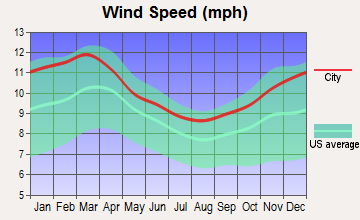
Wind speed - Average
7.7 mph
10.5 mph
Average climate in Metropolitan Government, Tennessee
Average climate in Staten Island, New York
Air pollution
Type
AQI
CO
NO2
OZONE
PB
PM10
PM25
SO2
Year
Metropolitan Government
Staten Island
Metropolitan Government
Staten Island
Metropolitan Government
Staten Island
Metropolitan Government
Staten Island
Metropolitan Government
Staten Island
Metropolitan Government
Staten Island
Metropolitan Government
Staten Island
Metropolitan Government
Staten Island
2018
71
94
0.40
0.35
13.8
17.1
24.1
24.1
N/A
N/A
15.2
N/A
9.2
7.9
0.2
0.4
2017
70
98
0.38
0.32
14.4
17.0
26.8
27.0
N/A
N/A
15.3
N/A
8.7
7.6
0.1
0.2
2016
90
94
0.42
0.37
16.1
17.9
26.4
28.5
N/A
N/A
N/A
N/A
10.1
7.7
0.0
0.2
2015
68
102
0.43
0.39
15.5
18.9
23.6
27.3
N/A
N/A
N/A
N/A
10.8
8.6
0.1
0.4
2014
66
97
N/A
0.38
N/A
19.2
26.3
25.6
N/A
N/A
N/A
N/A
9.8
8.3
1.4
0.7
2013
62
99
N/A
0.39
N/A
19.6
N/A
27.8
N/A
N/A
N/A
N/A
9.7
8.5
N/A
0.8
2012
81
102
N/A
0.42
N/A
19.3
28.3
26.9
N/A
N/A
N/A
N/A
11.0
9.2
2.3
1.4
2011
81
108
N/A
0.42
N/A
21.4
25.9
28.1
N/A
N/A
N/A
N/A
11.0
10.2
1.7
2.0
2010
80
114
N/A
0.40
N/A
19.9
24.3
28.7
N/A
N/A
N/A
N/A
12.2
9.4
2.2
1.8
2009
72
105
N/A
0.39
N/A
22.5
22.5
25.3
N/A
N/A
N/A
N/A
11.5
9.5
2.4
2.4
2008
81
111
N/A
0.39
N/A
23.0
25.7
24.3
N/A
0.013
N/A
N/A
13.4
11.3
2.5
3.4
2007
99
123
N/A
0.44
N/A
24.2
27.4
23.3
N/A
0.016
N/A
N/A
15.5
12.0
2.7
4.3
2006
93
117
0.69
0.55
N/A
25.6
24.9
24.7
N/A
0.018
N/A
N/A
14.9
13.1
2.9
5.3
2005
104
112
0.56
0.69
N/A
27.3
23.5
23.3
N/A
N/A
N/A
N/A
16.9
N/A
3.1
7.3
2004
83
109
0.61
0.68
N/A
26.4
22.0
22.2
0.006
0.030
N/A
N/A
N/A
N/A
2.6
6.9
2003
93
112
0.67
0.76
N/A
28.0
18.5
22.1
0.005
0.006
N/A
26.9
15.8
N/A
3.8
7.1
2002
92
125
0.68
0.74
N/A
30.6
20.2
24.7
N/A
0.008
N/A
26.1
15.3
N/A
4.3
6.6
2001
95
124
0.90
0.81
N/A
32.4
19.5
24.9
N/A
0.020
N/A
26.9
15.6
N/A
4.5
7.2
2000
97
116
0.75
0.93
N/A
33.0
19.8
23.1
N/A
0.022
N/A
22.2
N/A
N/A
4.1
7.2
Natural disasters
Type
Metropolitan Government
Staten Island
Tornado activity compared to U.S. average
169%
61.3%
Earthquake activity compared to U.S. average
296.3%
31.2%
Natural disasters compared to U.S. average
17%
19%
Transportation
Nashville has a bus-full public transit system, but many residents use personal vehicles due to the sprawling city layout. Staten Island offers a mix of public transit options - buses, a railway, several ferry services, and convenient access to NYC subway system making it easy to get around or commute to work.
Transport
Type
Metropolitan Government
Staten Island
Amtrak stations nearby
1
3
FAA registered aircraft
0
39
FAA registered aircraft manufacturers and dealers
0
2
Means of transportation to work
Type
Metropolitan Government
Staten Island
Bicycle
0.1%
0.2%
Bus
1.6%
19.2%
Carpooled
13.3%
12.1%
Car alone
78.6%
54.3%
Ferryboat
0%
5.3%
Railroad
0%
0.9%
Subway
0%
2.6%
Taxicab
0.1%
0.4%
Walked
2.3%
2.9%
Average travel time to work
Type
Metropolitan Government
Staten Island
Average
23.7 min
45.3 min
Real Estate
Real estate in Nashville is significantly cheaper than in Staten Island. Nashville has seen a real estate boom in recent years, with many new developments and conversions. Staten Island, on the other hand, has a higher property value, reflective of the overall New York City real estate market.
Neighborhoods
Nashville offers a range of neighborhoods from urban downtown areas to quiet suburban communities. Staten Island is largely residential and offers more of a small-town feel despite being part of New York City.
Houses and residents
Type
Metropolitan Government
Staten Island
Houses
252,977
163,993
Average household size (people)
2.3
2.8
Houses occupied
237,405 (93.8%)
156,341 (95.3%)
Houses occupied by owners
131,384 (55.3%)
99,732 (63.8%)
Houses occupied by renters
106,021 (44.7%)
56,609 (36.2%)
Median rent asked for vacant for-rent units
$1,207
$1,320
Median price asked for vacant for-sale houses and condos
$226,967
$369,853
Estimated median house or condo value
$350,700
$605,500
Median number of rooms in apartments
4.2
3.9
Median number of rooms in houses and condos
6.4
6.1
Housing density (houses/condos per square mile)
503.7
2,804.3
Household income disparities
45.5%
43.8%
Housing units without a mortgage
32,597 (28.1%)
19,289 (25%)
Housing units with both a second mortgage and home equity loan
342 (0.3%)
160 (0.2%)
Housing units with a mortgage
83,416 (71.9%)
57,986 (75%)
Housing units with a home equity loan
8,009 (6.9%)
5,623 (7.3%)
Housing units with a second mortgage
9,691 (8.4%)
4,499 (5.8%)
Housing units lacking complete kitchen facilities
0.7%
0.6%
Housing units lacking complete plumbing facilities
0.5%
0.5%
Housing units in structures
Housing units in structures
Metropolitan Government
Staten Island
One, detached
52.7%
33.8%
One, attached
6.9%
24.2%
Two
6.0%
23.0%
3 or 4
4.0%
5.0%
5 to 9
7.1%
2.4%
10 to 19
9.0%
1.6%
20 to 49
4.6%
2.9%
50 or more
8.0%
6.9%
Mobile homes
1.6%
0.2%
Median real estate property taxes paid for housing units
Self-employed workers in own not incorporated business
20,090
7,611
State government workers
13,081
6,285
Unpaid family workers
668
394
Industries and Occupations
In Nashville, industries related to healthcare, tourism, and music dominate, while education and government also provide numerous jobs. Staten Island has a diverse job market, with key industries being health care and social assistance, retail trade, and education.
Nashville is known for its excellent healthcare, with reputable institutions like Vanderbilt University Medical Center. Staten Island also has high-quality healthcare services, with two main hospitals and numerous clinics and health centers.
Infrastructure in Nashville is adequate, with consistent upgrades and improvements being implemented. However, traffic can be problematic during peak hours. Staten Island's infrastructure is more developed due to its incorporation into New York City, with great connectivity to Manhattan and other boroughs.
Infrastructure
Type
Metropolitan Government
Staten Island
TV stations
19
30
Culture and Food
As the center of country music, Nashville offers a rich musical culture, from the Grand Ole Opry to the Country Music Hall of Fame. Its cuisine is deeply rooted in southern comfort food. Staten Island, offers a more diverse cultural experience and food scene, reflective of NYC’s multicultural background.
Sports Teams
Nashville is home to professional sports teams like the Tennessee Titans (NFL) and Nashville Predators (NHL). Staten Island, while not being home to any major professional sports teams itself, offers easy access to NYC's wealth of sports teams from the Yankees to the Knicks.
 Metropolitan Government, TN
 Staten Island, NY