This analysis provides a comparative view of living in Metropolitan Government, TN (Nashville), and Montgomery, AL. We will examine various aspects, including crime and safety, weather, cost of living, education, work and economy, infrastructure, and more. Understanding these variables can significantly improve your relocation or travel decision.
Both cities have crime rates higher than the national average. Metropolitan Government has been investing heavily in law enforcement and implementing various community outreach programs to reduce crime. Montgomery experiences a relatively higher crime rate, particularly property crime. Visitors and potential residents are advised to research safety measures and choose neighborhoods wisely.
Cost of Living
The cost of living in Metropolitan Government is higher than Montgomery and the national average, influenced mainly by housing costs. Even though Montgomery's cost of living is below the national average, it's important to note that average incomes are also lower.
Income Tax
Tennessee does not tax wages, a significant advantage for individuals residing in Metropolitan Government. On the other hand, Alabama imposes a state income tax, impacting Montgomery residents.
Property Tax
Property tax in Metropolitan Government is higher than in Montgomery but comparable to the national average. Montgomery's property tax is below the national average but should be factored against lower median property values.
Sales Tax
Tennessee's sales tax, impacting Metropolitan Government, is significantly higher than Alabama's, which Montgomery falls under. Buyers would pay less sales tax in Montgomery than in Nashville.
Income
Type
Metropolitan Government
Montgomery
Estimated median household income
$65,348
$46,957
Estimated per capita income
$43,994
$27,253
Cost of living index (U.S. average is 100)
97.9
84.6
If you make $50,000 in Montgomery, you will have to make $57,861 in Metropolitan Government to maintain the same standard of living.
Geographical Conditions
Metropolitan Government shows diverse topography, with rolling hills surrounding the city. Montgomery is in the southeastern region of the state, marked by flatter terrain and several tributaries of the Alabama River.
Geographical information
Type
Metropolitan Government
Montgomery
Land area
502.3 sq. miles
155.4 sq. miles
Population density
1,236.2 people per sq. mile
1,278.6 people per sq. mile
Relative area comparison
Metropolitan Government, TN Montgomery, AL
Education
As the home to Vanderbilt University, Metropolitan Government boasts a strong education system. Montgomery also has a decent education system, with several reputable public and private schools and universities such as Alabama State University.
Metropolitan Government's economy is vibrant and diverse, with significant growth in healthcare, education, music, and tourism. Montgomery's economy is largely driven by manufacturing, healthcare, and education sectors. Both cities have a healthy job market, but Nashville offers greater diversity.
Biggest Employers
Nashville has a range of major employers, including Vanderbilt University Medical Center, Nissan North America, and HCA Holdings. Montgomery's largest employers are Maxwell-Gunter Air Force Base, Hyundai Motor Manufacturing, and Baptist Health.
In Metropolitan Government (Davidson County), 58.5% voted for Democrats and 39.9% for Republicans in 2012 Presidential Election. In Montgomery (Montgomery County), 62.0% voted for Democrats and 37.7% for Republicans.
Elections
Type
Democrats
Republicans
Other
Year
Metropolitan Government
Montgomery
Metropolitan Government
Montgomery
Metropolitan Government
Montgomery
2020
65.0%
65.1%
32.6%
33.6%
2.3%
1.3%
2016
60.1%
61.4%
34.1%
35.5%
5.7%
3.1%
2012
58.5%
62.0%
39.9%
37.7%
1.6%
0.3%
2008
60.0%
59.7%
39.0%
40.3%
1.0%
0.0%
2004
54.9%
50.6%
44.6%
49.4%
0.4%
0.0%
2000
57.9%
50.4%
40.4%
48.4%
1.7%
1.2%
1996
79.3%
48.7%
18.1%
48.0%
2.6%
3.3%
Breakdown of population affiliated with a religious congregation
Type
Adherents
Congregations
Religion
Metropolitan Government
Montgomery
Metropolitan Government
Montgomery
SOUTHERN BAPTIST CONVENTION
14.1%
18.8%
19.6%
15.3%
CATHOLIC CHURCH
4.9%
4.1%
2.3%
2.5%
EPISCOPAL CHURCH
1.5%
1.2%
1.8%
1.7%
SEVENTH DAY ADVENTIST CHURCH
1.1%
0.9%
1.7%
1.4%
COPTIC ORTHODOX CHURCH
1.0%
0.0%
0.5%
0.0%
MUSLIM ESTIMATE
0.8%
0.4%
1.4%
0.8%
PRESBYTERIAN CHURCH IN AMERICA
0.8%
1.2%
0.9%
2.0%
CUMBERLAND PRESBYTERIAN CHURCH
0.4%
0.0%
1.3%
0.0%
AMERICAN BAPTIST CHURCHES IN THE USA
0.1%
2.2%
0.3%
0.6%
Weather
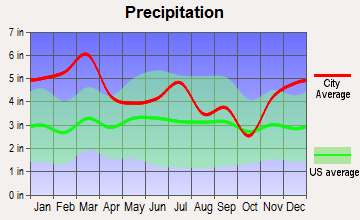
The weather in Metropolitan Government is typically mild and humid, with hot summers and moderately cold winters. Montgomery experiences similar weather patterns but can be slightly warmer during the summers. Both cities experience more rain than the national average.
Weather and climate
Type
Metropolitan Government
Montgomery
Temperature - Average
58.4°F
64.8°F
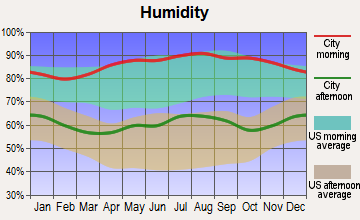
Humidity - Average morning or afternoon humidity
75.9%
76.7%
Humidity - Differences between morning and afternoon humidity
38%
40%
Humidity - Maximum monthly morning or afternoon humidity
89%
91%
Humidity - Minimum monthly morning or afternoon humidity
51%
51%
Precipitation - Yearly average
49 in
52.5 in
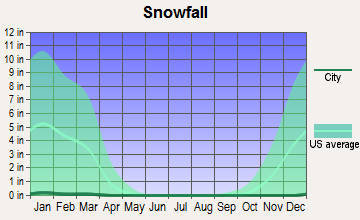
Snowfall - Yearly average
17.8 in
0.8 in
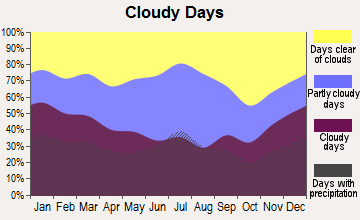
Clouds - Number of days clear of clouds
17.1%
17.9%
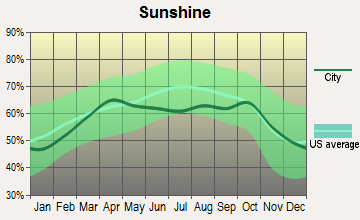
Sunshine amount - Average
59.7%
63.1%
Sunshine amount - Differences during a year
23%
17%
Sunshine amount - Maximum monthly
65%
64%
Sunshine amount - Minimum monthly
42%
47%
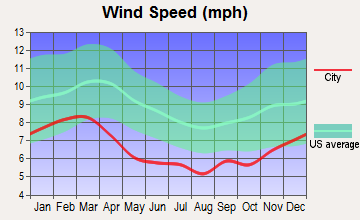
Wind speed - Average
7.7 mph
6.4 mph
Average climate in Metropolitan Government, Tennessee
Average climate in Montgomery, Alabama
Air pollution
Type
AQI
CO
NO2
OZONE
PB
PM10
PM25
SO2
Year
Metropolitan Government
Montgomery
Metropolitan Government
Metropolitan Government
Metropolitan Government
Montgomery
Metropolitan Government
Metropolitan Government
Metropolitan Government
Montgomery
Metropolitan Government
2018
71
75
0.40
N/A
13.8
N/A
24.1
26.3
N/A
N/A
15.2
N/A
9.2
13.8
0.2
N/A
2017
70
89
0.38
N/A
14.4
N/A
26.8
27.8
N/A
N/A
15.3
N/A
8.7
11.7
0.1
N/A
2016
90
75
0.42
N/A
16.1
N/A
26.4
29.6
N/A
N/A
N/A
N/A
10.1
8.8
0.0
N/A
2015
68
76
0.43
N/A
15.5
N/A
23.6
26.8
N/A
N/A
N/A
N/A
10.8
10.6
0.1
N/A
2014
66
55
N/A
N/A
N/A
N/A
26.3
28.2
N/A
N/A
N/A
N/A
9.8
N/A
1.4
N/A
2013
62
53
N/A
N/A
N/A
N/A
N/A
27.2
N/A
N/A
N/A
N/A
9.7
N/A
N/A
N/A
2012
81
63
N/A
N/A
N/A
N/A
28.3
29.7
N/A
N/A
N/A
N/A
11.0
N/A
2.3
N/A
2011
81
67
N/A
N/A
N/A
N/A
25.9
31.2
N/A
N/A
N/A
N/A
11.0
N/A
1.7
N/A
2010
80
84
N/A
N/A
N/A
N/A
24.3
31.2
N/A
N/A
N/A
N/A
12.2
12.5
2.2
N/A
2009
72
68
N/A
N/A
N/A
N/A
22.5
27.1
N/A
N/A
N/A
N/A
11.5
10.5
2.4
N/A
2008
81
79
N/A
N/A
N/A
N/A
25.7
30.4
N/A
N/A
N/A
N/A
13.4
N/A
2.5
N/A
2007
99
90
N/A
N/A
N/A
N/A
27.4
34.0
N/A
N/A
N/A
N/A
15.5
N/A
2.7
N/A
2006
93
73
0.69
N/A
N/A
N/A
24.9
31.4
N/A
N/A
N/A
N/A
14.9
N/A
2.9
N/A
2005
104
71
0.56
N/A
N/A
N/A
23.5
28.0
N/A
N/A
N/A
N/A
16.9
N/A
3.1
N/A
2004
83
62
0.61
N/A
N/A
N/A
22.0
26.0
0.006
N/A
N/A
N/A
N/A
N/A
2.6
N/A
2003
93
67
0.67
N/A
N/A
N/A
18.5
25.4
0.005
N/A
N/A
N/A
15.8
N/A
3.8
N/A
2002
92
78
0.68
N/A
N/A
N/A
20.2
28.6
N/A
N/A
N/A
N/A
15.3
N/A
4.3
N/A
2001
95
94
0.90
N/A
N/A
N/A
19.5
28.3
N/A
N/A
N/A
N/A
15.6
N/A
4.5
N/A
2000
97
108
0.75
N/A
N/A
N/A
19.8
35.9
N/A
N/A
N/A
N/A
N/A
N/A
4.1
N/A
Natural disasters
Type
Metropolitan Government
Montgomery
Tornado activity compared to U.S. average
169%
144.5%
Earthquake activity compared to U.S. average
296.3%
166.1%
Natural disasters compared to U.S. average
17%
15%
Transportation
Metropolitan Government offers more robust public transportation than Montgomery, with broader transit services. Both cities have traffic congestion, especially during peak hours, but Nashville's is more pronounced due to its size.
Transport
Type
Metropolitan Government
Montgomery
Amtrak stations
0
1
Amtrak stations nearby
1
1
FAA registered aircraft
0
168
FAA registered aircraft manufacturers and dealers
0
9
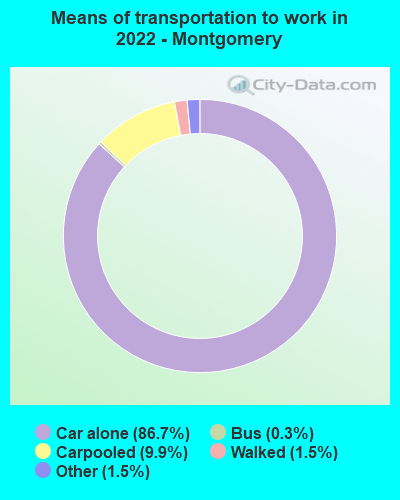
Means of transportation to work
Type
Metropolitan Government
Montgomery
Bicycle
0.1%
0.1%
Bus
1.6%
0.3%
Carpooled
13.3%
8.1%
Car alone
78.6%
89.9%
Taxicab
0.1%
0.2%
Walked
2.3%
1.1%
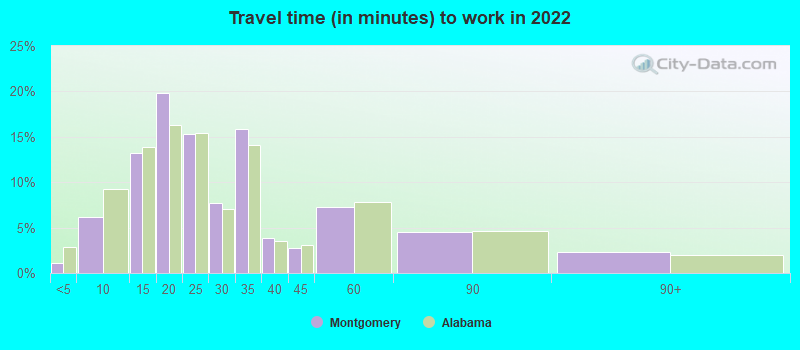
Average travel time to work
Type
Metropolitan Government
Montgomery
Average
23.7 min
26.5 min
Real Estate
Real estate prices in Metropolitan Government are significantly higher than in Montgomery. However, Nashville also provides a higher likelihood of property appreciation over time due to its thriving economy.
Neighborhoods
Both cities offer vibrant neighborhoods. Nashville is famous for areas like East Nashville, Sylvan Park, and Germantown. Montgomery offers attractive neighborhoods like McGehee-Allendale and Cloverdale-Idlewild.
Houses and residents
Type
Metropolitan Government
Montgomery
Houses
252,977
93,055
Average household size (people)
2.3
2.4
Houses occupied
237,405 (93.8%)
81,529 (87.6%)
Houses occupied by owners
131,384 (55.3%)
45,969 (56.4%)
Houses occupied by renters
106,021 (44.7%)
35,560 (43.6%)
Median rent asked for vacant for-rent units
$1,207
$1,021
Median price asked for vacant for-sale houses and condos
$226,967
$177,602
Estimated median house or condo value
$350,700
$136,800
Median number of rooms in apartments
4.2
4.4
Median number of rooms in houses and condos
6.4
6.7
Housing density (houses/condos per square mile)
503.7
598.9
Household income disparities
45.5%
46.9%
Housing units without a mortgage
32,597 (28.1%)
462 (1.6%)
Housing units with both a second mortgage and home equity loan
342 (0.3%)
1,755 (6.1%)
Housing units with a mortgage
83,416 (71.9%)
28,109 (98.4%)
Housing units with a home equity loan
8,009 (6.9%)
309 (1.1%)
Housing units with a second mortgage
9,691 (8.4%)
2,440 (8.5%)
Housing units lacking complete kitchen facilities
0.7%
4%
Housing units lacking complete plumbing facilities
Self-employed workers in own not incorporated business
20,090
4,332
State government workers
13,081
6,387
Unpaid family workers
668
0
Industries and Occupations
Tourism, music, healthcare, and education are the driving industries in Metropolitan Government. Montgomery is driven by manufacturing, state government, and military sectors. Diverse job opportunities are available in both cities.
Metropolitan Government has more mature healthcare infrastructure with renowned healthcare institutions like Vanderbilt University Medical Center. Montgomery also has sound healthcare facilities, including Baptist Medical Center.
Health (county statistics)
Type
Metropolitan Government
Montgomery
General health status score of residents in this county from 1 (poor) to 5 (excellent)
Both cities are well developed. Metropolitan Government’s infrastructure is somewhat more robust due to its status as a larger city. There's continuous investment in infrastructure in both cities for improvements.
Infrastructure
Type
Metropolitan Government
Montgomery
TV stations
19
11
Culture and Food
Metropolitan Government is known globally as "Music City" due to its rich music culture. Both cities offer diverse food scenes, but Nashville’s stands out more due to its fame for delicious Southern comfort food and BBQ.
Sports Teams
Professional sports teams like the Titans (NFL) and Predators (NHL) call Metropolitan Government home. Montgomery does not host any major league teams but is home to the minor league baseball team, the Montgomery Biscuits.
 Metropolitan Government, TN
 Montgomery, AL