When comparing the cities of Mesa and Tempe in Arizona, several factors come into play. These factors range from cost of living, safety, education and culture, among others. Both cities offer unique experiences and are attractive for various reasons such as weather, sports, and food scene. However, they each have a distinct character with certain features that may appeal more to some people than others. Whether you're looking to move permanently or simply visit, the following comparison will provide an informed view of what each city has to offer.
Distance between
Mesa, AZ and
Tempe, AZ : 10.6 miles
Mesa's population is larger by 177%. Its population has grown by 113,100 people (28.5%) since 2000. The population of Tempe has grown by 25,493 people (16.1%) during that time.
In terms of safety, both Mesa and Tempe have crime rates that are higher than the national average. However, in comparison, Mesa has a lower crime rate than Tempe, especially when looking at violent crimes. For both cities the most frequent crime is property crime.
City-data.com crime index counts serious crimes and violent crime more heavily. It adjusts for the number of visitors and daily workers commuting into cities. (higher means more crime, U.S. average = 301.1)
City-data.com crime index counts serious crimes and violent crime more heavily. It adjusts for the number of visitors and daily workers commuting into cities. (higher means more crime, U.S. average = 301.1)
Sex Offenders
According to our data, there are 650 registered sex offenders living in Mesa and 77 registered sex offenders living in . The ratio of residents to sex offenders in Mesa is 746 to 1; the ratio in Tempe is 2,370 to 1. The number of registered sex offenders compared to the number of residents is much larger in Mesa than that in Tempe.
Cost of Living
The cost of living in Mesa is generally lower than in Tempe. Tempe has higher housing costs which are a key factor in this difference. While costs like groceries, utilities, and healthcare are relatively close in both cities, homeowners and those who rent homes or apartments will generally pay less in Mesa.
Income Tax
Arizona has a progressive income tax rate, meaning it increases based on income level. The range is from 2.59% to 4.5%. This tax is imposed by the state, so Mesa and Tempe do not differ in this regard.
Property Tax
Property taxes vary by county rather than by city. Both Mesa and Tempe are in Maricopa County, which has a relatively lower property tax rate among the U.S. counties.
Sales Tax
Arizona's state sales tax rate is 5.6%, but each city adds its own additional tax. Tempe has a higher sales tax rate at 8.1% as compared to Mesa's rate of 8.05%.
Income
Type
Mesa
Tempe
Estimated median household income
$69,266
$68,662
Estimated per capita income
$35,439
$39,225
Cost of living index (U.S. average is 100)
101
102.6
If you make $50,000 in Mesa, you will have to make $50,792 in Tempe to maintain the same standard of living.
Geographical Conditions
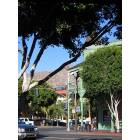
Both Tempe and Mesa are located in the Sonoran Desert, offering residents and visitors beautiful desert landscapes and hiking options. Tempe, however, also offers water-based activities at its man-made Town Lake.
Both cities offer decent education amenities. However, Tempe stands out due to Arizona State University, one of the largest public universities in the U.S. Mesa, on the other hand, has multiple campuses for various colleges which add variety to its education offerings.
Mesa has a slightly stronger economy than Tempe, with a lower unemployment rate and higher median household income. Essentially, both cities provide good work opportunities, with key industries in healthcare, education, retail, and technology.
Biggest Employers
In Mesa, the biggest employers are the Banner Health System, Mesa Public Schools and the City of Mesa. Tempe's biggest employers include Arizona State University, State Farm Insurance, and various technological enterprises like Insight Enterprises.
There were 2,046 building permits issued in Mesa in 2012 (1543 more than in 2011) compared to 123 building permits issued in Tempe in 2012 (104 more than in 2011).
Weather
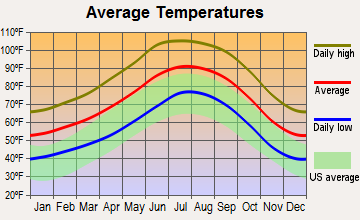
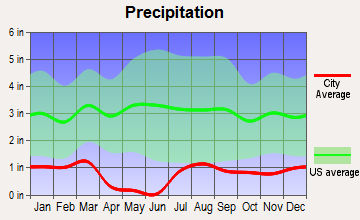
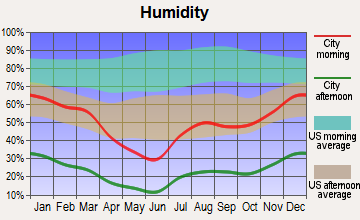
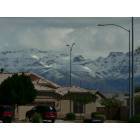
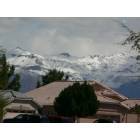
Weather-wise, Mesa and Tempe enjoy typical Arizona climates with extremely hot summers and mild winters. Mesa, being farther from the center of Phoenix, can be slightly cooler than Tempe because it doesn't experience the same urban heat island effect. Both cities have very low humidity and little rainfall throughout the year.
Weather and climate
Type
Mesa
Tempe
Temperature - Average
71.7°F
71.4°F
Humidity - Average morning or afternoon humidity
37.5%
37.5%
Humidity - Differences between morning and afternoon humidity
48%
48%
Humidity - Maximum monthly morning or afternoon humidity
60%
60%
Humidity - Minimum monthly morning or afternoon humidity
12%
12%
Precipitation - Yearly average
9.5 in
9.2 in
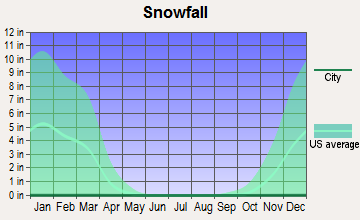
Snowfall - Yearly average
0 in
0 in
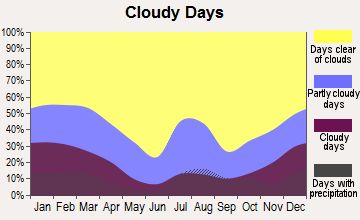
Clouds - Number of days clear of clouds
35.2%
35.2%
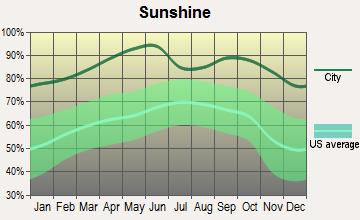
Sunshine amount - Average
92.8%
92.8%
Sunshine amount - Differences during a year
16%
16%
Sunshine amount - Maximum monthly
95%
95%
Sunshine amount - Minimum monthly
79%
79%
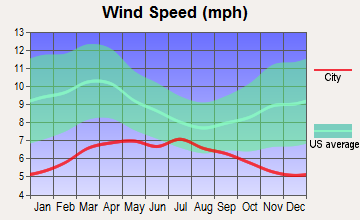
Wind speed - Average
6.6 mph
6.6 mph
Average climate in Mesa, Arizona
Average climate in Tempe, Arizona
Air pollution
Type
AQI
CO
NO2
OZONE
PM10
PM25
SO2
Year
Mesa
Tempe
Mesa
Tempe
Mesa
Tempe
Mesa
Tempe
Mesa
Tempe
Mesa
Tempe
Mesa
Tempe
2018
200
206
0.28
0.31
15.1
15.1
34.8
26.5
28.1
27.3
7.5
7.2
0.6
0.6
2017
128
132
0.28
0.33
15.8
15.8
35.1
25.5
24.5
24.3
8.2
7.2
1.4
1.4
2016
121
126
0.31
0.33
15.7
15.8
34.6
26.1
21.5
22.3
6.8
6.9
0.4
0.4
2015
104
104
0.34
0.37
17.6
17.8
33.4
27.2
17.7
21.6
6.8
7.2
0.9
0.9
2014
135
135
0.33
0.38
19.6
19.9
34.0
25.7
30.8
29.2
8.4
8.7
1.1
1.1
2013
141
148
0.31
0.36
19.9
20.2
34.8
26.3
29.3
28.7
5.8
8.7
0.9
0.9
2012
159
166
0.38
0.46
21.2
21.5
33.7
25.7
37.9
35.8
8.1
9.6
1.3
1.3
2011
205
205
0.31
0.42
18.5
18.7
34.1
24.9
40.4
41.3
9.5
9.5
0.9
0.9
2010
100
100
0.31
0.38
16.4
16.5
32.9
25.5
29.5
29.2
8.3
8.3
1.2
1.2
2009
109
109
0.33
0.51
16.6
16.7
32.3
26.6
37.8
37.9
N/A
N/A
1.0
1.0
2008
106
106
0.29
0.38
17.5
17.6
34.2
27.1
39.9
40.0
N/A
N/A
1.1
1.1
2007
134
135
0.43
0.40
19.3
19.5
31.0
26.4
50.6
48.1
N/A
N/A
1.9
1.9
2006
138
138
0.44
0.56
22.1
22.2
30.9
26.4
57.5
51.5
N/A
N/A
1.8
1.8
2005
109
109
0.49
0.52
22.6
22.7
30.0
23.9
49.1
44.9
N/A
N/A
1.7
1.7
2004
97
98
0.51
0.47
22.4
22.5
30.4
23.7
33.4
34.2
N/A
N/A
1.4
1.4
2003
99
101
0.56
0.66
24.0
23.6
31.7
24.5
42.6
42.6
N/A
N/A
1.4
1.4
2002
110
111
0.69
0.78
24.9
23.9
28.0
24.6
41.8
41.8
N/A
N/A
1.6
1.6
2001
105
106
0.65
0.71
23.8
22.4
27.2
25.2
37.8
37.8
N/A
N/A
1.5
1.5
2000
117
117
0.76
0.84
29.8
29.0
27.1
25.8
45.6
45.6
N/A
N/A
1.7
1.7
Natural disasters
Type
Mesa
Tempe
Tornado activity compared to U.S. average
18.1%
18.6%
Earthquake activity compared to U.S. average
2,348.6%
2,459.2%
Natural disasters compared to U.S. average
16%
16%
Transportation
In terms of transportation, both cities offer public bus services, but Tempe is more transit-friendly due to the light rail that runs through the city, connecting with downtown Phoenix. For car-commuters, Mesa's larger size can imply longer travel times depending on exact locations.
Transport
Type
Mesa
Tempe
Amtrak stations nearby
2
3
FAA registered aircraft
828
172
FAA registered aircraft manufacturers and dealers
20
2
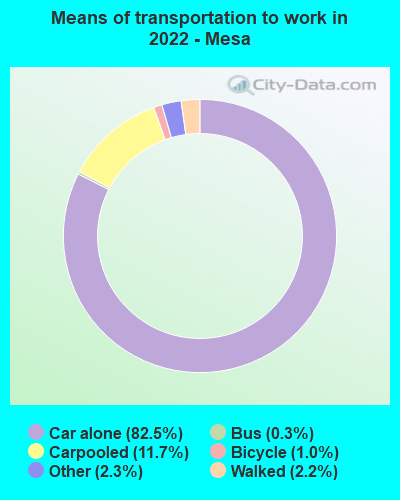
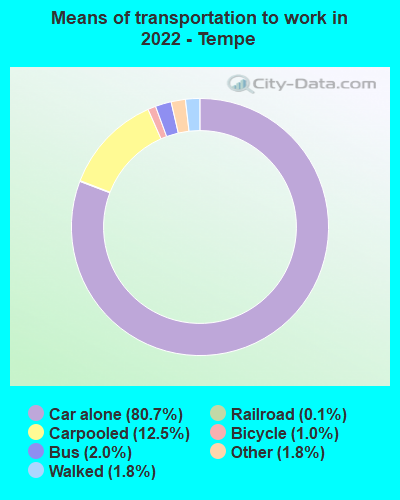
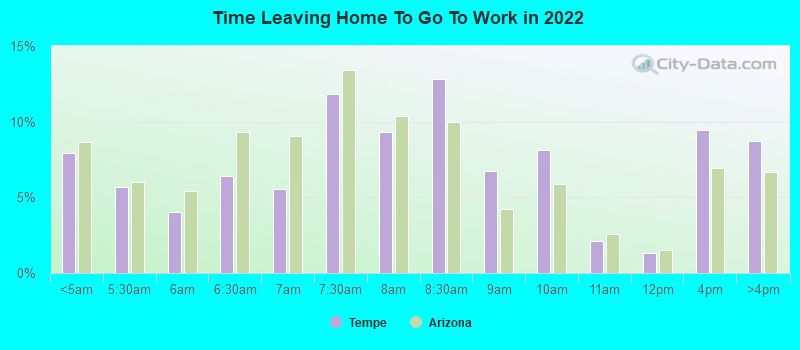
Means of transportation to work
Type
Mesa
Tempe
Bicycle
0.6%
1.2%
Bus
0.3%
1.3%
Carpooled
14.4%
8.4%
Car alone
79.9%
84.4%
Motorcycle
0.5%
0.5%
Railroad
0%
0.3%
Walked
2.5%
2.1%
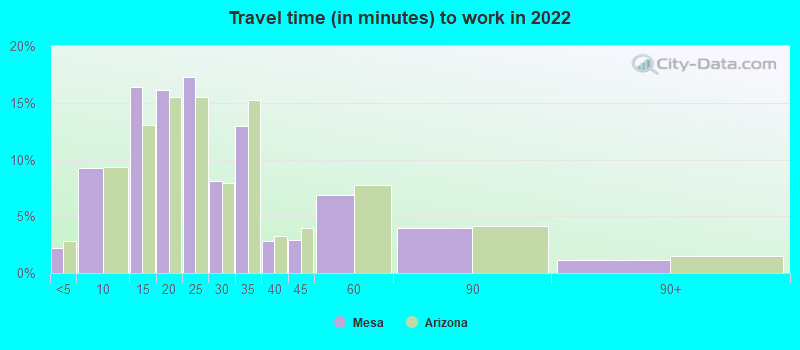
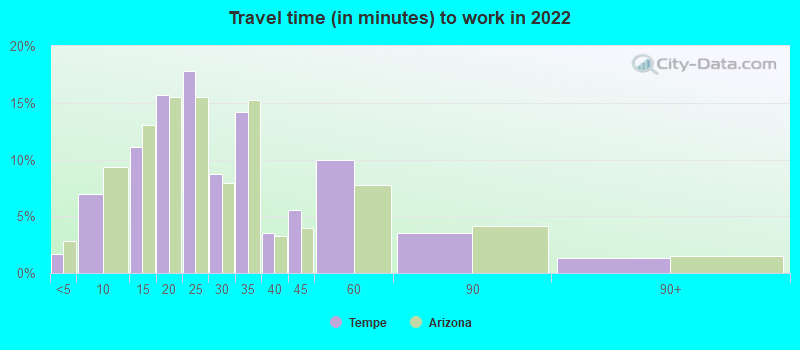
Average travel time to work
Type
Mesa
Tempe
Average
25 min
27.9 min
Other means
26.9 min
21.3 min
Public transportation
45.9 min
37.7 min
Private vehicle occupancy
Type
Mesa
Tempe
Average
1.2
1.2
Drove alone
85.8%
89.2%
In 2 person carpool
11.1%
8%
In 3 person carpool
2.1%
1.3%
In 4 person carpool
0.5%
1%
In 5-6 person carpool
0.5%
0.4%
In 7+ person carpool
0.1%
0.2%
How many people usually rode to work in the car, truck or van.
Real Estate
Real estate in Mesa is generally less expensive than in Tempe. While the market is competitive in both cities, you are likely to get more square footage for your dollar in Mesa.
Neighborhoods
Mesa features family-friendly neighborhoods like Eastmark and Las Sendas, known for their community activities and parks. For Tempe, neighborhoods such as Maple-Ash and Duskfire II are famous for their close proximity to downtown and ASU, making them especially appealing to students and young professionals.
Houses and residents
Type
Mesa
Tempe
Houses
221,995
83,172
Average household size (people)
2.6
2.3
Median year apartment built
1987
1987
Median year house/condo built
1989
1978
Length of stay in the house since moving in
11.2 years
12.8 years
Houses occupied
199,112 (89.7%)
77,306 (92.9%)
Houses occupied by owners
126,146 (63.4%)
32,131 (41.6%)
Houses occupied by renters
72,966 (36.6%)
45,175 (58.4%)
Median rent asked for vacant for-rent units
$1,890
$1,629
Median monthly housing costs
$1,220
$1,396
Median price asked for vacant for-sale houses and condos
$262,297
$376,423
Estimated median house or condo value
$350,100
$414,600
Median numbers of rooms
5.2
4.6
Median number of rooms in apartments
4
3.7
Median number of rooms in houses and condos
5.9
6.2
Median house price - detached houses
$421,563
$504,906
Median house price - in 3-to-4-unit structures
$226,327
$244,896
Median house price - in 5 or more unit structures
$250,077
$285,650
Median house price - mobile homes
$70,636
$67,979
Median house price - Townhouses or other attached units
$256,984
$285,355
Median house price - All housing units
$364,728
$445,318
Median house age
33
38
Renting percentage
36.8%
55.5%
Housing density (houses/condos per square mile)
1,776.1
2,076
House value disparities
31.1%
29.3%
Household income disparities
42.1%
43.4%
Median household income for houses/condes with a mortgage
$97,987
$110,111
Median household income for apartments without a mortgage
$63,218
$79,940
Housing units without a mortgage
1,338 (1.6%)
117 (0.6%)
Housing units with both a second mortgage and home equity loan
5,628 (6.9%)
900 (4.3%)
Housing units with a mortgage
80,572 (98.4%)
20,667 (99.4%)
Housing units with a home equity loan
48 (0.1%)
74 (0.4%)
Housing units with a second mortgage
7,236 (8.8%)
1,121 (5.4%)
House/condo owner moved in on average (years ago)
8
10
House/condo renter moved in on average (years ago)
1
1
Housing units lacking complete kitchen facilities
0.9%
1%
Housing units lacking complete plumbing facilities
0.4%
0.2%
Housing units in structures
Housing units in structures
Mesa
Tempe
One, detached
55.9%
38.8%
One, attached
6.6%
10.3%
Two
1.0%
1.4%
3 or 4
5.1%
5.6%
5 to 9
6.0%
8.0%
10 to 19
5.0%
9.2%
20 to 49
2.8%
6.4%
50 or more
5.3%
17.9%
Mobile homes
11.8%
2.3%
Boats, RVs, vans, etc.
0.6%
0.1%
Median real estate property taxes paid for housing units
Self-employed workers in own not incorporated business
10,562
3,946
State government workers
6,039
7,749
Unpaid family workers
830
80
Industries and Occupations
The industries in both cities are quite similar, with healthcare, education, retail trade, and accommodation and food services being the top employing industries. Notably, many people work in office and administrative support roles in both cities.
Health diagnosing and treating practitioners and other technical occupations
6.7%
5.5%
Food preparation and serving related occupations
6.0%
6.7%
Healthcare support occupations
5.7%
4.7%
Health technologists and technicians
3.7%
2.4%
Personal care and service occupations
3.6%
4.8%
Production occupations
3.0%
2.1%
Building and grounds cleaning and maintenance occupations
2.6%
0.9%
Material moving occupations
2.3%
1.8%
Transportation occupations
1.9%
0.9%
Community and social service occupations
1.8%
3.1%
Computer and mathematical occupations
1.6%
2.9%
Arts, design, entertainment, sports, and media occupations
1.3%
2.8%
Architecture and engineering occupations
0.9%
1.3%
Legal occupations
0.7%
1.6%
Health Care
Both cities have access to excellent healthcare, with several reputed hospitals in the area. Tempe has Tempe St. Luke's while Mesa offers the Banner Health system.
In terms of infrastructure, Mesa is larger and spreads out more, leading to a more suburban feel. Tempe, being smaller, has more of a city-like atmosphere with a focus on walkability, especially near the university.
Infrastructure
Type
Mesa
Tempe
TV stations
18
22
Bank branches located here
97
38
Bank institutions located here
22
15
Main business address for public companies
2
11
Drinking water stations with no reported violations in the past
1
0
Drinking water stations with reported violations in the past
HMDA - Conventional home purchase loans - Applications denied
Year
Mesa
Tempe
1999
2,532
683
2000
2,428
588
2001
1,854
385
2002
1,520
372
2003
1,991
395
2004
2,897
603
2005
3,857
913
2006
3,727
747
2007
1,896
506
2008
765
249
2009
440
129
Culture and Food
Both cities have a vibrant food scene, with Mesa known for its diverse offerings reflecting its mix of cultures. Tempe, being a college town, boasts numerous bars, restaurants, and coffee shops. In terms of culture, both cities offer various festivals, art galleries and music events throughout the year.
Sports Teams
Sports fans will find more options in Tempe due to the presence of Arizona State University's sports teams - the Sun Devils. However, Mesa isn't bereft of sports entertainment as it hosts spring training for two Major League Baseball teams.


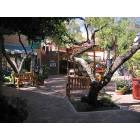
 Mesa, AZ
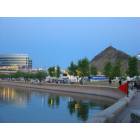
 Tempe, AZ