When it comes to comparing life in Memphis, Tennessee to that in Southeast Montgomery, Texas, several key factors come into play. Factors such as crime and safety, weather, cost of living, and education significantly impact the lifestyle in these cities. Industries, big employers, real estate, and infrastructure also play important roles. City taxes, culture, food scenes, sports, geographical conditions, and healthcare are other substantial elements to consider. Read on to get a detailed comparison of these two cities.
Memphis, TN, generally records a higher crime rate than the US average, making safety a concern for residents or prospective movers. Tourists should also exercise caution when visiting certain parts of the city. In comparison, Southeast Montgomery, TX, has an overall lower crime rate than Memphis and indeed better than the national average, making it a safer choice for both locals and tourists.
Cost of Living
Living in Memphis, TN, is generally more affordable than the national average, with goods and services, housing, and healthcare costs being lower than in most cities. In contrast, Southeast Montgomery has a slightly higher cost of living than the national average, impacted primarily by housing expenses.
Income Tax
In Memphis, residents have to pay state income tax for interest and dividends. In contrast, Texas, including Southeast Montgomery, does not impose a state income tax.
Property Tax
Memphis has a relatively high property tax rate. Meanwhile, Southeast Montgomery also has a considerable property tax rate, as Texas has one of the highest property tax rates in the U.S.
Sales Tax
Tennessee, including Memphis, has a relatively high sales tax compared to Texas. Southeast Montgomery benefits from Texas's lack of a state income tax, but has a higher state and local sales tax, ranking among the nation's highest.
Income
Type
Memphis
Southeast Montgomery
Estimated median household income
$44,317
$85,955
Estimated per capita income
$28,571
$42,611
Cost of living index (U.S. average is 100)
85.5
101.8
If you make $50,000 in Memphis, you will have to make $59,532 in Southeast Montgomery to maintain the same standard of living.
Geographical Conditions
Memphis is located along the Mississippi River and offers a number of scenic parks and outdoor activities. Southeast Montgomery, located in the southeast Texas region, is characterized by flat to gently rolling terrain and proximate to Lake Houston, providing numerous outdoor recreational opportunities.
Geographical information
Type
Memphis
Southeast Montgomery
Land area
279.3 sq. miles
483.9 sq. miles
Population density
2,248.8 people per sq. mile
596.7 people per sq. mile
Relative area comparison
Memphis, TN Southeast Montgomery, TX
Education
Memphis is home to several reputed institutions and universities, offering various programs. The city has a lower high school graduation rate compared to the national average. On the contrary, Southeast Montgomery has a slightly above-average high school graduation rate and is proximate to several highly-rated colleges and universities in Houston.
Memphis's economy is predominantly driven by industries like transportation, healthcare, and services. On the other hand, Southeast Montgomery's economy is bolstered by industries such as oil, gas, healthcare, and education. Both regions offer diverse job opportunities.
Biggest Employers
Memphis's largest employers include FedEx, the Methodist Le Bonheur Healthcare, and the Shelby County school district. For Southeast Montgomery, the proximity to Houston expands the range of employers, including ExxonMobil, Memorial Hermann Health Systems, and the University of Texas MD Anderson Cancer Center.
In Memphis (Shelby County), 62.9% voted for Democrats and 36.7% for Republicans in 2012 Presidential Election. In Southeast Montgomery (Montgomery County), 19.1% voted for Democrats and 79.9% for Republicans.
Elections
Type
Democrats
Republicans
Other
Year
Memphis
Southeast Montgomery
Memphis
Southeast Montgomery
Memphis
Southeast Montgomery
2020
64.8%
27.5%
34.2%
71.4%
1.1%
1.2%
2016
62.3%
22.4%
34.7%
73.5%
3.1%
4.0%
2012
62.9%
19.1%
36.7%
79.9%
0.4%
1.0%
2008
63.8%
23.2%
36.2%
75.9%
0.0%
0.9%
2004
57.7%
21.4%
42.0%
78.2%
0.3%
0.4%
2000
56.8%
22.0%
42.3%
76.0%
0.9%
2.0%
1996
78.9%
26.5%
19.6%
65.2%
1.5%
8.3%
Breakdown of population affiliated with a religious congregation
Type
Adherents
Congregations
Religion
Memphis
Southeast Montgomery
Memphis
Southeast Montgomery
SOUTHERN BAPTIST CONVENTION
14.8%
19.0%
15.1%
34.7%
CATHOLIC CHURCH
6.5%
12.8%
2.7%
1.2%
EVANGELICAL PRESBYTERIAN CHURCH
1.5%
0.0%
0.7%
0.0%
EPISCOPAL CHURCH
0.8%
0.4%
1.8%
0.6%
MUSLIM ESTIMATE
0.5%
2.2%
0.8%
1.2%
LUTHERAN CHURCH
0.4%
0.3%
1.0%
1.2%
PRESBYTERIAN CHURCH IN AMERICA
0.4%
0.1%
0.6%
0.3%
SEVENTH DAY ADVENTIST CHURCH
0.4%
0.2%
0.9%
1.5%
EVANGELICAL LUTHERAN CHURCH IN AMERICA
0.1%
0.5%
0.4%
1.5%
Weather
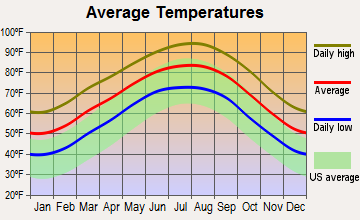
Memphis experiences a humid subtropical climate characterized by hot, humid summers and mild winters, while Southeast Montgomery, TX, has a humid subtropical climate with hot, humid summers and moderately cool winters. Both regions are susceptible to extreme weather conditions; Memphis may experience severe thunderstorms while Southeast Montgomery is susceptible to hurricanes.
Weather and climate
Type
Memphis
Southeast Montgomery
Temperature - Average
61.9°F
68.1°F
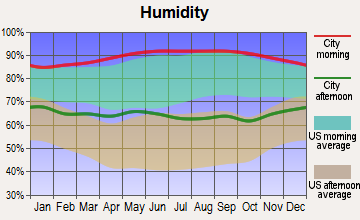
Humidity - Average morning or afternoon humidity
74%
80.3%
Humidity - Differences between morning and afternoon humidity
33%
36.9%
Humidity - Maximum monthly morning or afternoon humidity
85%
93%
Humidity - Minimum monthly morning or afternoon humidity
52%
56%
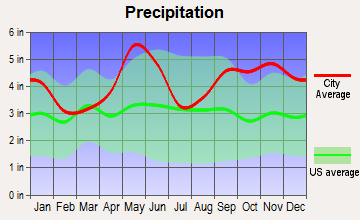
Precipitation - Yearly average
54.3 in
49.8 in
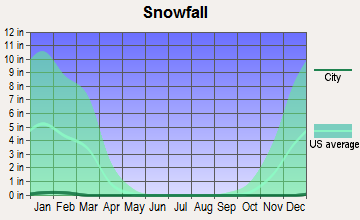
Snowfall - Yearly average
8.6 in
0.6 in
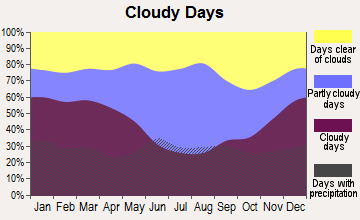
Clouds - Number of days clear of clouds
19.7%
15%
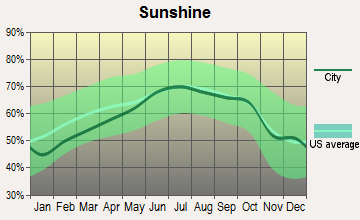
Sunshine amount - Average
68.7%
60.4%
Sunshine amount - Differences during a year
24%
24%
Sunshine amount - Maximum monthly
74%
67%
Sunshine amount - Minimum monthly
50%
43%
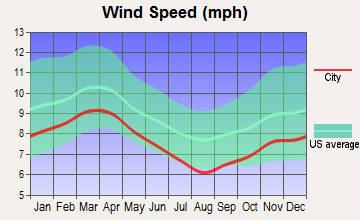
Wind speed - Average
8.8 mph
8.1 mph
Average climate in Memphis, Tennessee
Average climate in Southeast Montgomery, Texas
Air pollution
Type
AQI
CO
NO2
OZONE
PM10
PM25
SO2
Year
Memphis
Southeast Montgomery
Memphis
Memphis
Southeast Montgomery
Memphis
Southeast Montgomery
Memphis
Memphis
Southeast Montgomery
Memphis
2018
81
93
0.24
N/A
10.4
2.9
27.1
26.5
19.0
N/A
8.1
8.3
0.4
N/A
2017
74
92
0.24
N/A
10.2
3.1
28.1
27.5
17.5
N/A
7.9
8.6
0.3
N/A
2016
76
81
0.24
N/A
10.2
3.5
28.8
27.0
19.6
N/A
8.5
8.7
0.9
N/A
2015
77
93
0.26
N/A
11.1
3.4
26.9
26.0
N/A
N/A
9.2
9.2
1.0
N/A
2014
75
84
0.27
N/A
10.1
3.6
26.5
26.3
N/A
N/A
9.9
9.3
1.3
N/A
2013
74
100
0.31
N/A
8.3
3.2
26.6
27.6
N/A
N/A
10.2
9.7
1.0
N/A
2012
94
102
0.32
N/A
9.3
4.6
29.7
26.4
N/A
N/A
10.7
10.2
0.6
N/A
2011
93
113
0.34
N/A
10.0
5.0
29.0
29.5
N/A
N/A
11.1
10.9
0.5
N/A
2010
95
100
0.43
N/A
10.3
5.0
27.9
26.4
N/A
N/A
12.9
11.0
N/A
N/A
2009
86
106
0.35
N/A
8.7
4.9
24.9
25.9
N/A
N/A
11.8
10.9
N/A
N/A
2008
94
99
0.36
N/A
10.3
5.4
26.3
27.2
N/A
N/A
13.2
11.3
N/A
N/A
2007
106
115
0.47
N/A
11.2
5.9
26.7
25.3
N/A
N/A
14.8
11.4
5.6
N/A
2006
108
113
0.43
N/A
13.0
6.5
26.8
28.8
N/A
N/A
14.7
11.3
6.3
N/A
2005
110
120
0.46
N/A
10.1
6.9
26.9
29.2
N/A
N/A
17.9
12.8
4.9
N/A
2004
98
103
0.51
N/A
N/A
6.8
24.9
26.5
N/A
N/A
14.5
N/A
5.9
N/A
2003
110
115
0.57
N/A
20.1
7.4
25.3
26.4
N/A
N/A
15.0
N/A
5.8
N/A
2002
110
113
0.58
N/A
20.4
7.4
25.1
26.6
15.6
N/A
N/A
N/A
4.5
N/A
2001
111
133
0.66
N/A
24.7
7.5
26.0
25.8
22.7
N/A
N/A
N/A
6.1
N/A
2000
103
120
0.63
N/A
25.2
6.3
26.2
27.9
24.9
N/A
N/A
N/A
6.4
N/A
Natural disasters
Type
Memphis
Southeast Montgomery
Tornado activity compared to U.S. average
198.6%
174%
Earthquake activity compared to U.S. average
474%
69.7%
Natural disasters compared to U.S. average
18%
30%
Transportation
Memphis has a bus system and trolley service, but many residents prefer to drive. Southeast Montgomery also primarily relies on cars, but benefits from the more developed public transportation of Houston, including an extensive bus system and light rail transit.
Transport
Type
Memphis
Southeast Montgomery
Amtrak stations
1
0
Amtrak stations nearby
1
0
FAA registered aircraft
1
0
FAA registered aircraft manufacturers and dealers
52
0
Means of transportation to work
Type
Memphis
Southeast Montgomery
Bicycle
0%
0.2%
Bus
0.4%
1.4%
Carpooled
7.5%
13.6%
Car alone
88.8%
79.1%
Motorcycle
0.1%
0.1%
Walked
1.2%
1.1%
Average travel time to work
Type
Memphis
Southeast Montgomery
Average
27 min
32 min
Real Estate
The Memphis real estate market is generally affordable, with a median home value lower than the national average. In contrast, Southeast Montgomery has a higher median home value, reflecting its status as a more upscale community.
Neighborhoods
Memphis's neighborhoods range from vibrant downtown areas to quieter suburban communities. Southeast Montgomery offers a variety of upscale residential areas, rural communities, and new developments associated with the Houston metropolitan area's growth.
Houses and residents
Type
Memphis
Southeast Montgomery
Houses
288,491
77,705
Average household size (people)
2.5
2.8
Houses occupied
256,968 (89.1%)
72,515 (93.3%)
Houses occupied by owners
119,622 (46.6%)
53,683 (74%)
Houses occupied by renters
137,346 (53.4%)
18,832 (26%)
Median rent asked for vacant for-rent units
$760.83
$1,329
Median price asked for vacant for-sale houses and condos
$201,932
$298,290
Estimated median house or condo value
$142,800
$288,981
Median number of rooms in apartments
4.8
4
Median number of rooms in houses and condos
6.6
6.8
Renting percentage
48.1%
30.6%
Housing density (houses/condos per square mile)
1,032.8
160.6
Household income disparities
48.2%
43.3%
Housing units without a mortgage
1,461 (2%)
10,543 (25.7%)
Housing units with both a second mortgage and home equity loan
3,970 (5.4%)
21 (0.1%)
Housing units with a mortgage
71,386 (98%)
30,480 (74.3%)
Housing units with a home equity loan
322 (0.4%)
1,769 (4.3%)
Housing units with a second mortgage
5,907 (8.1%)
1,550 (3.8%)
Housing units lacking complete kitchen facilities
5.7%
1.1%
Housing units lacking complete plumbing facilities
Self-employed workers in own not incorporated business
16,111
6,391
State government workers
7,650
3,200
Unpaid family workers
668
296
Industries and Occupations
In Memphis, the biggest industries are healthcare, education, and shipping, with major occupations in office and administrative support, sales, and management. Southeast Montgomery, located in the Houston metropolitan area, caters to industries such as oil and gas, healthcare, and aerospace.
Memphis offers various comprehensive medical facilities, including the renowned St. Jude Children's Research Hospital. Southeast Montgomery, with the nearby Houston Medical Center, the world's largest medical complex, provides access to world-class healthcare facilities.
Health (county statistics)
Type
Memphis
Southeast Montgomery
General health status score of residents in this county from 1 (poor) to 5 (excellent)
Memphis's infrastructure supports its cultural heritage and economical industries well, having been established long before Southeast Montgomery. In contrast, Southeast Montgomery, as a part of the Houston metropolitan area, benefits from the larger city's infrastructure, which includes modern highways, healthcare facilities, and retail centers.
Infrastructure
Type
Memphis
Southeast Montgomery
TV stations
14
27
Culture and Food
Memphis is renowned for its rich cultural heritage, particularly in music and arts, with a food scene dominated by its world-famous barbecues. Southeast Montgomery, influenced by Houston's diversity, offers a range of cultural experiences and a food scene that includes Tex-Mex, seafood, and its renowned barbecue as well.
Sports Teams
Memphis is home to the Memphis Grizzlies (NBA) and has a strong affinity for college sports. Southeast Montgomery residents generally support Houston-based teams, such as the Houston Texans (NFL), Houston Rockets (NBA), and Houston Astros (MLB).
 Memphis, TN
 Southeast Montgomery, TX