Memphis, TN and Raleigh, NC are both alluring cities with their unique appeal and varied lifestyle. Memphis offers a gritty and historical ambiance steeped in music, while Raleigh boasts progressive technological advancements with a dash of southern charm. While both cities have a strong cultural backbone, their differences in aspects such as economy, education, and taxation systems may influence your decision whether one should move or simply visit.
Distance between
Memphis, TN and
Raleigh, NC : 638.8 miles
Memphis's population is larger by 34%. Its population has decreased by 21,973 people (3.4%) since 2000. The population of Raleigh has grown by 193,031 people (69.9%) during that time.
Regrettably, Memphis has a higher crime rate than the national average, with property crime being a prevalent issue, though efforts are continually made by the local government to improve security. Conversely, Raleigh has a crime rate that is noticeably lower than the national average. It is perceived as one of the safer cities in the U.S., making it ideal for both relocation and tourism.
City-data.com crime index counts serious crimes and violent crime more heavily. It adjusts for the number of visitors and daily workers commuting into cities. (higher means more crime, U.S. average = 301.1)
City-data.com crime index counts serious crimes and violent crime more heavily. It adjusts for the number of visitors and daily workers commuting into cities. (higher means more crime, U.S. average = 301.1)
Sex Offenders
According to our data, there are 2,614 registered sex offenders living in Memphis and 2,186 registered sex offenders living in . The ratio of residents to sex offenders in Memphis is 250 to 1; the ratio in Raleigh is 210 to 1. The number of registered sex offenders compared to the number of residents in Memphis is near to than in Raleigh.
Cost of Living
The cost of living in Memphis is relatively lower than in Raleigh. This includes expenses like housing, groceries, utilities, and transportation. However, this does not necessarily mean a lower quality of life. Raleigh, while more expensive, offers a high standard of living and has continually been ranked as one of the best places to live in the U.S.
Income Tax
Tennessee doesn't levy a state income tax, a relieving fact for those living in Memphis. Contrastly, North Carolina does impose a flat state income tax rate of 5.25%, which applies to all residents and non-residents who earn income in the state.
Property Tax
Property taxes in Memphis and Shelby County are relatively higher compared to other parts of the country. The exact rate depends on the property's location. In Raleigh, the property tax rates are much lower, which may be more appealing to prospective homebuyers.
Sales Tax
The combined sales tax rate for Memphis is 9.75%, one of the highest in the country. This includes both Tennessee's state sales tax and Shelby County's sales tax. Raleigh, in comparison, has a lower combined sales tax rate of 7.25%.
Income
Type
Memphis
Raleigh
Estimated median household income
$44,317
$74,612
Estimated per capita income
$28,571
$44,001
Cost of living index (U.S. average is 100)
85.5
95.1
If you make $50,000 in Memphis, you will have to make $55,614 in Raleigh to maintain the same standard of living.
Geographical Conditions
Memphis is located on the Mississippi River and having a relatively flat landscape. The proximity to the river has made Memphis a historical logistical hub. Raleigh is known as the "City of Oaks" for its numerous oak trees and is placed on the Atlantic Seaboard fall line, benefiting from both coastal plains and rolling hills.
Both cities have respectable education systems. Raleigh is known for its high quality schools with a high graduation rate and is nearby to prominent universities like Duke University and the University of North Carolina. Memphis also has a strong education system with the University of Memphis and Rhodes College offering good higher education options.
The economy of Memphis primarily hinges on sectors such as transportation, commerce, and finance. FedEx Corporation, one of the city's largest employers, has its headquarters in Memphis. Raleigh, part of the 'Research Triangle' with Durham and Chapel Hill, boasts a robust economy with strongholds in tech, education, healthcare, and banking sectors. It is a top city for jobs and has fast-growing startups and tech companies.
Biggest Employers
In Memphis, FedEx, International Paper, and AutoZone are major employers. Healthcare providers like Baptist Memorial Health Care and St. Jude Children's Research Hospital also play a significant role. In Raleigh, top employers include tech giants such as IBM and Cisco Systems, along with health care providers like WakeMed Health & Hospitals and UNC Rex Healthcare.
In Memphis (Shelby County), 62.9% voted for Democrats and 36.7% for Republicans in 2012 Presidential Election. In Raleigh (Wake County), 54.9% voted for Democrats and 43.5% for Republicans.
Elections
Type
Democrats
Republicans
Other
Year
Memphis
Raleigh
Memphis
Raleigh
Memphis
Raleigh
2020
64.8%
62.3%
34.2%
35.9%
1.1%
1.8%
2016
62.3%
57.4%
34.7%
37.2%
3.1%
5.5%
2012
62.9%
54.9%
36.7%
43.5%
0.4%
1.6%
2008
63.8%
56.8%
36.2%
42.3%
0.0%
0.9%
2004
57.7%
48.7%
42.0%
50.9%
0.3%
0.4%
2000
56.8%
46.1%
42.3%
53.2%
0.9%
0.7%
1996
78.9%
45.9%
19.6%
48.2%
1.5%
5.9%
Breakdown of population affiliated with a religious congregation
Type
Adherents
Congregations
Religion
Memphis
Raleigh
Memphis
Raleigh
SOUTHERN BAPTIST CONVENTION
14.8%
9.0%
15.1%
22.5%
CATHOLIC CHURCH
6.5%
11.0%
2.7%
2.4%
EVANGELICAL PRESBYTERIAN CHURCH
1.5%
0.0%
0.7%
0.3%
EPISCOPAL CHURCH
0.8%
1.1%
1.8%
1.8%
MUSLIM ESTIMATE
0.5%
1.1%
0.8%
1.0%
LUTHERAN CHURCH
0.4%
0.4%
1.0%
0.6%
PRESBYTERIAN CHURCH IN AMERICA
0.4%
0.2%
0.6%
1.5%
SEVENTH DAY ADVENTIST CHURCH
0.4%
0.2%
0.9%
1.0%
AMERICAN BAPTIST CHURCHES IN THE USA
0.3%
0.4%
0.6%
0.6%
EVANGELICAL LUTHERAN CHURCH IN AMERICA
0.1%
0.6%
0.4%
1.1%
Weather
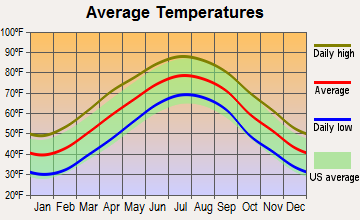
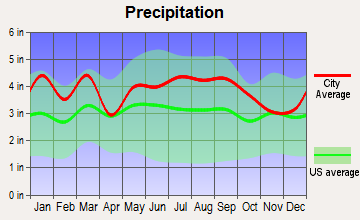
Memphis experiences a somewhat humid subtropical climate with hot summers and mild winters. The city gets a lot of rainfall throughout the year, even in the driest month. Raleigh, on the other hand, has a slightly cooler climate, with four distinct seasons including a warm summer and colder winters compared to Memphis, which can appeal to those who prefer a change of season.
Weather and climate
Type
Memphis
Raleigh
Temperature - Average
61.9°F
59.8°F
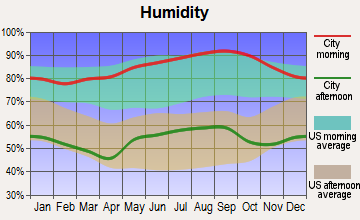
Humidity - Average morning or afternoon humidity
74%
73.7%
Humidity - Differences between morning and afternoon humidity
33%
44%
Humidity - Maximum monthly morning or afternoon humidity
85%
90%
Humidity - Minimum monthly morning or afternoon humidity
52%
46%
Precipitation - Yearly average
54.3 in
46.2 in
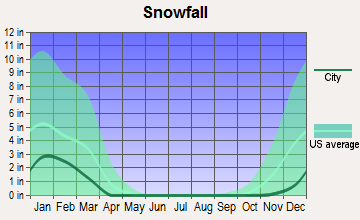
Snowfall - Yearly average
8.6 in
13.4 in
Clouds - Number of days clear of clouds
19.7%
18.5%
Sunshine amount - Average
68.7%
63.9%
Sunshine amount - Differences during a year
24%
13%
Sunshine amount - Maximum monthly
74%
64%
Sunshine amount - Minimum monthly
50%
51%
Wind speed - Average
8.8 mph
7.1 mph
Average climate in Memphis, Tennessee
Average climate in Raleigh, North Carolina
Air pollution
Type
AQI
CO
NO2
OZONE
PM10
PM25
SO2
Year
Memphis
Raleigh
Memphis
Raleigh
Memphis
Raleigh
Memphis
Raleigh
Memphis
Raleigh
Memphis
Raleigh
Memphis
Raleigh
2018
81
71
0.24
0.23
10.4
4.9
27.1
27.5
19.0
14.6
8.1
9.5
0.4
0.2
2017
74
70
0.24
0.23
10.2
5.5
28.1
25.8
17.5
14.7
7.9
9.3
0.3
0.2
2016
76
80
0.24
0.23
10.2
5.6
28.8
26.9
19.6
8.7
8.5
10.0
0.9
0.3
2015
77
79
0.26
0.27
11.1
5.7
26.9
28.6
N/A
12.4
9.2
11.0
1.0
0.3
2014
75
74
0.27
0.26
10.1
6.0
26.5
29.9
N/A
N/A
9.9
11.2
1.3
0.3
2013
74
72
0.31
0.26
8.3
N/A
26.6
26.9
N/A
N/A
10.2
10.7
1.0
0.4
2012
94
80
0.32
0.28
9.3
N/A
29.7
29.7
N/A
N/A
10.7
9.5
0.6
0.6
2011
93
84
0.34
0.27
10.0
N/A
29.0
32.9
N/A
N/A
11.1
10.3
0.5
0.7
2010
95
89
0.43
0.30
10.3
N/A
27.9
32.4
N/A
N/A
12.9
10.9
N/A
1.0
2009
86
77
0.35
0.30
8.7
N/A
24.9
27.8
N/A
N/A
11.8
10.3
N/A
1.0
2008
94
99
0.36
0.36
10.3
N/A
26.3
32.3
N/A
N/A
13.2
12.5
N/A
1.4
2007
106
98
0.47
0.40
11.2
N/A
26.7
35.7
N/A
N/A
14.8
13.9
5.6
1.2
2006
108
90
0.43
0.44
13.0
N/A
26.8
31.9
N/A
N/A
14.7
13.5
6.3
0.9
2005
110
80
0.46
0.38
10.1
N/A
26.9
33.9
N/A
N/A
17.9
N/A
4.9
2.5
2004
98
82
0.51
0.40
N/A
N/A
24.9
28.4
N/A
N/A
14.5
N/A
5.9
2.6
2003
110
82
0.57
N/A
20.1
N/A
25.3
29.9
N/A
N/A
15.0
N/A
5.8
3.0
2002
110
89
0.58
N/A
20.4
N/A
25.1
36.1
15.6
N/A
N/A
N/A
4.5
2.6
2001
111
128
0.66
N/A
24.7
N/A
26.0
34.5
22.7
N/A
N/A
N/A
6.1
N/A
2000
103
115
0.63
0.64
25.2
N/A
26.2
34.1
24.9
N/A
N/A
N/A
6.4
N/A
Natural disasters
Type
Memphis
Raleigh
Tornado activity compared to U.S. average
198.6%
95.1%
Earthquake activity compared to U.S. average
474%
52.6%
Natural disasters compared to U.S. average
18%
18%
Transportation
Memphis uses the Memphis Area Transit Authority (MATA) for public transportation, which includes buses and trolleys. However, most Memphians prefer to drive. Raleigh has a similar scenario where most residents drive. Still, Raleigh also offers the GoRaleigh bus system and the GoTriangle system that connects Raleigh, Durham, and Chapel Hill.
Transport
Type
Memphis
Raleigh
Amtrak stations
1
1
Amtrak stations nearby
1
3
FAA registered aircraft
1
499
FAA registered aircraft manufacturers and dealers
52
12
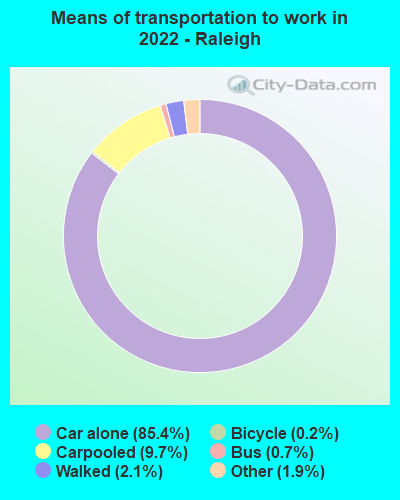
Means of transportation to work
Type
Memphis
Raleigh
Bicycle
0%
0.2%
Bus
0.4%
1.1%
Carpooled
7.5%
8.5%
Car alone
88.8%
87.4%
Motorcycle
0.1%
0.1%
Taxicab
0.1%
0.3%
Walked
1.2%
1.1%
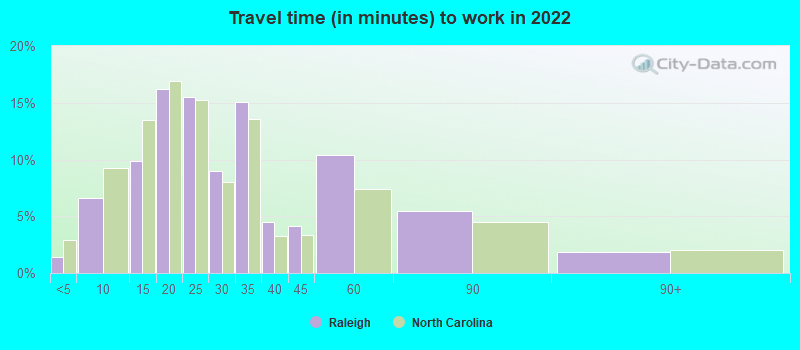
Average travel time to work
Type
Memphis
Raleigh
Average
27 min
29.4 min
Other means
22.5 min
22.5 min
Public transportation
43.5 min
39.9 min
Private vehicle occupancy
Type
Memphis
Raleigh
Average
1.1
1.1
Drove alone
89.9%
90.1%
In 2 person carpool
7.9%
7.6%
In 3 person carpool
1.6%
1.4%
In 4 person carpool
0.4%
0.3%
In 5-6 person carpool
0.2%
0.6%
How many people usually rode to work in the car, truck or van.
Real Estate
The housing market in Memphis is more affordable than Raleigh. The median home price in Memphis is far lower than Raleigh, making it potentially more attractive for prospective homeowners on a budget. Raleigh, while more expensive, offers a more robust housing market with considerable appreciation.
Neighborhoods
Memphis neighborhoods vary from the historical to the contemporary, each with unique charm. Midtown's Cooper-Young district is known for its trendy vibe and arts scene. Raleigh's neighborhoods, from the historic Oakwood to the family-friendly North Raleigh, provide diverse living options to suit various lifestyle needs.
Houses and residents
Type
Memphis
Raleigh
Houses
288,491
217,866
Average household size (people)
2.5
2.4
Median year apartment built
1972
1995
Median year house/condo built
1967
1995
Length of stay in the house since moving in
16.2 years
11.5 years
Houses occupied
256,968 (89.1%)
194,917 (89.5%)
Houses occupied by owners
119,622 (46.6%)
103,367 (53%)
Houses occupied by renters
137,346 (53.4%)
91,550 (47%)
Median rent asked for vacant for-rent units
$760.83
$1,740
Median monthly housing costs
$967
$1,298
Median price asked for vacant for-sale houses and condos
$201,932
$302,120
Estimated median house or condo value
$142,800
$340,200
Median numbers of rooms
5.5
5.1
Median number of rooms in apartments
4.8
3.9
Median number of rooms in houses and condos
6.6
6.7
Median house price - detached houses
$205,904
$446,507
Median house price - in 2-unit structures
Over $1,000,000
$403,968
Median house price - in 3-to-4-unit structures
$145,165
$170,635
Median house price - in 5 or more unit structures
$201,411
$306,998
Median house price - mobile homes
$93,577
$31,622
Median house price - Townhouses or other attached units
$170,154
$292,086
Median house price - All housing units
$204,886
$404,828
Median house age
52
26
Renting percentage
48.1%
46.5%
Housing density (houses/condos per square mile)
1,032.8
1,901.1
House value disparities
44.1%
30.8%
Household income disparities
48.2%
45.4%
Median household income for houses/condes with a mortgage
$72,611
$114,680
Median household income for apartments without a mortgage
$53,615
$81,716
Housing units without a mortgage
1,461 (2%)
1,689 (2.1%)
Housing units with both a second mortgage and home equity loan
3,970 (5.4%)
6,627 (8.2%)
Housing units with a mortgage
71,386 (98%)
78,923 (97.9%)
Housing units with a home equity loan
322 (0.4%)
0 (0%)
Housing units with a second mortgage
5,907 (8.1%)
7,783 (9.7%)
House/condo owner moved in on average (years ago)
16
8
House/condo renter moved in on average (years ago)
1
1
Housing units lacking complete kitchen facilities
5.7%
0.6%
Housing units lacking complete plumbing facilities
4.6%
0.5%
Housing units in structures
Housing units in structures
Memphis
Raleigh
One, detached
61.0%
45.0%
One, attached
5.8%
14.0%
Two
2.1%
1.2%
3 or 4
7.4%
4.6%
5 to 9
9.1%
6.3%
10 to 19
5.6%
12.4%
20 to 49
1.8%
6.0%
50 or more
6.2%
9.2%
Mobile homes
0.8%
1.2%
Boats, RVs, vans, etc.
0.1%
0.0%
Median real estate property taxes paid for housing units
Self-employed workers in own not incorporated business
16,111
12,488
State government workers
7,650
19,792
Unpaid family workers
668
523
Industries and Occupations
Memphis' dominant industries are transportation, shipping, and logistics, with FedEx being the top employer. Healthcare is also a primary field. Raleigh has a diverse economy. Its thriving tech sector, formed from semiconductor, software, and telecom companies, is complimented by the pharmaceutical, food processing, and textile production industries.
Health care in Memphis is admirable with facilities like Baptist Memorial Healthcare and the St. Jude Children's Research Hospital. It's a regional hub for treatments. Raleigh's healthcare is also strong, having top-rated hospitals like UNC REX Healthcare and Duke Health Raleigh Hospital, making it a preferred destination for specialized medical care.
Health (county statistics)
Type
Memphis
Raleigh
General health status score of residents in this county from 1 (poor) to 5 (excellent)
Memphis has a well-established infrastructure providing its inhabitants with all necessary facilities, from parks to public resources. However, it may lack the advanced technological infrastructure of Raleigh, which is known for its remarkable infrastructure that supports its high-tech economy.
Infrastructure
Type
Memphis
Raleigh
Hospitals
35
19
TV stations
14
20
Arenas or stadiums
2
3
Bank branches located here
160
136
Bank institutions located here
33
27
Main business address for public companies
17
21
Nuclear power plants nearby
0
1
Drinking water stations with no reported violations in the past
0
2
Drinking water stations with reported violations in the past
HMDA - Conventional home purchase loans - Applications denied
Year
Memphis
Raleigh
1999
2,195
1,618
2000
2,406
890
2001
1,775
557
2002
1,444
510
2003
2,116
564
2004
3,266
700
2005
4,730
1,083
2006
5,833
1,097
2007
3,559
859
2008
1,174
424
2009
345
253
Culture and Food
Memphis is widely known for its rich cultural scene, particularly its influence on blues music and the birthplace of rock 'n' roll. The city's soul food and barbecue scene is iconic. Raleigh holds a dynamic blend of southern traditions and progressive cultural experiences, from arts festivals to diverse culinary delights, such as their famous Carolina-style barbecue.
Sports Teams
Memphis is home to NBA's Grizzlies and minor league baseball's Redbirds. College basketball is also quite popular due to the University of Memphis Tigers. Raleigh hosts NHL's Carolina Hurricanes. College basketball looms large with fans, thanks to nearby storied programs at the University of North Carolina and Duke.


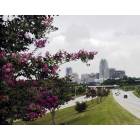
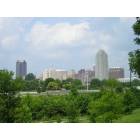
 Memphis, TN
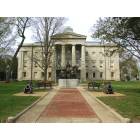
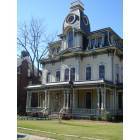
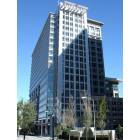
 Raleigh, NC