Memphis, TN vs Louisville, KY - Advanced U.S. city comparison tool

Memphis, TN vs Louisville, KY

The question of whether to live in Memphis, TN or Louisville, KY is dependent on various factors that contribute to the quality of life. These factors vary from safety, weather, cost of living, to cultural experiences, and they all contribute to the attractiveness of a city to both residents and tourists. This comparison aims to highlight these aspects, enabling you to make an informed decision based on your personal preferences and needs.
 
 
Distance between Memphis, TN and Louisville, KY : 317.6 miles

Memphis's population is larger by 139%. Its population has decreased by 21,973 people (3.4%) since 2000.

Population
Type Memphis Louisville
Population 628,127 262,764
Female / male percentage 52.8% / 47.2%
52.8%
47.2%
52.7% / 47.3%
52.7%
47.3%
Racial makeup - percentage
Ethnicity MemphisLouisville
Black 63.4% 32.8%
White Non-Hispanic 23.5% 61.9%
Hispanic 8.5% 1.9%
Two or more 2.4% 1.5%
Asian 1.6% 1.4%
American Indian 0.1% 0.2%
Racial makeup - absolute values
Ethnicity MemphisLouisville
Black 398,220 84,011
White Non-Hispanic 147,318 158,651
Hispanic 53,666 4,755
Two or more 15,236 3,923
Asian 9,745 3,676
Pacific Islander 513 101
American Indian 509 549

Crime and Safety

Safety is a priority in any location, and both cities have diverse crime rates. Memphis has a higher crime rate compared to the national average, contributing to a perception of lower safety levels. However, ongoing efforts are being made to enhance safety. Louisville's crime rate is also above the national average, but lower than Memphis, suggesting a relatively safer environment.

Cost of Living

Cost of living largely depends on factors such as housing, groceries, utilities, and transportation. Memphis has a lower cost of living compared to the national average making it an attractive option for those looking to stretch their dollar. Similarly, Louisville also has a cost of living below the national average, but slightly higher than Memphis.

Income Tax

Tennessee, and therefore Memphis, does not impose a state income tax on wages and salaries, which is an attraction for many. Kentucky has a statewide flat income tax rate of 5%, which applies to Louisville.

Property Tax

Property taxes in Memphis and Louisville are near the national average, with Memphis rates slightly higher than those of Louisville. It's crucial to note that annual tax costs can vary greatly based on the local municipality and the value of the property.

Sales Tax

Sales tax in Memphis is higher at 9.25% compared to Louisville's 6%. These rates combine both state and local sales taxes.
Income
Type Memphis Louisville
Estimated median household income $44,317 $44,270
Estimated per capita income $28,571 $29,894
Cost of living index (U.S. average is 100) 85.5 94.1

If you make $50,000 in Memphis, you will have to make $55,029 in Louisville to maintain the same standard of living.

Geographical Conditions

Memphis, located along the Mississippi River, offers a blend of flat and hilly terrain. Louisville, positioned around the Ohio River, presents a varied geographical profile with flatlands to the west and knobs region to the south and east.
Geographical information
Type Memphis Louisville
Land area 279.3 sq. miles 62.1 sq. miles
Population density 2,248.8 people per sq. mile 4,230.1 people per sq. mile
Elevation 254 feet 462 feet
Relative area comparison
Memphis, TN Louisville, KY
First ancestry reported - percentage
Ancestry MemphisLouisville
English 2.4% 7.8%
Irish 1.8% 11.2%
German 1.2% 15.2%
Italian 0.7% 1.7%
Scotch-Irish 0.5% 1.5%
Scottish 0.5% 1.4%
Polish 0.2% 0.7%
French 0.2% 1.7%
Norwegian 0.2% 0.2%
Swedish 0.1% 0.3%
Arab 0.1% 0.5%
Russian 0.1% 0.4%
Dutch 0.1% 1.1%
French Canadian 0.1% 0.2%
Welsh 0.1% 0.5%
Subsaharan African 0.0% 1.0%
Swiss 0.0% 0.5%
United States 0.0% 8.7%
Population origin - absolute values
Ancestry MemphisLouisville
English 11,171 19,923
Irish 8,107 28,741
German 5,405 38,979
Italian 3,410 4,469
Scotch-Irish 2,266 3,833
Scottish 2,122 3,603
French 993 4,464
Polish 981 1,859
Norwegian 818 518
Arab 691 1,203
Welsh 569 1,237
Dutch 460 2,863
Russian 453 1,002
Swedish 391 845
Greek 297 377
French Canadian 264 546
Czech 174 247
Portuguese 122 166
Lithuanian 109 243
Ukrainian 84 219
Foreign born residents - absolute values
Type Count
Region MemphisLouisville
All 39,553 9,650
Africa 4,450 811
Asia 8,483 3,264
Europe 2,040 2,595
Latin America 23,361 2,755
North America 368 183
Oceania 59 42
Foreign born residents - percentage
Type Percentage
Region MemphisLouisville
All 6.3% 3.8%
Africa 0.7% 0.3%
Asia 1.3% 1.3%
Europe 0.3% 1.0%
Latin America 3.7% 1.1%

Education

The education sector in both cities boasts of some of the finest schools and universities. Memphis's education system is a combination of public, private, and charter schools, including recognized universities like the University of Memphis. Louisville also boasts of premier education institutions, such as the University of Louisville and Jefferson Community and Technical College.
School enrollment
Type Memphis Louisville
Nursery, preschool 7,762 (5.3%) 4,341 (6.5%)
Kindergarten 10,594 (7.2%) 3,474 (5.2%)
Grade 1 to 4 30,949 (21%) 14,388 (21.4%)
Grade 5 to 8 34,112 (23.1%) 14,301 (21.3%)
Grade 9 to 12 32,817 (22.2%) 13,558 (20.2%)
College undergrad 23,180 (15.7%) 13,054 (19.4%)
Graduate or professional 8,114 (5.5%) 4,127 (6.1%)
Students in private schools - absolute values
Type Count
Grade MemphisLouisville
Grades 1 to 8 (elementary and middle school) 7,665 4,496
Grades 9 to 12 (high school) 3,744 2,042
Undergraduate colleges 6,567 2,985
Students in private schools - percentage
Type Percentage
Grade MemphisLouisville
Grades 1 to 8 (elementary and middle school) 11.8% 15.7%
Grades 9 to 12 (high school) 11.4% 15.1%
Undergraduate colleges 28.3% 22.9%
Educational attainment
Type Memphis Louisville
Less than high school 12.8% 23.9%
High school or equiv. 30% 28.9%
Less than 1 year of college 5% 6.8%
1 or more years of college 17.4% 14.3%
Associate degree 6.5% 4.8%
Bachelor's degree 17.6% 12.6%
Master's degree 7.2% 5.7%
Profess. school degree 2% 2.2%
Doctorate degree 1.5% 0.8%
Education level (25-year-olds and older)
Type Memphis Louisville
Bachelor's degree or higher 28.3% 21.3%
Graduate or professional degree 10.7% 8.7%
High school or higher 87.2% 76.1%

Work and Economy

Memphis's economy is diverse with major sectors being trade, transportation, utilities, education, health, and manufacturing. Louisville's economy is also diversified with healthcare, manufacturing, and logistics being key economic drivers.

Biggest Employers

In Memphis, FedEx is one of the largest employers, alongside International Paper and AutoZone. In Louisville, UPS, Ford, and healthcare providers including Norton Healthcare and University of Louisville Hospital are top employers.
Employment and residency - absolute values
Kind MemphisLouisville
Work and live in this city 231,355 67,206
Work and live in this county 254,954 N/A
Workers who work outside the city they live in 418,745 189,025
Workers who work outside the county they live in 18,159 N/A
Working at home 28,812 N/A
Not working at home 244,301 N/A
Daytime population change due to commuting 102,743 80,342
Employment and residency - percentage
Kind MemphisLouisville
Work and live in this city 84.1% 60.6%
Work and live in this county 93.4% N/A
Workers who work outside the city they live in 15.9% 39.4%
Workers who work outside the county they live in 6.6% N/A
Working at home 10.5% N/A
Not working at home 89.5% N/A
Daytime population change due to commuting 15.8% 31.4%

In Memphis (Shelby County), 62.9% voted for Democrats and 36.7% for Republicans in 2012 Presidential Election. In Louisville (Jefferson County), 55.0% voted for Democrats and 43.8% for Republicans.

Elections
Type DemocratsRepublicansOther
Year MemphisLouisvilleMemphisLouisvilleMemphisLouisville
2020 64.8% 59.2% 34.2% 39.1% 1.1% 1.7%
2016 62.3% 54.1% 34.7% 40.8% 3.1% 5.2%
2012 62.9% 55.0% 36.7% 43.8% 0.4% 1.2%
2008 63.8% 55.6% 36.2% 43.5% 0.0% 0.9%
2004 57.7% 50.6% 42.0% 48.9% 0.3% 0.5%
2000 56.8% 49.8% 42.3% 48.2% 0.9% 2.0%
1996 78.9% 51.5% 19.6% 41.0% 1.5% 7.4%
Breakdown of population affiliated with a religious congregation
Type AdherentsCongregations
Religion MemphisLouisvilleMemphisLouisville
SOUTHERN BAPTIST CONVENTION 14.8% 14.3% 15.1% 25.0%
CATHOLIC CHURCH 6.5% 16.3% 2.7% 8.5%
EVANGELICAL PRESBYTERIAN CHURCH 1.5% 0.0% 0.7% 0.0%
EPISCOPAL CHURCH 0.8% 0.9% 1.8% 2.6%
MUSLIM ESTIMATE 0.5% 0.9% 0.8% 1.4%
LUTHERAN CHURCH 0.4% 0.2% 1.0% 0.7%
PRESBYTERIAN CHURCH IN AMERICA 0.4% 0.0% 0.6% 0.4%
SEVENTH DAY ADVENTIST CHURCH 0.4% 0.3% 0.9% 1.0%
EVANGELICAL LUTHERAN CHURCH IN AMERICA 0.1% 0.4% 0.4% 1.6%

Weather

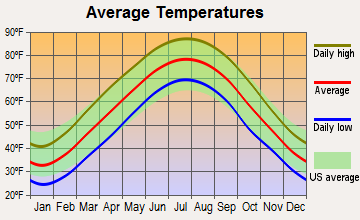
Memphis experiences milder winters compared to Louisville, with temperatures rarely going below 30°F. Summers in Memphis are hot and humid. Louisville experiences colder winters with temperatures occasionally dipping below freezing, and warm, humid summers. The cities have comparable climates overall, with the notable difference being the colder winters in Louisville.
Weather and climate
Type Memphis Louisville
Temperature - Average 61.9°F 56.9°F
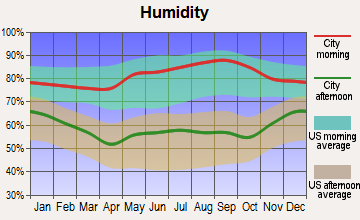
Humidity - Average morning or afternoon humidity 74% 73.6%
Humidity - Differences between morning and afternoon humidity 33% 35%
Humidity - Maximum monthly morning or afternoon humidity 85% 85%
Humidity - Minimum monthly morning or afternoon humidity 52% 50%
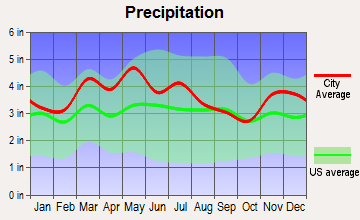
Precipitation - Yearly average 54.3 in 43.8 in
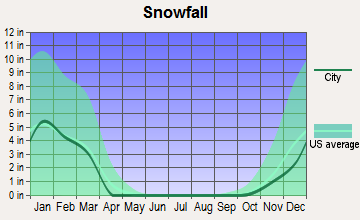
Snowfall - Yearly average 8.6 in 31.4 in
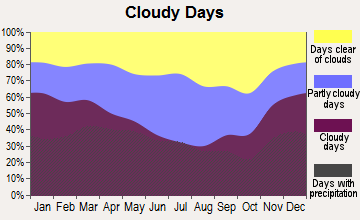
Clouds - Number of days clear of clouds 19.7% 15.5%
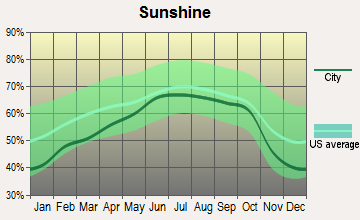
Sunshine amount - Average 68.7% 59.8%
Sunshine amount - Differences during a year 24% 25%
Sunshine amount - Maximum monthly 74% 66%
Sunshine amount - Minimum monthly 50% 41%
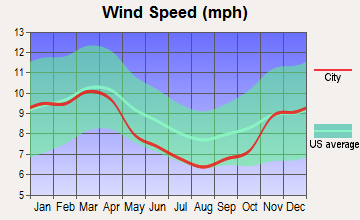
Wind speed - Average 8.8 mph 8.4 mph

Average climate in Memphis, Tennessee

Chicago, Illinois average temperatures Chicago, Illinois average precipitation Chicago, Illinois humidity Chicago, Illinois wind speed Chicago, Illinois snowfall Chicago, Illinois sunshine Chicago, Illinois clear and cloudy days
 

Average climate in Louisville, Kentucky

Chicago, Illinois average temperatures Chicago, Illinois average precipitation Chicago, Illinois humidity Chicago, Illinois wind speed Chicago, Illinois snowfall Chicago, Illinois sunshine Chicago, Illinois clear and cloudy days
 

Air pollution
Type AQICONO2OZONEPM10PM25SO2
Year MemphisLouisvilleMemphisLouisvilleMemphisLouisvilleMemphisLouisvilleMemphisLouisvilleMemphisLouisvilleMemphisLouisville
2018 81 89 0.24 0.27 10.4 11.9 27.1 25.5 19.0 18.2 8.1 9.7 0.4 0.8
2017 74 77 0.24 0.27 10.2 12.2 28.1 26.5 17.5 17.3 7.9 9.2 0.3 0.6
2016 76 91 0.24 0.30 10.2 11.6 28.8 26.7 19.6 15.9 8.5 9.0 0.9 0.6
2015 77 92 0.26 0.31 11.1 12.3 26.9 25.4 N/A 17.4 9.2 10.7 1.0 1.0
2014 75 92 0.27 0.32 10.1 12.8 26.5 26.1 N/A 18.3 9.9 12.0 1.3 2.0
2013 74 83 0.31 N/A 8.3 N/A 26.6 27.8 N/A 16.9 10.2 12.0 1.0 2.1
2012 94 102 0.32 N/A 9.3 N/A 29.7 26.2 N/A 19.2 10.7 12.7 0.6 2.6
2011 93 111 0.34 N/A 10.0 N/A 29.0 26.9 N/A 19.7 11.1 13.3 0.5 3.1
2010 95 109 0.43 N/A 10.3 N/A 27.9 27.3 N/A 21.7 12.9 13.2 N/A 3.1
2009 86 90 0.35 N/A 8.7 13.6 24.9 27.5 N/A 18.9 11.8 13.4 N/A 3.1
2008 94 101 0.36 0.35 10.3 15.5 26.3 29.6 N/A 20.6 13.2 15.0 N/A 4.3
2007 106 111 0.47 0.44 11.2 15.9 26.7 32.0 N/A 24.0 14.8 14.8 5.6 5.9
2006 108 80 0.43 0.66 13.0 15.2 26.8 26.5 N/A 22.6 14.7 N/A 6.3 3.7
2005 110 86 0.46 0.39 10.1 16.9 26.9 27.4 N/A 24.6 17.9 N/A 4.9 4.1
2004 98 77 0.51 0.36 N/A 16.8 24.9 26.2 N/A 22.3 14.5 N/A 5.9 4.6
2003 110 83 0.57 0.46 20.1 17.9 25.3 24.6 N/A 24.0 15.0 N/A 5.8 5.0
2002 110 95 0.58 0.49 20.4 17.6 25.1 27.2 15.6 N/A N/A N/A 4.5 4.4
2001 111 95 0.66 0.56 24.7 18.2 26.0 28.3 22.7 N/A N/A N/A 6.1 5.6
2000 103 103 0.63 0.53 25.2 15.7 26.2 27.8 24.9 N/A N/A N/A 6.4 7.6
Natural disasters
Type Memphis Louisville
Tornado activity compared to U.S. average 198.6% 165.7%
Earthquake activity compared to U.S. average 474% 213%
Natural disasters compared to U.S. average 18% 17%

Transportation

Memphis offers several public transportation options, including MATA buses and trolleys, while commuting is also facilitated by a network of highways and Memphis International Airport. Louisville also offers a reliable public transportation system with TARC buses, and the Louisville International Airport aids in intercity and interstate commuting.
Transport
Type Memphis Louisville
Amtrak stations 1 0
Amtrak stations nearby 1 1
FAA registered aircraft 1 655
FAA registered aircraft manufacturers and dealers 52 4
Means of transportation to work
Type Memphis Louisville
Bicycle 0% 0.4%
Bus 0.4% 6.7%
Carpooled 7.5% 12.6%
Car alone 88.8% 73.5%
Walked 1.2% 4.1%
Means of transportation to work
Average travel time to work
Type Memphis Louisville
Average 27 min 21.1 min
Travel time to work
Time leaving to work
Travel time to work
Time leaving to work

Real Estate

The median home price in Memphis is lower than the national average, which translates to relatively affordable housing. In Louisville, the situation is similar, with the median home price being slightly above that of Memphis, but still under the national average.

Neighborhoods

Both cities boast diverse neighborhoods that cater to a range of lifestyles. Memphis has neighborhoods like Cooper-Young with a vibrant arts scene and East Memphis known for upscale homes. In Louisville, Old Louisville is popular for Victorian architecture, while The Highlands boasts of a vibrant nightlife.
Houses and residents
Type Memphis Louisville
Houses 288,491 121,107
Average household size (people) 2.5 2.2
Houses occupied 256,968 (89.1%) 111,354 (91.9%)
Houses occupied by owners 119,622 (46.6%) 58,481 (52.5%)
Houses occupied by renters 137,346 (53.4%) 52,873 (47.5%)
Median rent asked for vacant for-rent units $760.83 $753.66
Median price asked for vacant for-sale houses and condos $201,932 $198,186
Estimated median house or condo value $142,800 $180,781
Median number of rooms in apartments 4.8 3.2
Median number of rooms in houses and condos 6.6 5.5
Housing density (houses/condos per square mile) 1,032.8 1,949.6
Household income disparities 48.2% 50.8%
Housing units without a mortgage 1,461 (2%) 19,560 (37%)
Housing units with both a second mortgage and home equity loan 3,970 (5.4%) 121 (0.2%)
Housing units with a mortgage 71,386 (98%) 33,359 (63%)
Housing units with a home equity loan 322 (0.4%) 4,661 (8.8%)
Housing units with a second mortgage 5,907 (8.1%) 4,100 (7.7%)
Housing units lacking complete kitchen facilities 5.7% 1.1%
Housing units lacking complete plumbing facilities 4.6% 0.9%
Housing units in structures
Housing units in structures MemphisLouisville
One, detached 61.0% 58.8%
One, attached 5.8% 1.8%
Two 2.1% 5.3%
3 or 4 7.4% 10.1%
5 to 9 9.1% 7.5%
10 to 19 5.6% 6.8%
20 to 49 1.8% 3.9%
50 or more 6.2% 5.5%
Mobile homes 0.8% 0.3%
Boats, RVs, vans, etc. 0.1% 0.0%
Marital status
Type Memphis Louisville
Divorced 10.4% 14.3%
Never married 46.6% 35.2%
Now married 33.6% 38.5%
Separated 3.7% 3.1%
Widowed 5.7% 8.9%
Class of workers - percentage
Class of Workers MemphisLouisville
Employee of private company 71.6% 68.6%
Private not-for-profit wage and salary workers 7.7% 10.1%
Local government workers 6.7% 6.5%
Self-employed workers in own not incorporated business 5.8% 4.9%
Federal government workers 3.0% 2.6%
State government workers 2.7% 4.5%
Self-employed in own incorporated business 2.2% 2.7%
Unpaid family workers 0.2% 0.3%
Class of workers - absolute values
Class of Workers MemphisLouisville
Employee of private company 199,884 77,857
Federal government workers 8,490 2,940
Local government workers 18,783 7,338
Private not-for-profit wage and salary workers 21,462 11,475
Self-employed in own incorporated business 6,255 3,040
Self-employed workers in own not incorporated business 16,111 5,520
State government workers 7,650 5,067
Unpaid family workers 668 295

Industries and Occupations

The healthcare industry provides a significant number of jobs in both cities. Memphis is home to St. Jude Children's Research Hospital and the Methodist Le Bonheur Healthcare, while in Louisville, the University of Louisville Hospital and Norton Healthcare are major employers. The cities also host a number of logistics and manufacturing companies.
Food environment data per 10,000 residents
Food environment statistics MemphisLouisville
Number of convenience stores (no gas) 4.3 2.8
Number of convenience stores (with gas) 0.5 0.7
Number of full-service restaurants 6.1 6.9
Number of grocery stores 2.1 1.8
Number of supercenters and club stores 0.1 0.2
Food environment - absolute values
Food environment statistics MemphisLouisville
Number of convenience stores (no gas) 386 195
Number of convenience stores (with gas) 49 50
Number of full-service restaurants 556 486
Number of grocery stores 186 127
Number of supercenters and club stores 13 11
Obesity and diabetes
Food environment statistics rate MemphisLouisville
Adult diabetes rate 11.3% 10.6%
Adult obesity rate 32.8% 27.6%
Low-income preschool obesity rate 9.2% 13.4%

Health Care

Both cities boast extensive healthcare systems. Memphis residents rely on institutions like St. Jude Children's Research Hospital and Baptist Memorial Health Care. Louisville offers robust healthcare facilities like University of Louisville Hospital and Norton Healthcare.
Health (county statistics)
Type Memphis Louisville
General health status score of residents in this county from 1 (poor) to 5 (excellent) 3.2 3.2
Average weight of females (lbs) 171 lbs 169.7 lbs
Average weight of males (lbs) 202.5 lbs 200.4 lbs
Residents visited a dentist within the past year 60.4% 65.5%
Residents exercised in the past month 64.6% 66.5%
Adult residents drank alcohol in the past 30 days 42.2% 43.4%
Residents smoked 100+ cigarettes in their lives 41.4% 46.5%

Fatal vehicle accidents per 100,000 residents
Type Total count per 100,000Drunk per 100,000Fatal count per 100,000Pedestrian count per 100,000Person count per 100,000Vehicle count per 100,000
Year MemphisLouisvilleMemphisLouisvilleMemphisLouisvilleMemphisLouisvilleMemphisLouisvilleMemphisLouisville
2021 34.2 38.6 0.0 0.0 38.1 41.4 10.8 10.5 81.2 89.8 61.8 68.7
2020 32.9 42.1 6.8 12.5 35.3 44.1 11.6 14.4 75.2 95.6 54.5 71.8
2019 19.0 34.0 2.5 10.1 20.0 36.7 5.8 11.7 44.4 74.9 31.2 55.4
2018 16.9 25.4 1.1 3.9 18.0 25.8 5.7 9.4 39.6 51.9 27.2 40.6
2017 14.9 33.6 2.1 9.4 15.4 34.7 6.1 12.5 29.2 74.9 23.3 55.4
2016 17.8 32.4 3.2 7.4 18.2 34.0 4.7 8.6 42.0 83.5 30.2 59.7
2015 14.5 30.4 3.5 10.5 15.6 31.2 5.0 7.8 33.9 77.7 24.0 57.4
2014 13.1 23.8 1.1 8.2 13.5 27.3 3.7 6.6 31.4 48.8 21.6 35.1
2013 13.2 30.8 1.7 10.9 13.9 31.2 4.1 7.0 29.1 66.3 21.3 51.5
2012 10.7 22.6 2.0 8.6 11.9 23.0 2.0 3.5 27.3 60.5 17.1 41.4
2011 11.0 22.6 1.1 6.6 11.3 23.0 2.9 6.6 28.1 51.5 18.3 37.1
2010 11.0 25.4 2.6 9.4 11.4 26.5 2.2 8.2 27.1 57.8 16.4 39.4
2009 12.4 19.9 1.6 8.2 13.9 21.9 2.8 3.5 34.3 45.3 21.0 29.3
2008 13.6 26.1 2.1 12.5 14.9 28.5 2.7 10.5 33.3 58.5 22.3 35.5
2007 14.1 29.3 2.2 13.3 15.2 30.1 1.6 5.9 39.7 74.5 24.1 46.4
2006 14.4 28.5 1.6 8.6 15.8 29.3 3.2 7.8 40.6 69.9 23.0 44.9
2005 14.4 33.2 1.2 9.8 15.7 36.3 2.9 6.2 39.1 82.3 24.5 54.6
2004 11.7 26.5 1.6 12.5 13.1 30.1 3.5 6.2 34.9 62.8 20.1 41.8
2003 11.7 30.4 0.4 9.8 13.2 31.6 4.0 7.0 32.9 78.8 18.7 50.0
2002 11.8 25.8 4.7 9.8 13.7 26.9 3.1 4.7 32.0 55.4 18.3 41.0
2001 10.6 21.1 1.0 6.6 12.1 21.9 3.8 3.5 34.1 55.4 18.1 35.5
2000 12.0 30.1 4.8 12.1 13.1 32.8 3.1 7.8 33.2 78.1 19.4 50.0
1999 14.4 17.4 3.3 4.7 16.5 18.2 3.5 5.9 38.8 43.1 21.8 26.1
1998 16.9 12.9 5.9 2.7 17.9 12.9 4.1 6.7 43.6 34.1 24.3 18.4
1997 18.3 10.5 5.6 1.6 19.9 11.7 5.6 7.0 56.7 31.9 30.7 16.4
1996 18.2 13.9 4.9 2.7 20.1 13.9 3.9 5.4 54.7 45.3 31.5 25.9
1995 16.9 11.1 4.2 3.8 18.4 12.7 4.7 1.9 49.2 30.0 29.2 19.2
1994 19.7 7.6 6.0 1.9 21.9 8.0 4.8 2.7 57.7 16.8 29.5 10.7
1993 14.2 8.3 3.5 3.0 15.2 9.1 3.4 4.2 39.2 25.0 22.4 9.5
1992 15.6 6.8 6.1 2.6 17.7 7.2 3.2 2.6 43.7 15.8 25.1 9.8
1991 15.2 10.9 5.3 4.5 15.6 11.2 7.3 3.7 40.8 23.6 22.1 13.9
1990 15.7 10.0 4.7 4.5 17.0 11.5 0.0 0.0 42.8 32.3 23.7 16.3
1989 12.5 10.7 5.4 4.8 14.2 12.5 0.0 0.0 34.4 30.5 19.7 16.5
1988 14.6 4.7 3.9 1.8 16.5 4.7 0.0 0.0 42.1 9.8 23.6 6.2
1987 13.5 10.4 4.2 4.0 14.7 10.8 0.0 0.0 32.8 25.9 20.9 16.2
1986 16.0 8.5 7.5 1.8 17.0 9.3 0.0 0.0 39.1 20.6 24.8 11.0
1985 15.3 8.1 5.9 1.8 16.1 8.5 0.0 0.0 35.3 22.9 22.0 12.7
1984 12.2 11.2 6.0 5.2 12.5 11.2 0.0 0.0 30.5 22.3 18.0 13.9
1983 14.8 14.5 8.2 6.6 16.2 14.8 0.0 0.0 36.8 36.9 21.9 21.0
1982 11.9 13.3 7.7 3.1 13.1 14.0 0.0 0.0 29.3 30.7 17.8 19.8
1981 11.2 9.8 5.4 2.4 12.1 12.2 0.0 0.0 25.1 27.1 16.0 14.2
1980 16.6 15.7 9.1 3.7 18.1 16.4 0.0 0.0 41.9 40.5 25.2 23.4
1979 16.0 18.0 7.1 5.6 16.9 19.0 0.0 0.0 40.8 42.0 25.3 25.9
1978 14.5 14.5 5.6 3.5 15.7 14.8 0.0 0.0 31.5 35.7 18.4 20.9
1977 17.5 24.6 6.9 7.9 19.4 27.7 0.0 0.0 46.0 54.8 25.8 32.4
1976 13.0 13.0 4.7 1.5 15.1 14.5 0.0 0.0 32.8 33.0 18.0 18.2
1975 13.1 12.7 4.7 1.5 15.1 14.2 0.0 0.0 32.9 32.4 18.1 17.9

Fatal vehicle accidents
Type Total countDrunkFatal countPedestrian countPerson countVehicle count
Year MemphisLouisvilleMemphisLouisvilleMemphisLouisvilleMemphisLouisvilleMemphisLouisvilleMemphisLouisville
1975 83 42 30 5 96 47 0 0 209 107 115 59
1976 83 42 30 5 96 47 0 0 209 107 115 59
1977 112 78 44 25 124 88 0 0 294 174 165 103
1978 93 45 36 11 101 46 0 0 202 111 118 65
1979 103 55 46 17 109 58 0 0 263 128 163 79
1980 107 47 59 11 117 49 0 0 271 121 163 70
1981 72 29 35 7 78 36 0 0 161 80 103 42
1982 76 39 49 9 84 41 0 0 187 90 114 58
1983 94 42 52 19 103 43 0 0 234 107 139 61
1984 77 32 38 15 79 32 0 0 193 64 114 40
1985 96 23 37 5 101 24 0 0 222 65 138 36
1986 100 24 47 5 106 26 0 0 244 58 155 31
1987 84 29 26 11 91 30 0 0 204 72 130 45
1988 90 13 24 5 102 13 0 0 260 27 146 17
1989 77 29 33 13 87 34 0 0 211 83 121 45
1990 97 27 29 12 105 31 0 0 265 87 147 44
1991 94 29 33 12 97 30 45 10 253 63 137 37
1992 97 18 38 7 110 19 20 7 271 42 156 26
1993 88 22 22 8 94 24 21 11 243 66 139 25
1994 122 20 37 5 136 21 30 7 358 44 183 28
1995 105 29 26 10 114 33 29 5 305 78 181 50
1996 112 36 30 7 124 36 24 14 337 117 194 67
1997 112 27 34 4 122 30 34 18 347 82 188 42
1998 103 33 36 7 109 33 25 17 266 87 148 47
1999 87 44 20 12 100 46 21 15 235 109 132 66
2000 78 77 31 31 85 84 20 20 216 200 126 128
2001 73 54 7 17 83 56 26 9 234 142 124 91
2002 81 66 32 25 94 69 21 12 219 142 125 105
2003 80 78 3 25 90 81 27 18 225 202 128 128
2004 80 68 11 32 89 77 24 16 238 161 137 107
2005 98 85 8 25 107 93 20 16 266 211 167 140
2006 98 73 11 22 108 75 22 20 277 179 157 115
2007 96 75 15 34 103 77 11 15 270 191 164 119
2008 92 67 14 32 101 73 18 27 225 150 151 91
2009 84 51 11 21 94 56 19 9 232 116 142 75
2010 71 65 17 24 74 68 14 21 175 148 106 101
2011 72 58 7 17 74 59 19 17 183 132 119 95
2012 70 58 13 22 78 59 13 9 179 155 112 106
2013 86 79 11 28 91 80 27 18 190 170 139 132
2014 86 61 7 21 89 70 24 17 206 125 142 90
2015 95 78 23 27 102 80 33 20 222 199 157 147
2016 116 83 21 19 119 87 31 22 274 214 197 153
2017 97 86 14 24 100 89 40 32 190 192 152 142
2018 110 65 7 10 117 66 37 24 258 133 177 104
2019 124 87 16 26 130 94 38 30 289 192 203 142
2020 208 108 43 32 223 113 73 37 475 245 344 184
2021 215 99 0 0 239 106 68 27 510 230 388 176
Local government: full-time employees
Job MemphisLouisville
Financial administration 110 172
Firefighters 1,640 508
Fire - other 117 175
Gas supply 627 0
Health 51 22
Judicial and legal 110 47
Local libraries 277 212
Natural resources 14 0
Other and unallocable 310 138
Other government administration 143 195
Parks and recreation 208 505
Police - other 372 220
Police protection - officers 2,283 721
Sewerage 402 0
Solid waste management 478 240
Streets and highways 213 264
Totals for government 9,980 4,209
Transit 490 0
Water supply 339 473
Water transport and terminals 6 0
Local government: part-time employees
Job MemphisLouisville
Financial administration 23 12
Firefighters 9 0
Fire - other 11 0
Gas supply 34 0
Health 24 0
Judicial and legal 39 6
Local libraries 54 148
Other and unallocable 66 20
Other government administration 129 15
Parks and recreation 851 157
Police - other 415 48
Sewerage 12 0
Solid waste management 107 0
Streets and highways 37 4
Totals for government 1,883 534
Transit 3 0
Water supply 31 17
Mechanisms of homicide
Mechanism MemphisLouisville
Homicides from 2000 to 2006 1,090 397
Cut / Pierce 103 49
Firearm 816 270
Suffocation 26 0
Mechanisms of homicide per 1,000,000 residents
Mechanism MemphisLouisville
Homicides from 2000 to 2006 171.8 81.2
Cut / Pierce 16.2 10.0
Firearm 128.6 55.2
Suffocation 4.1 0
Mechanisms of suicide per 1,000,000 residents
Mechanism MemphisLouisville
Suicides from 2000 to 2006 99.3 133.2
Firearm 65.2 74.9
Poisoning 13.7 22.1
Suffocation 13.7 24.5

Infrastructure

Both Memphis and Louisville have seen a rise in infrastructure development over the past few years. Memphis is making significant strides in areas like energy provision, waste management, and water supply. Louisville is similarly investing in infrastructure development, with efforts targeting broadband access, city facilities, and public transportation.
Infrastructure
Type Memphis Louisville
Hospitals 35 20
TV stations 14 14
Arenas or stadiums 2 2
Bank branches located here 160 255
Bank institutions located here 33 25
Main business address for public companies 17 31
Drinking water stations with reported violations in the past 4 4

Schools

School facilities
Type Memphis Louisville
Private elementary/middle schools 30 41
Private high schools 24 26
Public elementary/middle schools 168 113
Public high schools 59 43
Colleges/Universities 31 29
HMDA - Conventional home purchase loans - Applications denied
Year MemphisLouisville
1999 2,195 879
2000 2,406 799
2001 1,775 535
2002 1,444 490
2003 2,116 639
2004 3,266 881
2005 4,730 1,116
2006 5,833 1,037
2007 3,559 685
2008 1,174 397
2009 345 253

Culture and Food

Both cities are culturally rich. Memphis, the birthplace of Rock and Roll, is known for Beale Street, Graceland, and its tangy barbeque. Louisville embraces its midwestern and southern heritage with noteworthy attractions like the Kentucky Derby and the Bourbon trail, and its culinary scene, famous for the Hot Brown sandwich and Derby pie.

Sports Teams

Sports fans in Memphis support the NBA's Grizzlies and enjoy college sports from the University of Memphis. Louisville doesn't have an NBA team but has steadfast support for the Louisville Cardinals, and Louisville City FC in soccer.