Memphis, Tennessee, and Baton Rouge, Louisiana, are both culturally rich U.S. cities located on prominent rivers known for their regional food and music. Both cities offer unique experiences for both visitors and residents, with specific aspects distinguishing each city. Factors such as crime rate, weather conditions, cost of living, educational facilities, employment opportunities, infrastructure, etc., vary and offer different advantages. The following will provide a detailed comparison between the two cities.
Distance between
Memphis, TN and
Baton Rouge, LA : 329.0 miles
Memphis's population is larger by 183%. Its population has decreased by 21,973 people (3.4%) since 2000. The population of Baton Rouge has decreased by 5,633 people (2.5%) during that time.
Both Baton Rouge and Memphis struggle with higher than average crime rates compared to the national average. Memphis's crime rate makes it one of America's most dangerous cities, with property crime and violent crime rates considerably higher than the U.S. average. Baton Rouge is similarly situated, having one of the nation's highest crime rates, with both cities working on multiple solutions to improve safety levels.
City-data.com crime index counts serious crimes and violent crime more heavily. It adjusts for the number of visitors and daily workers commuting into cities. (higher means more crime, U.S. average = 301.1)
City-data.com crime index counts serious crimes and violent crime more heavily. It adjusts for the number of visitors and daily workers commuting into cities. (higher means more crime, U.S. average = 301.1)
Sex Offenders
According to our data, there are 2,614 registered sex offenders living in Memphis and 1,028 registered sex offenders living in . The ratio of residents to sex offenders in Memphis is 250 to 1; the ratio in Baton Rouge is 224 to 1. The number of registered sex offenders compared to the number of residents in Memphis is near to than in Baton Rouge.
Cost of Living
Overall, the cost of living in Memphis is lower than in Baton Rouge, particularly in terms of housing. While commodities and services across the U.S. coast average about 100, in Memphis, it stands at 74.2 and 91.1 for Baton Rouge.
Income Tax
Tennessee does not impose state income tax, making Memphis potentially attractive for higher earners. Louisiana, however, has a state income tax, ranging from 2% to 6%.
Property Tax
Property taxes in both cities are quite different, with Memphis being considerably high compared to Baton Rouge. This variation could influence potential homeowners deciding where to relocate.
Sales Tax
The sales tax in Baton Rouge is higher than in Memphis. The state sales tax in Louisiana is 4.45%, combined with a local sales tax varying from 4% to 7%. Tennessee has a 7% sales tax but does not charge sales tax on most grocery food items.
Income
Type
Memphis
Baton Rouge
Estimated median household income
$44,317
$41,257
Estimated per capita income
$28,571
$28,621
Cost of living index (U.S. average is 100)
85.5
90.2
If you make $50,000 in Memphis, you will have to make $52,749 in Baton Rouge to maintain the same standard of living.
Geographical Conditions
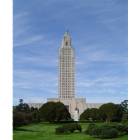
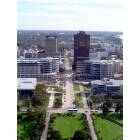
Memphis and Baton Rouge share a key geographical feature - The Mississippi River. Memphis is located on a bluff, the Chickasaw Bluff, protecting it from flooding. Baton Rouge is also located on the first set of bluffs north of the Mississippi River Delta.
Both cities offer a range of public and private school options. Memphis is home to the University of Memphis and Rhodes College, while Baton Rouge is known for Louisiana State University - one of the most prominent universities in the Southern U.S.
Memphis economy is dominated by sectors such as trade, transportation, utilities, education, and health services. Conversely, Baton Rouge's economy is primarily driven by the petrochemical industry, the port, and state government. Both cities have seen recent growth in the tech sector.
Biggest Employers
In Memphis, FedEx is the largest employer, followed by Methodist Le Bonheur Healthcare. In Baton Rouge, the biggest employers are the state government, followed by petrochemical companies like ExxonMobil and Dow.
In Memphis (Shelby County), 62.9% voted for Democrats and 36.7% for Republicans in 2012 Presidential Election. In Baton Rouge (East Baton Rouge Parish), 52.0% voted for Democrats and 46.7% for Republicans.
Elections
Type
Democrats
Republicans
Other
Year
Memphis
Baton Rouge
Memphis
Baton Rouge
Memphis
Baton Rouge
2020
64.8%
55.8%
34.2%
42.7%
1.1%
1.5%
2016
62.3%
52.6%
34.7%
43.3%
3.1%
4.1%
2012
62.9%
52.0%
36.7%
46.7%
0.4%
1.3%
2008
63.8%
50.7%
36.2%
48.5%
0.0%
0.8%
2004
57.7%
45.0%
42.0%
54.7%
0.3%
0.3%
2000
56.8%
45.4%
42.3%
52.9%
0.9%
1.7%
1996
78.9%
74.9%
19.6%
22.4%
1.5%
2.7%
Breakdown of population affiliated with a religious congregation
Type
Adherents
Congregations
Religion
Memphis
Baton Rouge
Memphis
Baton Rouge
SOUTHERN BAPTIST CONVENTION
14.8%
12.1%
15.1%
16.1%
CATHOLIC CHURCH
6.5%
22.2%
2.7%
5.5%
EVANGELICAL PRESBYTERIAN CHURCH
1.5%
0.4%
0.7%
0.2%
EPISCOPAL CHURCH
0.8%
1.3%
1.8%
2.1%
MUSLIM ESTIMATE
0.5%
0.3%
0.8%
1.1%
LUTHERAN CHURCH
0.4%
0.3%
1.0%
0.9%
PRESBYTERIAN CHURCH IN AMERICA
0.4%
0.2%
0.6%
0.9%
SEVENTH DAY ADVENTIST CHURCH
0.4%
0.3%
0.9%
1.1%
AMERICAN BAPTIST CHURCHES IN THE USA
0.3%
0.5%
0.6%
0.5%
Weather
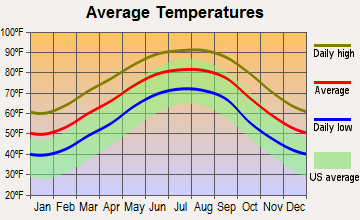
Baton Rouge has a more tropical climate with hot, humid summers and mild winters. On the other hand, Memphis experiences four distinct seasons with hot, humid summers and cooler winters. Both cities are prone to severe weather; Baton Rouge is at risk of hurricanes, and Memphis can experience tornadoes.
Weather and climate
Type
Memphis
Baton Rouge
Temperature - Average
61.9°F
67°F
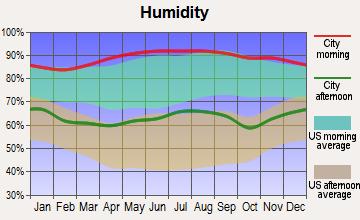
Humidity - Average morning or afternoon humidity
74%
80%
Humidity - Differences between morning and afternoon humidity
33%
39%
Humidity - Maximum monthly morning or afternoon humidity
85%
93%
Humidity - Minimum monthly morning or afternoon humidity
52%
54%
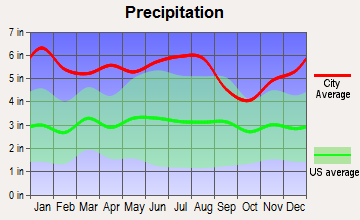
Precipitation - Yearly average
54.3 in
64.4 in
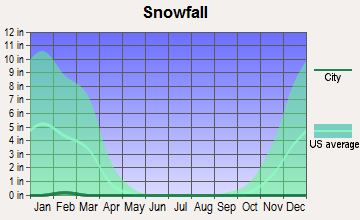
Snowfall - Yearly average
8.6 in
0.4 in
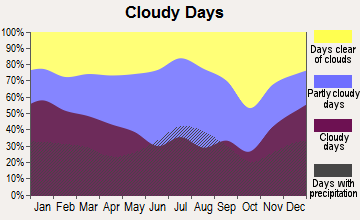
Clouds - Number of days clear of clouds
19.7%
16.5%
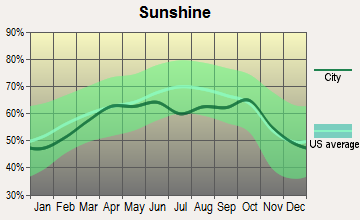
Sunshine amount - Average
68.7%
64.3%
Sunshine amount - Differences during a year
24%
22.5%
Sunshine amount - Maximum monthly
74%
70.4%
Sunshine amount - Minimum monthly
50%
47.9%
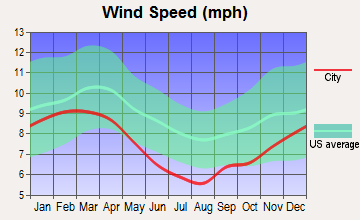
Wind speed - Average
8.8 mph
6.9 mph
Average climate in Memphis, Tennessee
Average climate in Baton Rouge, Louisiana
Air pollution
Type
AQI
CO
NO2
OZONE
PM10
PM25
SO2
Year
Memphis
Baton Rouge
Memphis
Baton Rouge
Memphis
Baton Rouge
Memphis
Baton Rouge
Memphis
Baton Rouge
Memphis
Baton Rouge
Memphis
Baton Rouge
2018
81
92
0.24
0.20
10.4
10.1
27.1
22.6
19.0
26.9
8.1
10.4
0.4
0.6
2017
74
82
0.24
0.21
10.2
10.2
28.1
25.3
17.5
22.5
7.9
10.3
0.3
0.4
2016
76
78
0.24
0.22
10.2
10.6
28.8
23.0
19.6
25.5
8.5
11.4
0.9
1.1
2015
77
97
0.26
0.22
11.1
9.4
26.9
24.1
N/A
26.2
9.2
12.1
1.0
1.1
2014
75
91
0.27
0.26
10.1
10.3
26.5
23.6
N/A
24.1
9.9
10.0
1.3
1.2
2013
74
90
0.31
0.20
8.3
9.7
26.6
24.2
N/A
23.1
10.2
10.0
1.0
0.6
2012
94
96
0.32
0.22
9.3
10.9
29.7
25.5
N/A
25.3
10.7
10.3
0.6
0.8
2011
93
104
0.34
0.22
10.0
11.4
29.0
25.8
N/A
33.2
11.1
12.6
0.5
1.3
2010
95
112
0.43
0.25
10.3
12.0
27.9
25.9
N/A
28.2
12.9
10.5
N/A
1.3
2009
86
97
0.35
0.22
8.7
11.7
24.9
23.0
N/A
26.1
11.8
9.2
N/A
1.9
2008
94
99
0.36
0.28
10.3
12.8
26.3
22.3
N/A
N/A
13.2
10.9
N/A
2.5
2007
106
115
0.47
0.38
11.2
14.3
26.7
23.0
N/A
N/A
14.8
12.2
5.6
2.6
2006
108
120
0.43
0.34
13.0
14.6
26.8
23.4
N/A
N/A
14.7
12.7
6.3
3.6
2005
110
122
0.46
0.41
10.1
15.5
26.9
24.7
N/A
N/A
17.9
13.1
4.9
4.4
2004
98
106
0.51
0.56
N/A
15.4
24.9
22.8
N/A
N/A
14.5
12.1
5.9
3.5
2003
110
124
0.57
0.66
20.1
16.0
25.3
21.5
N/A
N/A
15.0
11.0
5.8
3.4
2002
110
104
0.58
0.70
20.4
16.2
25.1
21.8
15.6
N/A
N/A
9.7
4.5
2.7
2001
111
109
0.66
0.82
24.7
16.6
26.0
23.5
22.7
N/A
N/A
9.6
6.1
3.7
2000
103
135
0.63
0.76
25.2
16.9
26.2
24.0
24.9
N/A
N/A
11.0
6.4
3.7
Natural disasters
Type
Memphis
Baton Rouge
Tornado activity compared to U.S. average
198.6%
167.3%
Earthquake activity compared to U.S. average
474%
54.9%
Natural disasters compared to U.S. average
18%
28%
Transportation
Baton Rouge has an extensive bus system, and a regional airport serves Memphis, with an extensive system of interstates and city buses. However, Memphis is considered more bike-friendly.
Transport
Type
Memphis
Baton Rouge
Amtrak stations
1
1
Amtrak stations nearby
1
1
FAA registered aircraft
1
320
FAA registered aircraft manufacturers and dealers
52
10
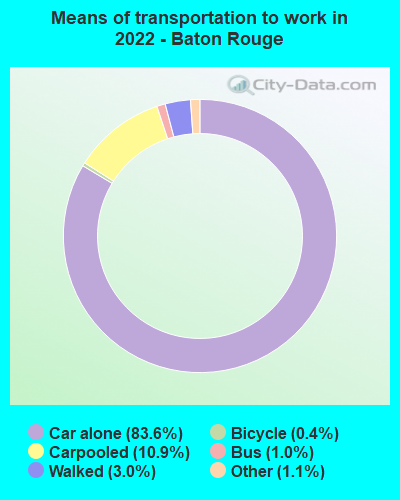
Means of transportation to work
Type
Memphis
Baton Rouge
Bicycle
0%
0.6%
Bus
0.4%
1.1%
Carpooled
7.5%
9.1%
Car alone
88.8%
87.9%
Walked
1.2%
0.7%
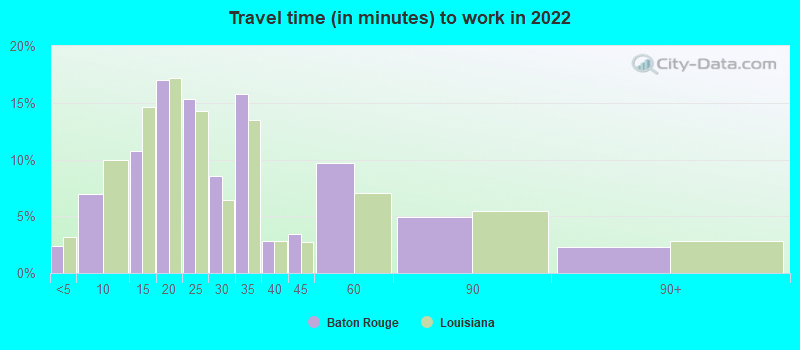
Average travel time to work
Type
Memphis
Baton Rouge
Average
27 min
30.9 min
Other means
22.5 min
21.2 min
Public transportation
43.5 min
41.8 min
Private vehicle occupancy
Type
Memphis
Baton Rouge
Average
1.1
1.2
Drove alone
89.9%
88.2%
In 2 person carpool
7.9%
8.3%
In 3 person carpool
1.6%
1%
In 4 person carpool
0.4%
1.7%
In 5-6 person carpool
0.2%
0.2%
In 7+ person carpool
0.1%
0.6%
How many people usually rode to work in the car, truck or van.
Real Estate
Real estate in Memphis is generally more affordable compared to Baton Rouge. Both cities have a mix of urban and suburban neighborhoods with diverse housing options.
Neighborhoods
Memphis boasts historical neighborhoods like Midtown, featuring arts and music scenes, and East Memphis with upscale homes and shopping. Baton Rouge has dynamic neighborhoods like downtown, with an urban vibe, and vibrant college town feel in areas surrounding Louisiana State University.
Houses and residents
Type
Memphis
Baton Rouge
Houses
288,491
107,002
Average household size (people)
2.5
2.4
Median year apartment built
1972
1979
Median year house/condo built
1967
1971
Length of stay in the house since moving in
16.2 years
14.8 years
Houses occupied
256,968 (89.1%)
87,440 (81.7%)
Houses occupied by owners
119,622 (46.6%)
41,267 (47.2%)
Houses occupied by renters
137,346 (53.4%)
46,173 (52.8%)
Median rent asked for vacant for-rent units
$760.83
$1,167
Median monthly housing costs
$967
$938
Median price asked for vacant for-sale houses and condos
$201,932
$351,611
Estimated median house or condo value
$142,800
$199,600
Median numbers of rooms
5.5
4.9
Median number of rooms in apartments
4.8
4
Median number of rooms in houses and condos
6.6
6.6
Median house price - detached houses
$205,904
$277,211
Median house price - in 2-unit structures
Over $1,000,000
$80,632
Median house price - in 3-to-4-unit structures
$145,165
$204,273
Median house price - in 5 or more unit structures
$201,411
$162,691
Median house price - mobile homes
$93,577
$36,615
Median house price - Townhouses or other attached units
$170,154
$190,008
Median house price - All housing units
$204,886
$270,567
Median house age
52
47
Renting percentage
48.1%
50.7%
Housing density (houses/condos per square mile)
1,032.8
1,392.5
House value disparities
44.1%
39.7%
Household income disparities
48.2%
52.9%
Median household income for houses/condes with a mortgage
$72,611
$85,373
Median household income for apartments without a mortgage
$53,615
$51,524
Housing units without a mortgage
1,461 (2%)
607 (2.5%)
Housing units with both a second mortgage and home equity loan
3,970 (5.4%)
1,424 (6%)
Housing units with a mortgage
71,386 (98%)
23,275 (97.5%)
Housing units with a home equity loan
322 (0.4%)
140 (0.6%)
Housing units with a second mortgage
5,907 (8.1%)
1,954 (8.2%)
House/condo owner moved in on average (years ago)
16
14
House/condo renter moved in on average (years ago)
1
1
Housing units lacking complete kitchen facilities
5.7%
6.1%
Housing units lacking complete plumbing facilities
4.6%
5.2%
Housing units in structures
Housing units in structures
Memphis
Baton Rouge
One, detached
61.0%
55.3%
One, attached
5.8%
3.3%
Two
2.1%
3.5%
3 or 4
7.4%
5.6%
5 to 9
9.1%
7.5%
10 to 19
5.6%
9.4%
20 to 49
1.8%
7.0%
50 or more
6.2%
7.9%
Mobile homes
0.8%
0.4%
Boats, RVs, vans, etc.
0.1%
0.0%
Median real estate property taxes paid for housing units
Self-employed workers in own not incorporated business
16,111
5,415
State government workers
7,650
9,361
Unpaid family workers
668
351
Industries and Occupations
Memphis is a hub for transportation and logistics, with FedEx headquartered here. Other key industries include healthcare and education. Baton Rouge's economy heavily relies on the petrochemical industry, state government, and distribution and transportation.
Both cities have extensive healthcare facilities. Memphis is home to nationally recognized St. Jude Children's Research Hospital. Baton Rouge also offers top-rate medical facilities, including Baton Rouge General Medical Center and Our Lady of the Lake Regional Medical Center.
Health (county statistics)
Type
Memphis
Baton Rouge
General health status score of residents in this county from 1 (poor) to 5 (excellent)
Memphis has robust infrastructure, including one of the world's busiest cargo airports, an extensive freeway system, and a sizable port on the Mississippi River. Baton Rouge infrastructure highlights include a deep-water port, highway system, and major rail terminals.
Infrastructure
Type
Memphis
Baton Rouge
Hospitals
35
95
TV stations
14
16
Arenas or stadiums
2
2
Bank branches located here
160
145
Bank institutions located here
33
29
Main business address for public companies
17
4
Drinking water stations with no reported violations in the past
0
8
Drinking water stations with reported violations in the past
HMDA - Conventional home purchase loans - Applications denied
Year
Memphis
Baton Rouge
1999
2,195
728
2000
2,406
592
2001
1,775
495
2002
1,444
472
2003
2,116
472
2004
3,266
757
2005
4,730
1,088
2006
5,833
1,139
2007
3,559
717
2008
1,174
348
2009
345
176
Culture and Food
Both cities have rich cultural and culinary scenes. Memphis is synonymous with Blues music, historic Graceland, and delicious BBQ. Baton Rouge offers Cajun and Creole cuisine, vibrant Mardi Gras celebrations, and a strong local art scene.
Sports Teams
Memphis Grizzlies (NBA) and Memphis Tigers (NCAA) are the city's leading sports teams. In Baton Rouge, college football is grand with the LSU Tigers, and Southern University Jaguars being very popular.


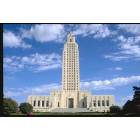
 Memphis, TN
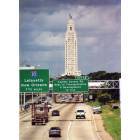
 Baton Rouge, LA