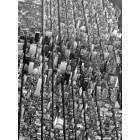
As two distinctively different yet compelling cities, Manhattan, NY and Phoenix, AZ offer unique lifestyles and experiences. Manhattan, the bustling heart of New York City, offers a fast-paced urban living, rich in history, culture, and financial activities. Phoenix, AZ, the sunny capital of Arizona, provides a laid-back lifestyle with warm weather year-round, fantastic outdoor activities, and growing job opportunities. This comparison delves into crime/safety, weather, cost of living, education, work and economy, infrastructure, industries and occupations, biggest employers, real estate, neighborhoods, transportation, tax, culture/food, sports teams, geographical conditions, and health care of each city to help you make an informed choice.
Crime rates in Manhattan have significantly fallen over the past years, with continuous efforts by NYPD to ensure public safety. However, crimes are still higher compared to Phoenix, which is generally safer. Yet, both cities have certain neighborhoods with higher crime rates and precautions should be taken. Proper research is important before settling down or visiting specific parts of these cities.
Cost of Living
Manhattan comes with a high cost of living, significantly above the national average. Housing, food, and entertainment are especially expensive. On the other hand, Phoenix has a lower cost of living, with more affordable housing and expenditures, allowing for a more relaxed lifestyle.
Income Tax
New York's city and state income tax is also higher compared to Arizona, which can significantly affect your disposable income.
Property Tax
Property taxes are a significant consideration. Manhattan has a higher rate than Phoenix, closely tied with its higher real estate prices.
Sales Tax
New York's combined state and city sales tax in Manhattan is significantly higher than Phoenix. Arizona's state sales tax is lower, making consumer goods more affordable.
Income
Type
Manhattan
Phoenix
Estimated median household income
$84,435
$68,435
Estimated per capita income
$76,589
$35,073
Cost of living index (U.S. average is 100)
185.3
101.2
If you make $50,000 in Phoenix, you will have to make $91,551 in Manhattan to maintain the same standard of living.
Geographical Conditions
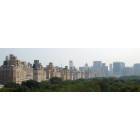
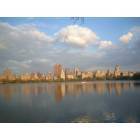
Manhattan is an island surrounded by rivers, featuring landmarks like Central Park. Phoenix is in the Sonoran Desert with beautiful mountainous landscapes, perfect for outdoor activities.
Geographical information
Type
Manhattan
Phoenix
Land area
23 sq. miles
474.9 sq. miles
Population density
70,629 people per sq. mile
3,421.1 people per sq. mile
Relative area comparison
Manhattan, NY Phoenix, AZ
Education
Manhattan is home to top-ranked universities, excellent schools, and rich arts culture, making it a great educational hub. Phoenix also has good schools and universities, but the range and reputation are not as globally recognized as Manhattan's.
Manhattan's economy is robust and diverse with finance, media, arts, and fashion leading the charge. Phoenix’s economy, although smaller, is steadily growing with sectors like tech, health care, and customer service seeing significant growth.
Biggest Employers
Manhattan's biggest employers include JPMorgan Chase, Citigroup, and Verizon. In Phoenix, top employers are Banner Health, Walmart, and Wells Fargo.
In Manhattan (New York County), 83.9% voted for Democrats and 14.9% for Republicans in 2012 Presidential Election. In Phoenix (Maricopa County), 43.6% voted for Democrats and 54.3% for Republicans.
Elections
Type
Democrats
Republicans
Other
Year
Manhattan
Phoenix
Manhattan
Phoenix
Manhattan
Phoenix
2020
86.5%
50.2%
12.2%
48.0%
1.2%
1.8%
2016
86.7%
44.9%
9.7%
47.7%
3.6%
7.5%
2012
83.9%
43.6%
14.9%
54.3%
1.2%
2.1%
2008
86.1%
44.0%
13.5%
54.5%
0.3%
1.5%
2004
82.3%
42.4%
16.8%
57.0%
0.9%
0.6%
2000
80.0%
43.0%
14.5%
53.4%
5.5%
3.6%
1996
80.0%
44.5%
13.8%
47.2%
6.3%
8.2%
Breakdown of population affiliated with a religious congregation
Type
Adherents
Congregations
Religion
Manhattan
Phoenix
Manhattan
Phoenix
CATHOLIC CHURCH
20.4%
13.6%
12.6%
4.3%
MUSLIM ESTIMATE
2.7%
0.2%
2.4%
1.0%
EPISCOPAL CHURCH
1.7%
0.3%
5.3%
1.3%
AMERICAN BAPTIST CHURCHES IN THE USA
1.6%
0.2%
4.7%
0.6%
REFORMED CHURCH IN AMERICA
0.6%
0.0%
1.2%
0.2%
PATRIAR PARISHE RUSSIAN ORTHODO CHURCH USA
0.4%
0.0%
0.2%
0.0%
EVANGELICAL LUTHERAN CHURCH IN AMERICA
0.3%
0.8%
2.0%
2.0%
SEVENTH DAY ADVENTIST CHURCH
0.3%
0.4%
2.4%
2.0%
SOUTHERN BAPTIST CONVENTION
0.2%
1.9%
2.9%
6.5%
LUTHERAN CHURCH
0.0%
0.5%
0.6%
1.5%
VINEYARD USA
0.0%
0.3%
0.1%
0.6%
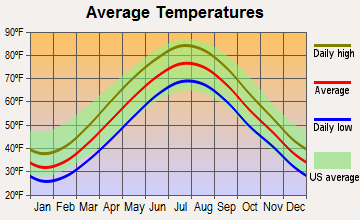
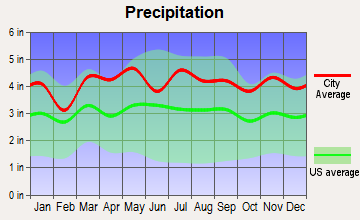
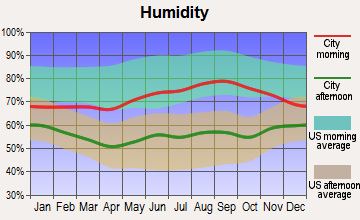
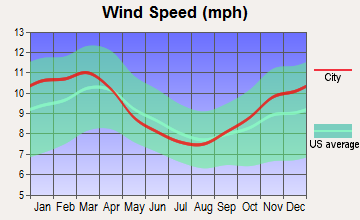
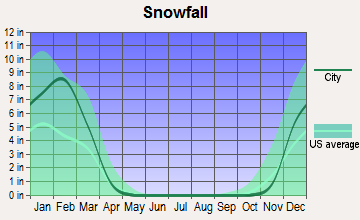
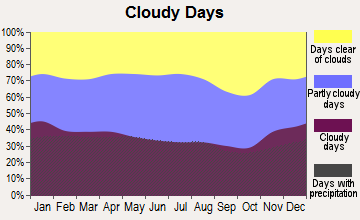
Weather
Weather vastly differs between the two. Manhattan experiences four distinct seasons with cold winters and hot, humid summers. Phoenix is known for its desert climate, with very hot summers and mild winters, offering lots of sunshine year-round.
Weather and climate
Type
Manhattan
Phoenix
Temperature - Average
54.6°F
71.5°F
Humidity - Average morning or afternoon humidity
67.4%
37.5%
Humidity - Differences between morning and afternoon humidity
30%
48%
Humidity - Maximum monthly morning or afternoon humidity
77%
60%
Humidity - Minimum monthly morning or afternoon humidity
47%
12%
Precipitation - Yearly average
49.6 in
8.7 in
Snowfall - Yearly average
57.4 in
0 in
Clouds - Number of days clear of clouds
17.8%
35.3%
Sunshine amount - Average
60.2%
92.8%
Sunshine amount - Differences during a year
20%
16%
Sunshine amount - Maximum monthly
64%
95%
Sunshine amount - Minimum monthly
44%
79%
Wind speed - Average
6.7 mph
6.6 mph
Average climate in Manhattan, New York
Average climate in Phoenix, Arizona
Air pollution
Type
AQI
CO
NO2
OZONE
PB
PM10
PM25
SO2
Year
Manhattan
Phoenix
Manhattan
Phoenix
Manhattan
Phoenix
Manhattan
Phoenix
Manhattan
Manhattan
Phoenix
Manhattan
Phoenix
Manhattan
Phoenix
2018
94
156
0.29
0.38
17.3
15.2
23.9
28.5
N/A
N/A
N/A
34.8
7.9
8.6
0.5
0.6
2017
97
120
0.16
0.41
17.4
15.9
24.0
28.6
N/A
N/A
N/A
34.9
7.7
7.6
0.4
1.4
2016
94
114
0.28
0.44
18.1
15.8
24.2
27.3
N/A
N/A
N/A
30.6
7.7
7.7
0.6
0.4
2015
100
102
0.36
0.46
18.9
17.6
23.0
27.1
N/A
N/A
N/A
26.2
8.6
7.9
1.0
0.9
2014
95
117
0.40
0.46
19.1
19.6
22.3
27.6
N/A
N/A
N/A
37.0
8.3
8.5
1.1
1.1
2013
97
130
0.43
0.43
19.5
19.9
22.6
27.9
N/A
N/A
N/A
35.3
9.0
8.4
1.1
0.9
2012
99
157
0.46
0.44
18.6
21.2
23.4
28.1
N/A
N/A
N/A
41.9
9.3
8.8
1.7
1.3
2011
108
203
0.46
0.47
20.7
20.0
22.2
28.3
N/A
N/A
N/A
41.3
10.9
9.6
2.7
0.9
2010
113
100
0.45
0.48
19.3
19.9
23.3
26.9
N/A
N/A
N/A
31.2
10.4
8.3
2.7
0.9
2009
104
108
0.51
0.52
21.9
20.1
18.8
25.6
N/A
N/A
N/A
38.2
10.7
N/A
3.8
1.8
2008
110
106
0.49
0.48
23.0
21.4
19.8
26.6
0.013
N/A
N/A
39.6
12.3
N/A
4.6
2.4
2007
121
129
0.56
0.54
24.4
23.5
19.4
25.2
0.016
N/A
N/A
47.6
13.1
N/A
5.5
2.4
2006
116
131
0.64
0.66
24.6
25.3
18.9
24.4
0.018
N/A
N/A
50.8
12.9
N/A
6.5
2.3
2005
112
109
0.77
0.74
26.7
25.9
18.4
22.2
N/A
N/A
N/A
44.6
N/A
N/A
8.2
2.5
2004
108
98
0.77
0.77
26.7
25.5
17.3
23.4
0.030
N/A
N/A
32.8
N/A
N/A
8.0
1.4
2003
107
101
0.83
0.90
27.8
26.8
17.5
23.7
0.024
N/A
26.9
42.6
N/A
N/A
8.2
1.4
2002
122
111
0.78
0.98
27.9
28.7
18.7
23.6
0.008
N/A
25.9
41.8
N/A
N/A
7.3
1.6
2001
123
106
0.79
1.00
29.4
28.6
19.4
22.3
0.020
N/A
25.0
37.8
N/A
N/A
8.7
1.5
2000
115
117
0.90
1.14
30.2
29.9
15.0
24.6
0.022
N/A
22.2
45.6
N/A
N/A
8.4
1.7
Natural disasters
Type
Manhattan
Phoenix
Tornado activity compared to U.S. average
59.1%
18.3%
Earthquake activity compared to U.S. average
31.1%
2,597.6%
Natural disasters compared to U.S. average
18%
16%
Transportation
Manhattan’s public transportation is extensive and reliable with subways, buses, taxis, and bike lanes. On the contrary, Phoenix is more car-dependent with less emphasis on public transit.
Transport
Type
Manhattan
Phoenix
Amtrak stations
0
3
Amtrak stations nearby
3
3
FAA registered aircraft
2
1
FAA registered aircraft manufacturers and dealers
0
15
Means of transportation to work
Type
Manhattan
Phoenix
Bicycle
0.9%
0.4%
Bus
10.1%
1.8%
Carpooled
3.4%
12.2%
Car alone
7.6%
81.8%
Motorcycle
0.1%
0.4%
Railroad
1.1%
0.2%
Streetcar
0.1%
0%
Subway
43.6%
0%
Taxicab
4.7%
0.1%
Walked
21.9%
1.4%
Average travel time to work
Type
Manhattan
Phoenix
Average
30.3 min
28.6 min
Real Estate
Manhattan's real estate is pricier, with a high demand for limited space. In Phoenix, homes are more affordable, and suburban living is more common.
Neighborhoods
Manhattan is known for its iconic neighborhoods like Harlem, Soho, and Tribeca, each with unique characteristics. Phoenix has more suburban-style neighborhoods like Arcadia and Deer Valley, known for their family-friendly environment.
Houses and residents
Type
Manhattan
Phoenix
Houses
798,144
644,625
Average household size (people)
2
2.8
Houses occupied
738,644 (92.5%)
602,039 (93.4%)
Houses occupied by owners
148,695 (20.1%)
354,237 (58.8%)
Houses occupied by renters
589,949 (79.9%)
247,802 (41.2%)
Median rent asked for vacant for-rent units
$1,690
$1,605
Median price asked for vacant for-sale houses and condos
$3,393,315
$375,817
Estimated median house or condo value
$940,900
$352,600
Median number of rooms in apartments
3.2
4
Median number of rooms in houses and condos
4
6.1
Renting percentage
77.2%
42.4%
Housing density (houses/condos per square mile)
34,757
1,357.5
Household income disparities
47.8%
43.9%
Housing units without a mortgage
1,104 (40.3%)
3,634 (1.5%)
Housing units with both a second mortgage and home equity loan
13 (0.5%)
12,949 (5.2%)
Housing units with a mortgage
1,636 (59.7%)
246,434 (98.5%)
Housing units with a home equity loan
140 (5.1%)
624 (0.2%)
Housing units with a second mortgage
140 (5.1%)
16,890 (6.8%)
Housing units lacking complete kitchen facilities
2%
1.2%
Housing units lacking complete plumbing facilities
Self-employed workers in own not incorporated business
69,517
48,122
State government workers
15,544
30,385
Unpaid family workers
1,861
1,048
Industries and Occupations
Manhattan boasts a wide range of industries from finance to fashion and media, while Phoenix’s main industries include health care, education, and emerging tech sector, offering a more laid-back work environment.
Both cities have excellent healthcare facilities. Manhattan is home to world-class hospitals like Mount Sinai and New York-Presbyterian. Phoenix hosts Mayo Clinic and Phoenix Children’s Hospital.
Health (county statistics)
Type
Manhattan
Phoenix
General health status score of residents in this county from 1 (poor) to 5 (excellent)
Manhattan’s infrastructure includes historic buildings, modern skyscrapers, and extensive public transportation. Phoenix has more spread-out infrastructures, suburban-style neighborhoods, and is more car-dependent.
Infrastructure
Type
Manhattan
Phoenix
TV stations
30
22
Culture and Food
Manhattan boasts a rich cultural diversity seen in its numerous museums, theaters, and globally-influenced food culture. Phoenix also has diverse food options with a strong inclination towards Mexican cuisine and outdoor activities linked to its geography.
Sports Teams
Both cities are home to major sports teams. Manhattan is home to teams like the Yankees (MLB), Knicks (NBA), and Giants (NFL). Phoenix has the Suns (NBA), Diamondbacks (MLB), and Cardinals (NFL).


 Manhattan, NY
 Phoenix, AZ