Manhattan, NY and Philadelphia, PA are two iconic cities in the US each offering a unique living experience. Where Manhattan offers the quintessential urban living experience, Philadelphia combines historical charm with a slower pace. Both cities have numerous job opportunities, high-quality universities, and vibrant cultural scenes. Safety, cost of living, and taxes vary between the cities. Infrastructure and transport systems are robust but differ in scale and accessibility. Real estate markets, healthcare, and sports also offer contrasting experiences. This comprehensive comparison should provide valuable insights for those considering a move.
In comparison, Philadelphia typically has a higher crime rate than Manhattan, especially for violent crimes. However, neighborhood safety varies considerably within each city. The use of public safety resources and community initiatives are significant factors in the respective crime rates. Both cities have strong law enforcement agencies that work hard to maintain safety, but residents and visitors should remain vigilant and informed about their surroundings.
Cost of Living
The cost of living in Manhattan, NY is notably higher than in Philadelphia, PA. This includes housing, utilities, groceries, and transportation. While you can find more affordable options in each city depending on the neighborhood, the general trend remains constant. For those considering relocating, it’s crucial to keep this economic factor in mind.
Income Tax
Income tax is also higher in New York with city and state taxes combining for an average rate around 10%. In contrast, Philadelphia has a city wage tax of around 3.87% for residents, and Pennsylvania has a flat state income tax of 3.07%.
Property Tax
Property owners in Manhattan face some of the highest real estate taxes in the country, with an average effective tax rate of 0.88%. Philadelphia homeowners face a lower average effective property tax rate of about 0.99% but pay higher overall due to lower property valuations.
Sales Tax
New York City has a city sales tax of 4.5% and a state tax of 4%. In contrast, Philadelphia has a city sales tax of 2% on top of Pennsylvania’s six percent state sales tax. For high volume purchases, these tax differences could be significant.
Income
Type
Manhattan
Philadelphia
Estimated median household income
$84,435
$52,899
Estimated per capita income
$76,589
$32,707
Cost of living index (U.S. average is 100)
185.3
105.4
If you make $50,000 in Philadelphia, you will have to make $87,903 in Manhattan to maintain the same standard of living.
Geographical Conditions
Manhattan is an island bordered by the Hudson, East, and Harlem rivers, while Philadelphia is located between the Delaware and Schuylkill rivers and has more open spaces and parks. These geographical factors influence housing, infrastructure, and lifestyle.
Geographical information
Type
Manhattan
Philadelphia
Land area
23 sq. miles
135.1 sq. miles
Population density
70,629 people per sq. mile
11,668 people per sq. mile
Relative area comparison
Manhattan, NY Philadelphia, PA
Education
Both cities have excellent educational institutions. Manhattan boasts several prestigious universities, including Columbia University and New York University, as well as an abundance of top-rated public and private schools. Philadelphia is also home to world-renowned institutions, such as the University of Pennsylvania and Temple University. In summary, both cities offer high-quality education from pre-K through to postgraduate studies.
Manhattan is the heart of the world’s financial industry, hosting Wall Street and numerous multinational companies. Opportunities in finance, media, arts, and information technology are abundant. Philadelphia's economy is more diversified, with strength in sectors such as healthcare, education, and government. Both cities offer ample job opportunities depending on one's field of expertise.
Biggest Employers
In Manhattan, the biggest employers are JPMorgan Chase, Citigroup, and Verizon, among others. Philadelphia’s largest employers are the federal and city government, the University of Pennsylvania, and the Children's Hospital of Philadelphia. Both cities offer employment in a variety of sectors.
In Manhattan (New York County), 83.9% voted for Democrats and 14.9% for Republicans in 2012 Presidential Election. In Philadelphia (Philadelphia County), 85.2% voted for Democrats and 14.0% for Republicans.
Elections
Type
Democrats
Republicans
Other
Year
Manhattan
Philadelphia
Manhattan
Philadelphia
Manhattan
Philadelphia
2020
86.5%
81.2%
12.2%
17.9%
1.2%
0.9%
2016
86.7%
82.3%
9.7%
15.3%
3.6%
2.4%
2012
83.9%
85.2%
14.9%
14.0%
1.2%
0.8%
2008
86.1%
83.2%
13.5%
16.4%
0.3%
0.4%
2004
82.3%
80.6%
16.8%
19.4%
0.9%
0.0%
2000
80.0%
80.4%
14.5%
18.1%
5.5%
1.5%
1996
80.0%
77.4%
13.8%
16.0%
6.3%
6.6%
Breakdown of population affiliated with a religious congregation
Type
Adherents
Congregations
Religion
Manhattan
Philadelphia
Manhattan
Philadelphia
CATHOLIC CHURCH
20.4%
24.8%
12.6%
8.8%
MUSLIM ESTIMATE
2.7%
2.6%
2.4%
3.1%
EPISCOPAL CHURCH
1.7%
0.8%
5.3%
3.8%
AMERICAN BAPTIST CHURCHES IN THE USA
1.6%
3.8%
4.7%
6.7%
REFORMED CHURCH IN AMERICA
0.6%
0.0%
1.2%
0.0%
PATRIAR PARISHE RUSSIAN ORTHODO CHURCH USA
0.4%
0.1%
0.2%
0.2%
EVANGELICAL LUTHERAN CHURCH IN AMERICA
0.3%
0.6%
2.0%
3.1%
SEVENTH DAY ADVENTIST CHURCH
0.3%
0.4%
2.4%
1.7%
PRESBYTERIAN CHURCH IN AMERICA
0.2%
0.4%
0.6%
1.4%
SOUTHERN BAPTIST CONVENTION
0.2%
2.2%
2.9%
9.9%
Weather
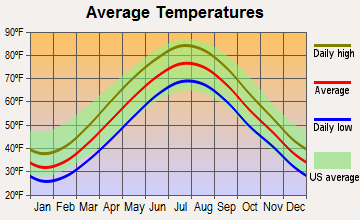
Manhattan, NY and Philadelphia, PA share a similar weather pattern due to their geographical proximity in the Northeast United States. Both experience four seasons with hot summers, cold winters, and mild springs and autumns. However, Manhattan's weather may be slightly more extreme due to its coastal location and the urban heat island effect caused by its dense infrastructure.
Weather and climate
Type
Manhattan
Philadelphia
Temperature - Average
54.6°F
54.8°F
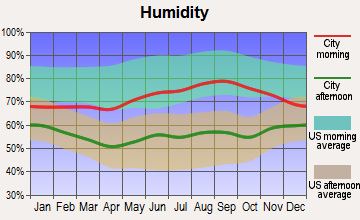
Humidity - Average morning or afternoon humidity
67.4%
69.9%
Humidity - Differences between morning and afternoon humidity
30%
34%
Humidity - Maximum monthly morning or afternoon humidity
77%
82%
Humidity - Minimum monthly morning or afternoon humidity
47%
48%
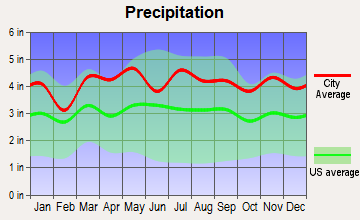
Precipitation - Yearly average
49.6 in
45.7 in
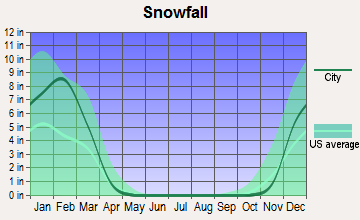
Snowfall - Yearly average
57.4 in
45.1 in
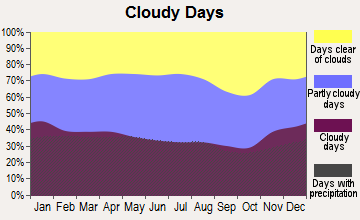
Clouds - Number of days clear of clouds
17.8%
15.4%
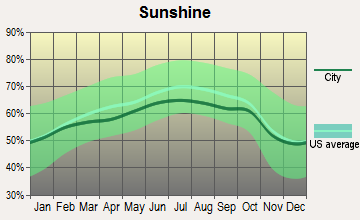
Sunshine amount - Average
60.2%
59.8%
Sunshine amount - Differences during a year
20%
18%
Sunshine amount - Maximum monthly
64%
63%
Sunshine amount - Minimum monthly
44%
45%
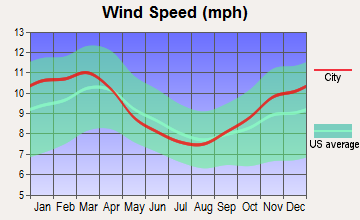
Wind speed - Average
6.7 mph
10 mph
Average climate in Manhattan, New York
Average climate in Philadelphia, Pennsylvania
Air pollution
Type
AQI
CO
NO2
OZONE
PB
PM10
PM25
SO2
Year
Manhattan
Philadelphia
Manhattan
Philadelphia
Manhattan
Philadelphia
Manhattan
Philadelphia
Manhattan
Philadelphia
Manhattan
Philadelphia
Manhattan
Philadelphia
Manhattan
Philadelphia
2018
94
99
0.29
0.37
17.3
10.7
23.9
24.3
N/A
N/A
N/A
17.2
7.9
9.2
0.5
0.9
2017
97
105
0.16
0.32
17.4
11.0
24.0
25.3
N/A
0.004
N/A
22.3
7.7
8.9
0.4
1.0
2016
94
99
0.28
0.30
18.1
13.6
24.2
25.1
N/A
0.007
N/A
23.2
7.7
9.5
0.6
1.4
2015
100
110
0.36
0.34
18.9
15.8
23.0
22.6
N/A
0.007
N/A
23.9
8.6
10.5
1.0
1.8
2014
95
105
0.40
0.34
19.1
16.8
22.3
23.1
N/A
0.027
N/A
23.0
8.3
11.7
1.1
2.2
2013
97
105
0.43
0.27
19.5
16.7
22.6
22.5
N/A
0.029
N/A
31.0
9.0
10.5
1.1
1.5
2012
99
111
0.46
0.29
18.6
17.8
23.4
23.0
N/A
0.040
N/A
14.6
9.3
11.7
1.7
1.5
2011
108
113
0.46
0.28
20.7
19.9
22.2
24.3
N/A
0.039
N/A
16.9
10.9
9.8
2.7
1.9
2010
113
116
0.45
0.30
19.3
20.1
23.3
23.0
N/A
0.009
N/A
21.7
10.4
12.2
2.7
2.6
2009
104
95
0.51
0.32
21.9
18.9
18.8
19.7
N/A
0.011
N/A
18.0
10.7
11.9
3.8
2.9
2008
110
112
0.49
0.30
23.0
19.8
19.8
19.1
0.013
0.010
N/A
16.8
12.3
13.9
4.6
3.8
2007
121
128
0.56
0.42
24.4
21.6
19.4
23.3
0.016
0.019
N/A
17.5
13.1
12.3
5.5
4.2
2006
116
112
0.64
0.52
24.6
21.4
18.9
22.5
0.018
0.016
N/A
18.3
12.9
13.1
6.5
4.2
2005
112
108
0.77
0.58
26.7
24.4
18.4
20.8
N/A
0.018
N/A
19.7
N/A
N/A
8.2
5.0
2004
108
102
0.77
0.58
26.7
24.1
17.3
18.9
0.030
0.023
N/A
19.1
N/A
N/A
8.0
5.2
2003
107
103
0.83
0.62
27.8
23.8
17.5
19.7
0.024
0.034
26.9
19.6
N/A
N/A
8.2
5.4
2002
122
128
0.78
0.56
27.9
26.8
18.7
21.2
0.008
0.035
25.9
18.3
N/A
N/A
7.3
4.9
2001
123
119
0.79
0.63
29.4
27.9
19.4
20.0
0.020
0.014
25.0
20.6
N/A
N/A
8.7
5.6
2000
115
111
0.90
0.68
30.2
26.7
15.0
19.0
0.022
0.034
22.2
N/A
N/A
N/A
8.4
5.5
Natural disasters
Type
Manhattan
Philadelphia
Tornado activity compared to U.S. average
59.1%
96.6%
Earthquake activity compared to U.S. average
31.1%
34.4%
Natural disasters compared to U.S. average
18%
22%
Transportation
Manhattan has an extensive public transit system, including the largest subway network in the US. Philadelphia also has a robust public transit system including buses, trolleys and a commuter rail network. For both cities, owning a car is not a necessity due to their comprehensive transit systems.
Transport
Type
Manhattan
Philadelphia
Amtrak stations
0
2
Amtrak stations nearby
3
3
FAA registered aircraft
2
347
FAA registered aircraft manufacturers and dealers
0
2
Means of transportation to work
Type
Manhattan
Philadelphia
Bicycle
0.9%
2%
Bus
10.1%
11.7%
Carpooled
3.4%
8.7%
Car alone
7.6%
60%
Railroad
1.1%
0.7%
Streetcar
0.1%
4.2%
Subway
43.6%
2.8%
Taxicab
4.7%
0.2%
Walked
21.9%
7.8%
Average travel time to work
Type
Manhattan
Philadelphia
Average
30.3 min
34.3 min
Real Estate
The real estate market in Manhattan is among the most expensive in the nation, with premium rates for both renting and buying properties. Philadelphia's real estate market offers more affordable options, although it has been seeing a steady increase, particularly in popular neighborhoods.
Neighborhoods
Both cities are known for their unique neighborhoods, from Manhattan's trendy Soho and upscale Upper East Side to Philadelphia's historic Old City and vibrant Fishtown. Each city has neighborhoods that cater to various lifestyles, needs, and budgets.
Houses and residents
Type
Manhattan
Philadelphia
Houses
798,144
733,015
Average household size (people)
2
2.5
Houses occupied
738,644 (92.5%)
660,921 (90.2%)
Houses occupied by owners
148,695 (20.1%)
348,935 (52.8%)
Houses occupied by renters
589,949 (79.9%)
311,986 (47.2%)
Median rent asked for vacant for-rent units
$1,690
$1,301
Median price asked for vacant for-sale houses and condos
$3,393,315
$260,453
Estimated median house or condo value
$940,900
$220,700
Median number of rooms in apartments
3.2
4.2
Median number of rooms in houses and condos
4
6.2
Renting percentage
77.2%
45.9%
Housing density (houses/condos per square mile)
34,757
5,426.1
Household income disparities
47.8%
49.5%
Housing units without a mortgage
1,104 (40.3%)
8,484 (4%)
Housing units with both a second mortgage and home equity loan
13 (0.5%)
18,029 (8.5%)
Housing units with a mortgage
1,636 (59.7%)
202,880 (96%)
Housing units with a home equity loan
140 (5.1%)
1,280 (0.6%)
Housing units with a second mortgage
140 (5.1%)
22,966 (10.9%)
Housing units lacking complete kitchen facilities
2%
3.7%
Housing units lacking complete plumbing facilities
Self-employed workers in own not incorporated business
69,517
29,270
State government workers
15,544
16,901
Unpaid family workers
1,861
570
Industries and Occupations
Manhattan is globally recognized for its leading industries in financial services, publishing, fashion, and entertainment. In contrast, Philadelphia has key sectors including healthcare, education, food processing, and oil refining. Although each city has a wide range of employment opportunities, the dominant industries differ.
Both cities have access to world-class healthcare services. Manhattan is home to top-notch hospitals like Mount Sinai and New York-Presbyterian, while Philadelphia houses the prestigious University of Pennsylvania Health System and Children's Hospital of Philadelphia.
Health (county statistics)
Type
Manhattan
Philadelphia
General health status score of residents in this county from 1 (poor) to 5 (excellent)
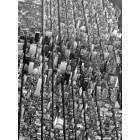
Manhattan’s infrastructure is known to be congested due to its dense population and skyscrapers. On the other hand, Philadelphia’s historic streets and colonial architecture allow for easier navigation. Both cities have robust infrastructure that includes public parks, museums, libraries, and other recreational facilities.
Infrastructure
Type
Manhattan
Philadelphia
TV stations
30
24
Culture and Food
Manhattan is renowned for its cultural institutions, like Broadway and the Metropolitan Museum of Art, and for its diverse international food scene. Philadelphia holds a deep historical significance to America and is famous for its food culture, particularly its cheesesteak and hoagies.
Sports Teams
Both cities are home to prominent sports teams. Manhattan's New York Yankees and Knicks garner worldwide attention while Philadelphia's Eagles and 76ers have passionate local followings. Whichever city you choose, you'll find exciting sporting events and a vibrant fan culture.

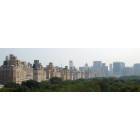
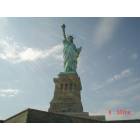
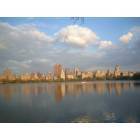


 Manhattan, NY
 Philadelphia, PA