Manhattan, NY, and Northeast Tarrant, TX, are vastly different places, each with its unique offerings. Both cities appeal to different lifestyles and preferences. Manhattan, known for its high-paced lifestyle, diverse culture, and bustling economy, contrasts with Northeast Tarrant's more laid-back, suburban lifestyle. This comparison covers several aspects ranging from crime and safety to state taxes and healthcare focusing on individuals looking to relocate or those merely visiting.
Manhattan, NY has a higher crime rate than Northeast Tarrant, TX, owing primarily to its urban nature and population density. However, Manhattan offers robust law enforcement and numerous neighborhood watch programs. On the other hand, Northeast Tarrant has a relatively lower crime rate, common in suburban areas. Both locations have their safety measures in place, although potential risks in Manhattan may be higher due to its urban setting.
Cost of Living
The cost of living in Manhattan is significantly higher than in Northeast Tarrant, reflecting the average income, housing costs, and the price index of goods and services. Northeast Tarrant provides a more affordable cost of living, suitable for families and individuals on a budget.
Income Tax
New York State levies an income tax, while Texas does not. This difference can play a significant role in individuals' financial planning.
Property Tax
Both states have high property taxes, with Texas generally having higher rates. This factor significantly affects homeowners in both locations.
Sales Tax
New York City has a higher sales tax rate of 8.875% compared to Texas' 6.25%. Buyers might find Northeast Tarrant more budget-friendly in this regard.
Income
Type
Manhattan
Northeast Tarrant
Estimated median household income
$84,435
$90,881
Estimated per capita income
$76,589
$45,353
Cost of living index (U.S. average is 100)
185.3
102
If you make $50,000 in Northeast Tarrant, you will have to make $90,833 in Manhattan to maintain the same standard of living.
Geographical Conditions
Manhattan's geography is dominated by its iconic skyline and rivers. In contrast, Northeast Tarrant's landscape features flat grasslands and the Trinity River, offering more natural spaces.
Geographical information
Type
Manhattan
Northeast Tarrant
Land area
23 sq. miles
206.9 sq. miles
Population density
70,629 people per sq. mile
2,284.3 people per sq. mile
Relative area comparison
Manhattan, NY Northeast Tarrant, TX
Education
Both Manhattan and Northeast Tarrant have excellent education systems. Manhattan's education system is vast, with many prestigious universities and schools. However, Northeast Tarrant focuses on quality education with a smaller scale but still boasting good schools and community colleges.
Manhattan has a strong, diverse economy with sectors like finance, commerce, and technology leading. Jobs are plentiful, but competition can also be high. Contrastingly, Northeast Tarrant's smaller economy revolves more around local businesses, with manufacturing and retail trade being significant economic contributors.
Biggest Employers
In Manhattan, big names like J.P. Morgan Chase & Co., Citigroup, and Verizon are major employers. Northeast Tarrant is home to companies such as Bell Helicopter, General Motors, and other retail giants for employment.
In Manhattan (New York County), 83.9% voted for Democrats and 14.9% for Republicans in 2012 Presidential Election. In Northeast Tarrant (Tarrant County), 41.4% voted for Democrats and 57.1% for Republicans.
Elections
Type
Democrats
Republicans
Other
Year
Manhattan
Northeast Tarrant
Manhattan
Northeast Tarrant
Manhattan
Northeast Tarrant
2020
86.5%
49.3%
12.2%
49.1%
1.2%
1.6%
2016
86.7%
43.2%
9.7%
51.8%
3.6%
5.0%
2012
83.9%
41.4%
14.9%
57.1%
1.2%
1.4%
2008
86.1%
43.8%
13.5%
55.5%
0.3%
0.7%
2004
82.3%
37.0%
16.8%
62.5%
0.9%
0.5%
2000
80.0%
36.9%
14.5%
60.9%
5.5%
2.3%
1996
80.0%
41.6%
13.8%
50.9%
6.3%
7.5%
Breakdown of population affiliated with a religious congregation
Type
Adherents
Congregations
Religion
Manhattan
Northeast Tarrant
Manhattan
Northeast Tarrant
CATHOLIC CHURCH
20.4%
11.1%
12.6%
1.9%
MUSLIM ESTIMATE
2.7%
2.2%
2.4%
0.9%
EPISCOPAL CHURCH
1.7%
0.3%
5.3%
0.8%
AMERICAN BAPTIST CHURCHES IN THE USA
1.6%
0.0%
4.7%
0.1%
REFORMED CHURCH IN AMERICA
0.6%
0.0%
1.2%
0.0%
PATRIAR PARISHE RUSSIAN ORTHODO CHURCH USA
0.4%
0.0%
0.2%
0.0%
SEVENTH DAY ADVENTIST CHURCH
0.3%
0.4%
2.4%
1.6%
SOUTHERN BAPTIST CONVENTION
0.2%
17.3%
2.9%
33.3%
LUTHERAN CHURCH
0.0%
0.5%
0.6%
0.9%
Weather
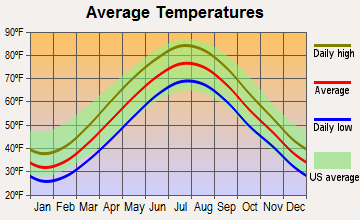
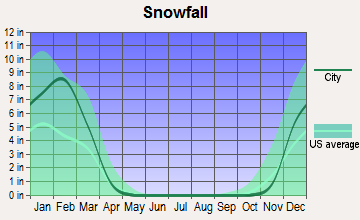
In terms of weather, Manhattan experiences all four seasons with hot summers and cold, snowy winters. Northeast Tarrant has a humid subtropical climate with hot, humid summers and mild to cool winters. This may make Northeast Tarrant more appealing to those who prefer a milder winter climate.
Weather and climate
Type
Manhattan
Northeast Tarrant
Temperature - Average
54.6°F
64.6°F
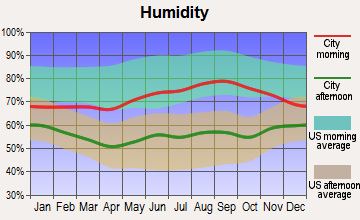
Humidity - Average morning or afternoon humidity
67.4%
71.3%
Humidity - Differences between morning and afternoon humidity
30%
34%
Humidity - Maximum monthly morning or afternoon humidity
77%
82%
Humidity - Minimum monthly morning or afternoon humidity
47%
48%
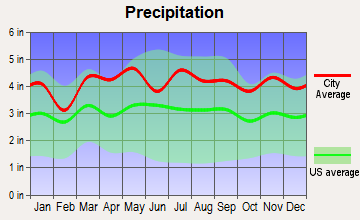
Precipitation - Yearly average
49.6 in
37.2 in
Snowfall - Yearly average
57.4 in
4.2 in
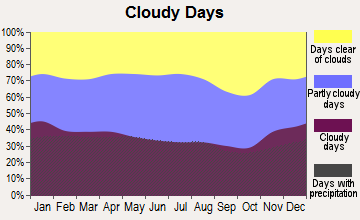
Clouds - Number of days clear of clouds
17.8%
22.8%
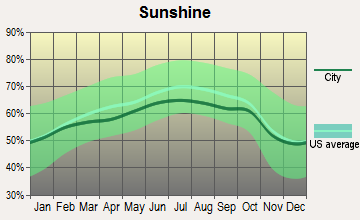
Sunshine amount - Average
60.2%
66.6%
Sunshine amount - Differences during a year
20%
20%
Sunshine amount - Maximum monthly
64%
74%
Sunshine amount - Minimum monthly
44%
54%
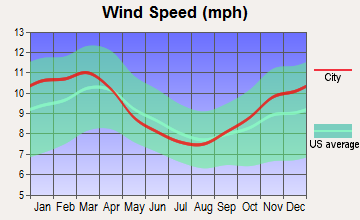
Wind speed - Average
6.7 mph
10.3 mph
Average climate in Manhattan, New York
Average climate in Northeast Tarrant, Texas
Air pollution
Type
AQI
CO
NO2
OZONE
PB
PM10
PM25
SO2
Year
Manhattan
Northeast Tarrant
Manhattan
Northeast Tarrant
Manhattan
Northeast Tarrant
Manhattan
Northeast Tarrant
Manhattan
Manhattan
Manhattan
Northeast Tarrant
Manhattan
Northeast Tarrant
2018
94
86
0.29
N/A
17.3
5.8
23.9
27.9
N/A
N/A
N/A
N/A
7.9
9.2
0.5
0.4
2017
97
84
0.16
N/A
17.4
5.9
24.0
28.0
N/A
N/A
N/A
N/A
7.7
8.6
0.4
0.3
2016
94
75
0.28
N/A
18.1
6.2
24.2
26.4
N/A
N/A
N/A
N/A
7.7
8.2
0.6
0.2
2015
100
81
0.36
N/A
18.9
6.5
23.0
25.7
N/A
N/A
N/A
N/A
8.6
8.5
1.0
0.3
2014
95
77
0.40
0.22
19.1
6.6
22.3
27.1
N/A
N/A
N/A
N/A
8.3
9.4
1.1
0.3
2013
97
95
0.43
0.25
19.5
6.8
22.6
28.0
N/A
N/A
N/A
N/A
9.0
11.3
1.1
0.2
2012
99
108
0.46
0.26
18.6
8.1
23.4
30.7
N/A
N/A
N/A
N/A
9.3
10.8
1.7
0.3
2011
108
98
0.46
0.23
20.7
8.0
22.2
30.8
N/A
N/A
N/A
N/A
10.9
10.2
2.7
0.6
2010
113
76
0.45
0.23
19.3
8.7
23.3
28.0
N/A
N/A
N/A
N/A
10.4
8.5
2.7
0.7
2009
104
93
0.51
0.25
21.9
8.9
18.8
29.1
N/A
N/A
N/A
N/A
10.7
8.7
3.8
0.5
2008
110
89
0.49
0.25
23.0
9.7
19.8
27.5
0.013
N/A
N/A
N/A
12.3
9.4
4.6
0.5
2007
121
91
0.56
0.30
24.4
10.8
19.4
25.1
0.016
N/A
N/A
N/A
13.1
9.7
5.5
0.3
2006
116
99
0.64
0.34
24.6
10.6
18.9
30.2
0.018
N/A
N/A
N/A
12.9
9.5
6.5
0.7
2005
112
109
0.77
0.34
26.7
12.3
18.4
29.1
N/A
N/A
N/A
N/A
N/A
10.7
8.2
0.9
2004
108
90
0.77
0.39
26.7
11.6
17.3
25.7
0.030
N/A
N/A
N/A
N/A
N/A
8.0
0.8
2003
107
97
0.83
0.40
27.8
12.3
17.5
27.2
0.024
N/A
26.9
N/A
N/A
N/A
8.2
1.0
2002
122
97
0.78
0.37
27.9
13.0
18.7
25.4
0.008
N/A
25.9
N/A
N/A
N/A
7.3
0.4
2001
123
88
0.79
0.48
29.4
14.3
19.4
26.0
0.020
N/A
25.0
N/A
N/A
N/A
8.7
1.0
2000
115
104
0.90
0.55
30.2
14.5
15.0
27.1
0.022
N/A
22.2
N/A
N/A
N/A
8.4
1.1
Natural disasters
Type
Manhattan
Northeast Tarrant
Tornado activity compared to U.S. average
59.1%
252.8%
Earthquake activity compared to U.S. average
31.1%
578.9%
Natural disasters compared to U.S. average
18%
23%
Transportation
Manhattan thrives on public transit, with a robust network of subways, buses, and taxis. However, Northeast Tarrant is more car-oriented, requiring personal vehicles for commuting due to less developed public transit.
Transport
Type
Manhattan
Northeast Tarrant
Amtrak stations nearby
3
1
FAA registered aircraft
2
0
Means of transportation to work
Type
Manhattan
Northeast Tarrant
Bicycle
0.9%
0.2%
Bus
10.1%
0%
Carpooled
3.4%
9.8%
Car alone
7.6%
84.8%
Motorcycle
0.1%
0.1%
Railroad
1.1%
0%
Streetcar
0.1%
0%
Subway
43.6%
0%
Taxicab
4.7%
0.1%
Walked
21.9%
0.9%
Average travel time to work
Type
Manhattan
Northeast Tarrant
Average
30.3 min
26.8 min
Real Estate
Real estate in Manhattan is expensive and mostly consists of apartments and condominiums. Northeast Tarrant, in contrast, features affordable housing with more options for single-family homes.
Neighborhoods
Manhattan offers multiple vibrant neighborhoods, each with its unique culture and lifestyle. Northeast Tarrant offers quieter, family-friendly neighborhoods known for their tranquility and safety.
Houses and residents
Type
Manhattan
Northeast Tarrant
Houses
798,144
155,788
Average household size (people)
2
2.7
Houses occupied
738,644 (92.5%)
149,489 (96%)
Houses occupied by owners
148,695 (20.1%)
101,491 (67.9%)
Houses occupied by renters
589,949 (79.9%)
47,998 (32.1%)
Median rent asked for vacant for-rent units
$1,690
$1,297
Median price asked for vacant for-sale houses and condos
$3,393,315
$288,870
Estimated median house or condo value
$940,900
$337,949
Median number of rooms in apartments
3.2
4.1
Median number of rooms in houses and condos
4
6.5
Renting percentage
77.2%
32.5%
Housing density (houses/condos per square mile)
34,757
752.8
Household income disparities
47.8%
38.7%
Housing units without a mortgage
1,104 (40.3%)
18,262 (19.1%)
Housing units with both a second mortgage and home equity loan
13 (0.5%)
88 (0.1%)
Housing units with a mortgage
1,636 (59.7%)
77,313 (80.9%)
Housing units with a home equity loan
140 (5.1%)
4,029 (4.2%)
Housing units with a second mortgage
140 (5.1%)
5,649 (5.9%)
Housing units lacking complete kitchen facilities
2%
0.4%
Housing units lacking complete plumbing facilities
1.7%
0.2%
Housing units in structures
Housing units in structures
Manhattan
Northeast Tarrant
One, detached
0.3%
69.3%
One, attached
0.5%
2.8%
Two
0.6%
1.0%
3 or 4
2.1%
4.1%
5 to 9
6.3%
6.9%
10 to 19
12.6%
5.5%
20 to 49
24.5%
2.1%
50 or more
53.0%
6.2%
Mobile homes
0.0%
2.1%
Median real estate property taxes paid for housing units
Self-employed workers in own not incorporated business
69,517
11,886
State government workers
15,544
4,379
Unpaid family workers
1,861
466
Industries and Occupations
Key industries in Manhattan are finance, real estate, and tech, whereas manufacturing and retail dominate Northeast Tarrant. This impacts the type of occupations prevalent in the locales, with Manhattan favoring corporate jobs and Northeast Tarrant leaning towards technical and sales jobs.
Manhattan houses some of the best hospitals in the country, providing high-quality healthcare. Northeast Tarrant also offers good healthcare facilities, although on a smaller scale.
Health (county statistics)
Type
Manhattan
Northeast Tarrant
General health status score of residents in this county from 1 (poor) to 5 (excellent)
Manhattan is famous for its skyscrapers, bridges, and tunnels, reflecting well-developed infrastructure. Northeast Tarrant boasts of well-maintained suburban amenities, public parks, and road networks. Both offer different settings suitable to varying lifestyle preferences.
Infrastructure
Type
Manhattan
Northeast Tarrant
TV stations
30
25
Culture and Food
Manhattan is a cultural melting pot offering diverse cuisine and rich cultural experiences. Northeast Tarrant also offers a mix of culture, albeit on a smaller scale, and Texas barbecue and Tex-Mex are local staples.
Sports Teams
Manhattan hosts prominent teams, including the New York Yankees and Knicks. Northeast Tarrant, while not hosting national teams, still offers a vibrant local sports scene and is close to Dallas, which has its own major teams.
 Manhattan, NY
 Northeast Tarrant, TX