Manhattan, well-known as the heart of New York City, and El Paso, the culturally rich city in Texas, both offer diverse experiences depending on one's lifestyle preferences. Manhattan is known for its hustle and bustle, towering skyscrapers, diverse culture, and higher standard of living, while El Paso has a more familial feel, lower living costs and offers warmer weather. This comparison provides an in-depth look into key aspects of both cities for those looking to relocate or just visit.
Manhattan has a higher crime rate compared to El Paso. However, the crime in Manhattan is generally concentrated in certain areas and many neighborhoods are quite safe. El Paso, on the other hand, consistently ranks as one of the safest large cities in the US. It's worth noting that, like any city, both have areas that are safer than others, so do your research before settling.
Cost of Living
Living costs are significantly lower in El Paso compared to Manhattan. Housing is the biggest factor in this difference, with median home costs in Manhattan being among the highest in the country. Everything from groceries, entertainment, to healthcare tend to be more expensive in Manhattan.
Income Tax
New York State imposes an income tax, with rates ranging from 4% to 8.82%, in addition to a city income tax. Texas, including El Paso, does not impose any state or city income tax.
Property Tax
Manhattan's property tax rates are lower at an average of 0.88% of the property's assessed fair market value, but the high property values increase the amounts paid. El Paso has a higher average rate, 2.13%, but lower overall property values.
Sales Tax
New York City, including Manhattan, has a 8.875% sales tax. Texas imposes a 6.25% state sales tax, and El Paso has an additional local sales tax of 2%, making a total of 8.25%.
Income
Type
Manhattan
El Paso
Estimated median household income
$84,435
$51,241
Estimated per capita income
$76,589
$25,670
Cost of living index (U.S. average is 100)
185.3
82.2
If you make $50,000 in El Paso, you will have to make $112,713 in Manhattan to maintain the same standard of living.
Geographical Conditions
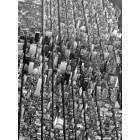
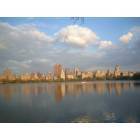
Manhattan is predominantly an urban landscape, surrounded by rivers and near the Atlantic Ocean. Contrarily, El Paso has a unique setting at the foothills of the Franklin Mountains, with a desert landscape and proximity to the Rio Grande.
Geographical information
Type
Manhattan
El Paso
Land area
23 sq. miles
249.1 sq. miles
Population density
70,629 people per sq. mile
2,723.7 people per sq. mile
Relative area comparison
Manhattan, NY El Paso, TX
Education
Both cities boast a variety of educational opportunities. Manhattan is home to numerous prestigious institutions like Columbia University and New York University. El Paso offers the University of Texas at El Paso and several community colleges. Both cities have a variety of public, private, and charter schools for K-12 education.
Manhattan has a diverse economy with opportunities in a multitude of industries such as finance, fashion, entertainment, and tech. El Paso's economy is more focused on sectors like healthcare, education, and the military. Both cities have seen recent growth in job opportunities, but salaries tend to be higher in Manhattan, compensating for the higher cost of living.
Biggest Employers
In Manhattan, some of the biggest employers include JP Morgan Chase, Citigroup, and the New York-Presbyterian Hospital. In El Paso, the largest employers are Fort Bliss, the University of Texas at El Paso, and city and county government offices.
In Manhattan (New York County), 83.9% voted for Democrats and 14.9% for Republicans in 2012 Presidential Election. In El Paso (El Paso County), 65.5% voted for Democrats and 33.2% for Republicans.
Elections
Type
Democrats
Republicans
Other
Year
Manhattan
El Paso
Manhattan
El Paso
Manhattan
El Paso
2020
86.5%
66.8%
12.2%
31.6%
1.2%
1.6%
2016
86.7%
69.1%
9.7%
26.0%
3.6%
4.9%
2012
83.9%
65.5%
14.9%
33.2%
1.2%
1.3%
2008
86.1%
66.0%
13.5%
33.4%
0.3%
0.6%
2004
82.3%
56.2%
16.8%
43.3%
0.9%
0.5%
2000
80.0%
57.9%
14.5%
39.8%
5.5%
2.3%
1996
80.0%
62.3%
13.8%
32.1%
6.3%
5.6%
Breakdown of population affiliated with a religious congregation
Type
Adherents
Congregations
Religion
Manhattan
El Paso
Manhattan
El Paso
CATHOLIC CHURCH
20.4%
43.2%
12.6%
11.3%
MUSLIM ESTIMATE
2.7%
0.1%
2.4%
0.2%
EPISCOPAL CHURCH
1.7%
0.1%
5.3%
1.0%
AMERICAN BAPTIST CHURCHES IN THE USA
1.6%
0.0%
4.7%
0.0%
REFORMED CHURCH IN AMERICA
0.6%
0.0%
1.2%
0.0%
PATRIAR PARISHE RUSSIAN ORTHODO CHURCH USA
0.4%
0.0%
0.2%
0.0%
SEVENTH DAY ADVENTIST CHURCH
0.3%
0.3%
2.4%
1.6%
SOUTHERN BAPTIST CONVENTION
0.2%
3.3%
2.9%
26.6%
Weather
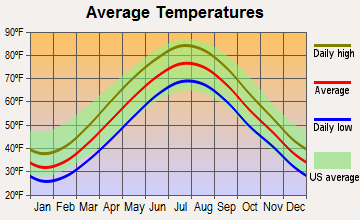
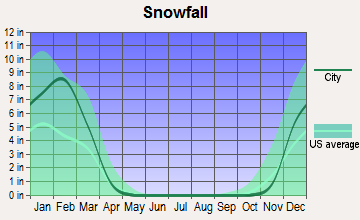
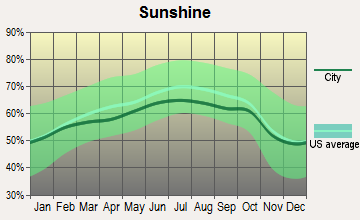
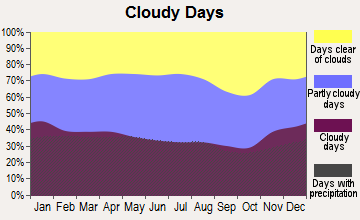
Manhattan experiences a humid subtropical climate with four distinct seasons, summers are hot and humid while winters can be harsh and snowy. El Paso, conversely, has a desert climate with hot summers and mild, dry winters. El Paso boasts over 300 days of sunshine each year, significantly more than Manhattan's average.
Weather and climate
Type
Manhattan
El Paso
Temperature - Average
54.6°F
64.6°F
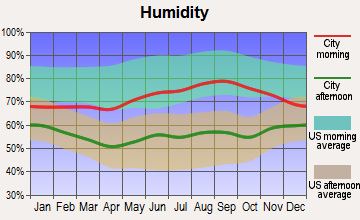
Humidity - Average morning or afternoon humidity
67.4%
42.7%
Humidity - Differences between morning and afternoon humidity
30%
42.8%
Humidity - Maximum monthly morning or afternoon humidity
77%
59.8%
Humidity - Minimum monthly morning or afternoon humidity
47%
17%
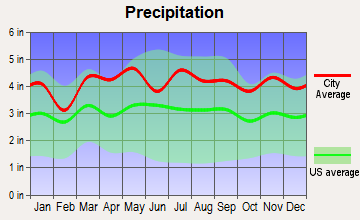
Precipitation - Yearly average
49.6 in
9.4 in
Snowfall - Yearly average
57.4 in
10.7 in
Clouds - Number of days clear of clouds
17.8%
31.8%
Sunshine amount - Average
60.2%
89.4%
Sunshine amount - Differences during a year
20%
13.9%
Sunshine amount - Maximum monthly
64%
89.3%
Sunshine amount - Minimum monthly
44%
75.4%
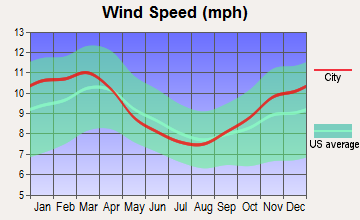
Wind speed - Average
6.7 mph
8.9 mph
Average climate in Manhattan, New York
Average climate in El Paso, Texas
Air pollution
Type
AQI
CO
NO2
OZONE
PB
PM10
PM25
SO2
Year
Manhattan
El Paso
Manhattan
El Paso
Manhattan
El Paso
Manhattan
El Paso
Manhattan
El Paso
Manhattan
El Paso
Manhattan
El Paso
Manhattan
El Paso
2018
94
139
0.29
0.17
17.3
14.0
23.9
32.0
N/A
N/A
N/A
35.7
7.9
9.2
0.5
N/A
2017
97
173
0.16
0.19
17.4
13.0
24.0
30.5
N/A
N/A
N/A
40.4
7.7
9.5
0.4
0.5
2016
94
148
0.28
0.17
18.1
12.6
24.2
30.6
N/A
N/A
N/A
35.2
7.7
9.2
0.6
0.5
2015
100
112
0.36
0.18
18.9
12.7
23.0
30.8
N/A
N/A
N/A
31.2
8.6
8.0
1.0
0.5
2014
95
157
0.40
0.13
19.1
12.8
22.3
30.0
N/A
N/A
N/A
40.3
8.3
9.7
1.1
0.4
2013
97
211
0.43
0.23
19.5
14.1
22.6
30.5
N/A
N/A
N/A
43.9
9.0
10.8
1.1
0.4
2012
99
229
0.46
0.30
18.6
15.9
23.4
31.6
N/A
N/A
N/A
40.2
9.3
11.6
1.7
0.4
2011
108
221
0.46
0.23
20.7
15.9
22.2
31.2
N/A
N/A
N/A
34.7
10.9
11.6
2.7
0.5
2010
113
211
0.45
0.25
19.3
15.3
23.3
29.4
N/A
N/A
N/A
28.8
10.4
7.9
2.7
0.3
2009
104
117
0.51
0.23
21.9
15.4
18.8
29.5
N/A
N/A
N/A
28.6
10.7
8.3
3.8
0.3
2008
110
210
0.49
0.25
23.0
15.2
19.8
30.1
0.013
0.017
N/A
34.6
12.3
9.7
4.6
0.6
2007
121
134
0.56
0.28
24.4
13.9
19.4
30.6
0.016
0.019
N/A
40.5
13.1
8.4
5.5
0.4
2006
116
241
0.64
0.37
24.6
14.3
18.9
30.6
0.018
0.018
N/A
55.0
12.9
11.1
6.5
0.3
2005
112
159
0.77
0.43
26.7
13.1
18.4
29.6
N/A
0.013
N/A
44.5
N/A
9.6
8.2
0.6
2004
108
183
0.77
0.38
26.7
13.5
17.3
29.2
0.030
0.020
N/A
47.3
N/A
8.2
8.0
0.4
2003
107
278
0.83
0.46
27.8
15.5
17.5
29.5
0.024
0.039
26.9
60.4
N/A
10.8
8.2
0.6
2002
122
203
0.78
0.43
27.9
16.4
18.7
30.5
0.008
0.034
25.9
53.3
N/A
11.0
7.3
0.4
2001
123
139
0.79
0.51
29.4
15.5
19.4
28.7
0.020
0.046
25.0
N/A
N/A
9.8
8.7
0.7
2000
115
145
0.90
0.67
30.2
17.8
15.0
27.8
0.022
0.072
22.2
N/A
N/A
9.1
8.4
1.0
Natural disasters
Type
Manhattan
El Paso
Tornado activity compared to U.S. average
59.1%
4.2%
Earthquake activity compared to U.S. average
31.1%
524.4%
Natural disasters compared to U.S. average
18%
11%
Transportation
Both cities offer public transportation, but Manhattan's system is more expansive, including a subway, buses, and ferries. Driving in Manhattan is less common due to heavy traffic and expensive parking. In El Paso, public transportation options are available, but many residents use cars for commuting due to the city's spread-out nature.
Transport
Type
Manhattan
El Paso
Amtrak stations
0
1
Amtrak stations nearby
3
1
FAA registered aircraft
2
331
FAA registered aircraft manufacturers and dealers
0
6
Means of transportation to work
Type
Manhattan
El Paso
Bicycle
0.9%
0.3%
Bus
10.1%
1.3%
Carpooled
3.4%
11.2%
Car alone
7.6%
83.4%
Motorcycle
0.1%
0.2%
Railroad
1.1%
0%
Streetcar
0.1%
0%
Subway
43.6%
0%
Taxicab
4.7%
0.1%
Walked
21.9%
1.6%
Average travel time to work
Type
Manhattan
El Paso
Average
30.3 min
25.1 min
Real Estate
The real-estate market in Manhattan is pricier. It's common for residents to rent rather than own, although luxury apartments and townhouses are available for purchase. In El Paso, the real-estate market is more affordable, with various choices from downtown apartments to suburban homes.
Neighborhoods
Manhattan is known for its diverse neighborhoods, with SoHo, Tribeca, and the Upper East Side among the favorites. In El Paso, neighborhoods like Kern Place, Sunset Heights, and Mission Hills offer a mix of historic and contemporary charm.
Houses and residents
Type
Manhattan
El Paso
Houses
798,144
261,779
Average household size (people)
2
3
Houses occupied
738,644 (92.5%)
242,529 (92.6%)
Houses occupied by owners
148,695 (20.1%)
147,788 (60.9%)
Houses occupied by renters
589,949 (79.9%)
94,741 (39.1%)
Median rent asked for vacant for-rent units
$1,690
$570.82
Median price asked for vacant for-sale houses and condos
$3,393,315
$227,007
Estimated median house or condo value
$940,900
$152,800
Median number of rooms in apartments
3.2
4.3
Median number of rooms in houses and condos
4
6.2
Renting percentage
77.2%
39.6%
Housing density (houses/condos per square mile)
34,757
1,051
Household income disparities
47.8%
46.6%
Housing units without a mortgage
1,104 (40.3%)
1,889 (2.2%)
Housing units with both a second mortgage and home equity loan
13 (0.5%)
2,956 (3.4%)
Housing units with a mortgage
1,636 (59.7%)
84,973 (97.8%)
Housing units with a home equity loan
140 (5.1%)
250 (0.3%)
Housing units with a second mortgage
140 (5.1%)
3,635 (4.2%)
Housing units lacking complete kitchen facilities
2%
2%
Housing units lacking complete plumbing facilities
Self-employed workers in own not incorporated business
69,517
19,650
State government workers
15,544
12,525
Unpaid family workers
1,861
901
Industries and Occupations
The top industries in Manhattan are finance, tech, real estate, and media. In El Paso, healthcare, education, trade, and transportation are the leading sectors. Both cities have a mix of high-skilled and low-skilled jobs, but Manhattan has a higher percentage of headquarters and executive-level jobs.
Both cities provide robust healthcare systems. Manhattan boasts nationally ranked hospitals such as NYU Langone Centers and New York-Presbyterian Hospital. El Paso's healthcare revolves around major facilities like University Medical Center of El Paso and a variety of clinics and specialized services.
Health (county statistics)
Type
Manhattan
El Paso
General health status score of residents in this county from 1 (poor) to 5 (excellent)
Manhattan's infrastructure is dense, with skyscrapers, apartments, and historical buildings. Its subway system is comprehensive but can also be crowded and daunting for newcomers. El Paso, meanwhile, is more spread out and less dense, with infrastructure focusing on single-family homes and low-rise commercial buildings. Its highway system is expansive and less congested than Manhattan's streets.
Infrastructure
Type
Manhattan
El Paso
TV stations
30
10
Culture and Food
Manhattan is globally recognized for its vibrant culture and food scene, offering world-class museums, theaters, and diverse cuisines. On the other hand, El Paso is a perfect blend of Mexican and Texan culture, with Tex-Mex cuisine being a local specialty. The city is known for its friendly locals and close-knit community feel.
Sports Teams
Manhattan is home to notable sports teams such as the Knicks (NBA), Rangers (NHL), and Giants (NFL). Meanwhile, El Paso supports its local minor league baseball team, the Chihuahuas, and UTEP's college teams.
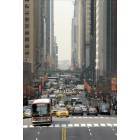


 Manhattan, NY
 El Paso, TX