


Relative area comparison
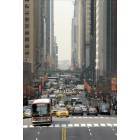
 Manhattan, NY
 Dallas, TX
Manhattan, part of New York City, is an urban, high-paced environment known for its dynamism, cultural diversity, and high cost of living. On the other hand, Dallas, TX, one of the largest cities in the U.S., offers a diverse urban-suburban mix with a growing economy, warmer climate, and a more manageable cost of living. The following compares these two cities on various parameters to provide a comprehensive view for individuals looking to relocate or for tourists visiting these cities.

 | Barometer of Urban Scale, Part I... (259 replies) |
| What does New York lack despite its size that other Acela metros have? (254 replies) |
| Top 10 North American Downtowns (U.S + CAD/Post covid) (132 replies) |
| America's Top 10 Downtown's (2344 replies) |
| NYC experiences that make it worth the premium over Chicago? (190 replies) |
| Visually appears like the largest city (excluding New York, Los Angeles, Chicago, Toronto) (421 replies) |
Manhattan, NY and
Dallas, TX : 1,372.0 miles
Manhattan's population is larger by 26%. The population of Dallas has grown by 99,877 people (8.4%) during that time.
| Population | ||
| Type | Manhattan | Dallas |
|---|---|---|
| Population | 1,621,897 | 1,288,457 |
| Female / male percentage | 52.5% / 47.5%
|
49.5% / 50.5%
|
Overall, both Manhattan and Dallas have crime rates higher than the US average, but specifics vary. In Manhattan, property crime is more common than violent crime, while Dallas has higher rates of both property and violent crime. However, crime-ridden areas exist in both cities and safety greatly depends on the neighborhood. It is recommended to research neighborhoods thoroughly before deciding to relocate or visit.
Living in Manhattan is significantly more expensive than living in Dallas. This is reflected in housing, which is the major contributor to the cost difference. Other costs, such as groceries, health, transportation, and utilities, are also higher in Manhattan compared to Dallas. Business Insider notes that an individual would need a salary of around $40,000 to live comfortably in Dallas, while in Manhattan this figure jumps to over $90,000.
The income tax rate for New York City residents is between 3.078% and 3.876%, depending on income level. Texas is one of the few states with no state income tax, providing a potential financial incentive to relocate to Dallas.
Despite the no state income tax benefit in Texas, Dallas has high property tax rates - over 2%. New York property taxes vary by county, but Manhattan has a property tax rate of about 0.88%. This will be a significant factor if you plan to buy property.
New York City has a sales tax rate of 8.875% while Dallas, in Texas, has a state and local sales tax rate reaching up to 8.25%. Therefore, sales tax won't be a very significant deciding factor between these two cities.
| Income | ||
| Type | Manhattan | Dallas |
|---|---|---|
| Estimated median household income | $84,435 | $57,995 |
| Estimated per capita income | $76,589 | $38,479 |
| Cost of living index (U.S. average is 100) | 185.3 | 96.1 |
If you make $50,000 in Dallas, you will have to make $96,410 in Manhattan to maintain the same standard of living.
Dallas sits on the flat Texas plains, subject to occasional tornadoes. Manhattan is an island surrounded by three rivers and has a varied topography with skyscrapers dominating the cityscape. Both cities have their unique geographical features to offer.
| Geographical information | ||
| Type | Manhattan | Dallas |
|---|---|---|
| Land area | 23 sq. miles | 342.5 sq. miles |
| Population density | 70,629 people per sq. mile | 3,761.4 people per sq. mile |
Manhattan, NY
Dallas, TX
Both cities have a multitude of educational opportunities. While Manhattan boasts of high-ranked institutions like Columbia University and New York University, Dallas is home to the University of Texas at Dallas, Southern Methodist University and others. Dallas has a higher high school graduation rate, but both cities offer a plethora of quality public, private, and charter school options for K-12 students. Dallas might have a cost advantage in terms of tuition fees, but both cities offer competitive and diverse educational opportunities.
| Education level (25-year-olds and older) | ||
| Type | Manhattan | Dallas |
|---|---|---|
| Bachelor's degree or higher | 49.4% | 37.1% |
| Graduate or professional degree | 23.4% | 13.9% |
| High school or higher | 78.7% | 80.6% |
Dallas has a more dynamic economy with many Fortune 500 companies and a strong job market, specifically in technology, healthcare, and financial services. Manhattan, as part of New York City, is also an economic powerhouse, being a global hub for finance, media, fashion, and the arts. Unemployment rates tend to be lower in Dallas, but Manhattan generally provides higher wages. So, the choice might rely more on the industry you are involved in.
In Dallas, some of the largest employers include AT&T, Bank of America, and Texas Health Resources. Manhattan's largest employers are in diverse sectors, with multinational corporations like JP Morgan Chase & Co, Citigroup Inc, and Verizon Communications, providing a large number of jobs.
In Manhattan (New York County), 83.9% voted for Democrats and 14.9% for Republicans in 2012 Presidential Election. In Dallas (Dallas County), 57.3% voted for Democrats and 41.8% for Republicans.
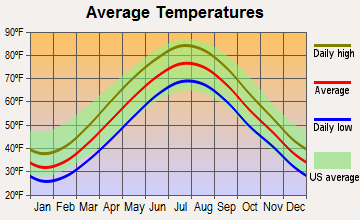
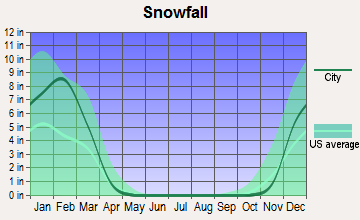
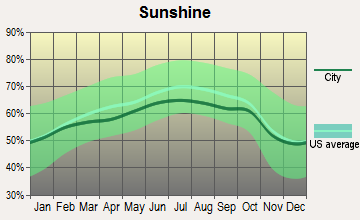
The climate varies significantly between the two cities. Manhattan has a humid subtropical climate with cold winters, hot, humid summers, and moderate precipitation throughout the year. Dallas, another humid subtropical city, experiences hot, humid summers but has milder, short winters. Summer temperatures in Dallas can climb higher than in Manhattan, whereas winter temperatures in Manhattan can drop significantly below those in Dallas.
| Weather and climate | ||
| Type | Manhattan | Dallas |
|---|---|---|
| Temperature - Average | 54.6°F | 66.6°F |
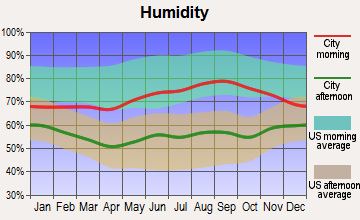
| Humidity - Average morning or afternoon humidity | 67.4% | 71.3% |
| Humidity - Differences between morning and afternoon humidity | 30% | 34% |
| Humidity - Maximum monthly morning or afternoon humidity | 77% | 82% |
| Humidity - Minimum monthly morning or afternoon humidity | 47% | 48% |
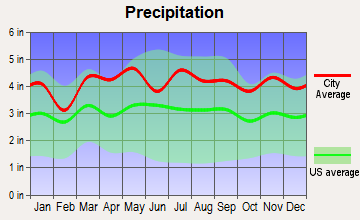
| Precipitation - Yearly average | 49.6 in | 37.3 in |
| Snowfall - Yearly average | 57.4 in | 4.2 in |
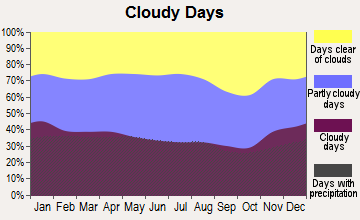
| Clouds - Number of days clear of clouds | 17.8% | 22.8% |
| Sunshine amount - Average | 60.2% | 66.6% |
| Sunshine amount - Differences during a year | 20% | 20% |
| Sunshine amount - Maximum monthly | 64% | 74% |
| Sunshine amount - Minimum monthly | 44% | 54% |
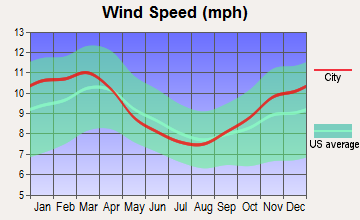
| Wind speed - Average | 6.7 mph | 10.3 mph |
| Natural disasters | ||
| Type | Manhattan | Dallas |
|---|---|---|
| Tornado activity compared to U.S. average | 59.1% | 254.7% |
| Earthquake activity compared to U.S. average | 31.1% | 567% |
| Natural disasters compared to U.S. average | 18% | 21% |
Manhattan has an extensive public transportation system, including subways, buses, and ferries, making it one of the most walkable cities in the U.S. In contrast, Dallas is more car-oriented, with public transit options being less extensive and the majority of residents commuting by car.
| Transport | ||
| Type | Manhattan | Dallas |
|---|---|---|
| Amtrak stations | 0 | 1 |
| Amtrak stations nearby | 3 | 1 |
| FAA registered aircraft | 2 | 2 |
| FAA registered aircraft manufacturers and dealers | 0 | 56 |
| Means of transportation to work | ||
| Type | Manhattan | Dallas |
|---|---|---|
| Bicycle | 0.9% | 0.3% |
| Bus | 10.1% | 1.4% |
| Carpooled | 3.4% | 10.9% |
| Car alone | 7.6% | 83.9% |
| Railroad | 1.1% | 0.2% |
| Streetcar | 0.1% | 0.1% |
| Subway | 43.6% | 0.2% |
| Taxicab | 4.7% | 0.1% |
| Walked | 21.9% | 1.6% |
| Average travel time to work | ||
| Type | Manhattan | Dallas |
|---|---|---|
| Average | 30.3 min | 31.5 min |
Real estate is vastly different in both cities. In Manhattan, expect smaller, pricier living spaces, and in Dallas, one can afford larger homes for similar prices. Renting and buying are both more affordable in Dallas compared to Manhattan.
Manhattan is composed of diverse neighborhoods, each with their unique culture and character, from the luxury of Upper East Side to the artistic Greenwich Village. Dallas also offers a diverse mix of neighborhood options, from vibrant Uptown to the family-friendly suburb of Plano.
| Houses and residents | ||
| Type | Manhattan | Dallas |
|---|---|---|
| Houses | 798,144 | 591,773 |
| Average household size (people) | 2 | 2.6 |
| Houses occupied | 738,644 (92.5%) | 536,008 (90.6%) |
| Houses occupied by owners | 148,695 (20.1%) | 229,518 (42.8%) |
| Houses occupied by renters | 589,949 (79.9%) | 306,490 (57.2%) |
| Median rent asked for vacant for-rent units | $1,690 | $1,403 |
| Median price asked for vacant for-sale houses and condos | $3,393,315 | $574,934 |
| Estimated median house or condo value | $940,900 | $267,600 |
| Median number of rooms in apartments | 3.2 | 3.7 |
| Median number of rooms in houses and condos | 4 | 6.1 |
| Renting percentage | 77.2% | 55.9% |
| Housing density (houses/condos per square mile) | 34,757 | 1,727.6 |
| Household income disparities | 47.8% | 48.2% |
| Housing units without a mortgage | 1,104 (40.3%) | 1,309 (1%) |
| Housing units with both a second mortgage and home equity loan | 13 (0.5%) | 3,320 (2.6%) |
| Housing units with a mortgage | 1,636 (59.7%) | 124,846 (99%) |
| Housing units with a home equity loan | 140 (5.1%) | 204 (0.2%) |
| Housing units with a second mortgage | 140 (5.1%) | 5,351 (4.2%) |
| Housing units lacking complete kitchen facilities | 2% | 1.2% |
| Housing units lacking complete plumbing facilities | 1.7% | 0.9% |
Dallas boasts industries like healthcare, technology, financial services, and energy. Major occupations here include management, business, science, and arts. Manhattan, a part of the NYC metropolitan area, is a major center for banking and finance, retailing, world trade, transportation, tourism, real estate, media, advertising, legal services, accounting and insurance.
Both cities have excellent healthcare options. Dallas is home to the renowned UT Southwestern Medical Center, and Manhattan has world-class facilities like New York-Presbyterian Hospital, NYU Langone, and Mount Sinai Hospital.
| Health (county statistics) | ||
| Type | Manhattan | Dallas |
|---|---|---|
| General health status score of residents in this county from 1 (poor) to 5 (excellent) | 3.6 | 3.4 |
| Average weight of females (lbs) | 150.1 lbs | 171 lbs |
| Average weight of males (lbs) | 180.1 lbs | 194.3 lbs |
| Residents visited a dentist within the past year | 77.7% | 61.7% |
| Residents exercised in the past month | 79% | 71.4% |
| Residents keep firearms around their homes | 1.6% | 23.8% |
| Adult residents drank alcohol in the past 30 days | 84% | 69.3% |
| Residents smoked 100+ cigarettes in their lives | 46.3% | 39.8% |
Manhattan's infrastructure is mature but aged, with a dense network of public transportation, high-rises, and utility systems that can downside to outages or delays. Dallas, being more spread out and newer, has less public transportation but more roads and highways. Both cities offer amenities like parks and recreational facilities, with Central Park in Manhattan being world-famous.
| Infrastructure | ||
| Type | Manhattan | Dallas |
|---|---|---|
| TV stations | 30 | 25 |
Manhattan offers an international mix of cultures, with numerous museums, theaters, concerts and dining options. From Broadway shows to Central Park's concerts to countless ethnic food restaurants, diversity thrives here. Dallas too offers a rich culture, shaped by its historical roots, with food being heavily influenced by traditional Southern and Mexican cuisine, along with a focus on arts, music, and sports.
For sports enthusiasts, both cities have much to offer. Manhattan is home to two Major League Baseball teams, the Yankees and the Mets, and Dallas hosts the Cowboys (NFL), the Mavericks (NBA), and the Rangers (MLB).