Los Angeles, CA and Chicago, IL are two of the most iconic cities in the United States, each offering unique benefits and challenges. This comparative analysis will explore various aspects affecting anyone looking to relocate or visit these diverse locations: crime rate, weather patterns, cost of living, education systems, economy, infrastructure, main industries, prominent employers, real estate market, neighborhood identities, transportation systems, tax structures, cultural and gastronomic offerings, sports franchises, topographical differences, and health care quality.
Distance between
Los Angeles, CA and
Chicago, IL : 1,745.0 miles
Los Angeles's population is larger by 43%. Its population has grown by 154,477 people (4.2%) since 2000. The population of Chicago has decreased by 199,461 people (6.9%) during that time.
Both Los Angeles and Chicago have neighborhoods with relatively high crime rates, but also areas considered safe. Latest statistics indicate that Chicago has a higher overall crime rate than Los Angeles, but LA struggles with more property crimes. NeighborhoodScout reveals a property crime rate of 35 per 1,000 residents in LA versus 29 in Chicago. Safety risks should always be assessed personally and carefully when deciding on a location within either city.
City-data.com crime index counts serious crimes and violent crime more heavily. It adjusts for the number of visitors and daily workers commuting into cities. (higher means more crime, U.S. average = 301.1)
City-data.com crime index counts serious crimes and violent crime more heavily. It adjusts for the number of visitors and daily workers commuting into cities. (higher means more crime, U.S. average = 301.1)
Sex Offenders
According to our data, there are 4,677 registered sex offenders living in Los Angeles and 3,418 registered sex offenders living in . The ratio of residents to sex offenders in Los Angeles is 850 to 1; the ratio in Chicago is 791 to 1. The number of registered sex offenders compared to the number of residents in Los Angeles is near to than in Chicago.
Cost of Living
Compared to national averages, both cities are pricier. However, Los Angeles noticeably exceeds Chicago in this aspect, largely due to significantly higher housing costs. Essentials like groceries, healthcare, and transportation also tend to cost more in LA, making Chicago a more affordable option for many.
Income Tax
In terms of state income tax, residents in Los Angeles face a progressive tax structure with rates ranging from 1% to 13.3%. For Chicago residents, Illinois adopts a flat rate of 4.95%.
Property Tax
While Los Angeles has higher property values, California has relatively low property tax rates averaging 0.73%. Chicago, despite lower property costs, has a higher average property tax rate of 1.74%.
Sales Tax
Los Angeles has a higher sales tax - California state sales tax is 7.25%, but with local taxes, it can reach up to 9.5%. Chicago's combined state and local sales tax is 10.25%, one of the highest in the nation.
Income
Type
Los Angeles
Chicago
Estimated median household income
$70,372
$66,576
Estimated per capita income
$39,509
$43,217
Cost of living index (U.S. average is 100)
145.1
104.8
If you make $50,000 in Chicago, you will have to make $69,227 in Los Angeles to maintain the same standard of living.
Geographical Conditions
Los Angeles' hilly terrain and proximity to the ocean provide beautiful views and beach opportunities. Chicago, located near Lake Michigan, offers its impressive lakefront with beaches and parks but has a generally flat terrain.
While Los Angeles boasts several renowned universities, such as UCLA and USC, Chicago is home to equally prestigious institutions like the University of Chicago and Northwestern University. Overall, both cities offer robust K-12 and higher education options. However, public schools in both cities face challenges, often underperforming compared to national benchmarks.
Los Angeles' economy is driven by entertainment, technology, fashion, and tourism. Chicago's, meanwhile, is more diversified with finance, manufacturing, and healthcare playing substantial roles. Both cities offer plenty of job opportunities, but your industry of interest might tilt the scales.
Biggest Employers
In Los Angeles, the largest employers include the County of Los Angeles, the Los Angeles Unified School District, and the University of Southern California. Chicago's biggest employers involve the federal and local government, Chicago Public Schools, and Advocate Health Care.
There were 2,475 building permits issued in Los Angeles in 2012 (1950 more than in 2011) compared to 414 building permits issued in Chicago in 2012 (200 more than in 2011).
In Los Angeles (Los Angeles County), 69.7% voted for Democrats and 27.8% for Republicans in 2012 Presidential Election. In Chicago (Cook County), 74.0% voted for Democrats and 24.6% for Republicans.
Elections
Type
Democrats
Republicans
Other
Year
Los Angeles
Chicago
Los Angeles
Chicago
Los Angeles
Chicago
2020
71.0%
74.6%
26.9%
24.1%
2.1%
1.3%
2016
72.0%
74.4%
22.5%
20.9%
5.5%
4.7%
2012
69.7%
74.0%
27.8%
24.6%
2.4%
1.4%
2008
69.2%
76.4%
28.8%
22.9%
1.9%
0.7%
2004
63.3%
70.3%
35.7%
29.2%
1.0%
0.6%
2000
63.6%
69.0%
32.4%
28.8%
4.0%
2.3%
1996
59.3%
66.8%
31.0%
26.7%
9.7%
6.5%
Breakdown of population affiliated with a religious congregation
Type
Adherents
Congregations
Religion
Los Angeles
Chicago
Los Angeles
Chicago
CATHOLIC CHURCH
36.1%
37.5%
4.7%
11.1%
SOUTHERN BAPTIST CONVENTION
1.0%
1.0%
9.0%
5.4%
MUSLIM ESTIMATE
0.7%
3.9%
1.0%
1.8%
AMERICAN BAPTIST CHURCHES IN THE USA
0.5%
0.4%
3.1%
1.6%
SEVENTH DAY ADVENTIST CHURCH
0.5%
0.4%
2.4%
1.9%
EPISCOPAL CHURCH
0.4%
0.4%
1.4%
1.8%
EVANGELICAL LUTHERAN CHURCH IN AMERICA
0.2%
1.0%
1.9%
4.3%
LUTHERAN CHURCH
0.2%
0.9%
1.6%
3.6%
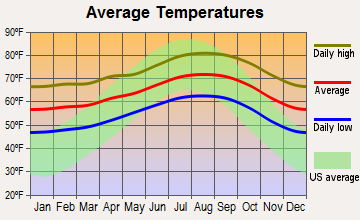
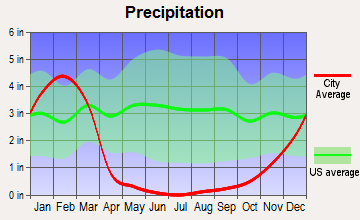
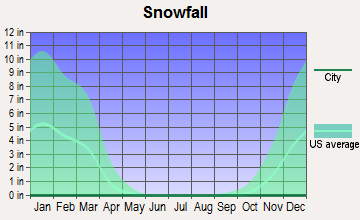
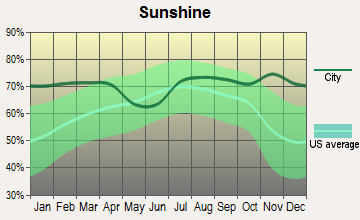
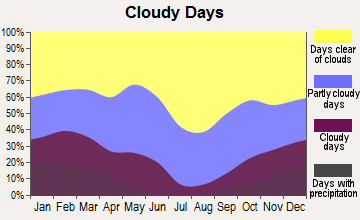
Weather
Los Angeles’ Mediterranean climate offers mild, wet winters and hot, dry summers, attracting people fond of sunshine. Meanwhile, Chicago's Continental climate is characterized by four distinct seasons, including cold winters that might act as a deterrent to some. Yet others may appreciate the beauty of a snowy cityscape and the variety of seasonal changes.
Weather and climate
Type
Los Angeles
Chicago
Temperature - Average
63.9°F
50.3°F
Humidity - Average morning or afternoon humidity
60.9%
75.6%
Humidity - Differences between morning and afternoon humidity
16.1%
31%
Humidity - Maximum monthly morning or afternoon humidity
65.1%
85%
Humidity - Minimum monthly morning or afternoon humidity
49%
54%
Precipitation - Yearly average
17.1 in
37.8 in
Snowfall - Yearly average
0 in
77.6 in
Clouds - Number of days clear of clouds
29.9%
14%
Sunshine amount - Average
78.4%
56.8%
Sunshine amount - Differences during a year
22%
33%
Sunshine amount - Maximum monthly
85%
68%
Sunshine amount - Minimum monthly
63%
35%
Wind speed - Average
2.1 mph
10.7 mph
Average climate in Los Angeles, California
Average climate in Chicago, Illinois
Air pollution
Type
AQI
CO
NO2
OZONE
PB
PM10
PM25
SO2
Year
Los Angeles
Chicago
Los Angeles
Chicago
Los Angeles
Chicago
Los Angeles
Chicago
Los Angeles
Chicago
Los Angeles
Chicago
Los Angeles
Chicago
Los Angeles
Chicago
2018
137
97
0.38
0.26
9.9
14.3
26.9
26.2
0.008
N/A
24.4
23.6
16.0
9.3
0.4
1.7
2017
136
95
0.41
0.25
10.3
14.3
27.2
26.4
0.007
N/A
25.0
25.1
16.2
8.7
0.5
1.4
2016
128
95
0.37
0.21
10.0
14.9
27.7
26.5
0.007
N/A
23.8
17.3
15.4
9.1
0.4
0.8
2015
128
92
0.38
0.51
10.9
15.0
28.5
25.4
0.005
N/A
21.8
23.3
17.4
10.5
0.3
0.9
2014
139
101
0.50
0.45
12.0
18.0
27.8
25.1
0.007
N/A
26.4
28.9
19.9
10.7
0.3
1.3
2013
140
100
0.48
0.37
11.8
18.3
26.2
23.8
0.007
N/A
25.5
30.3
19.0
11.1
0.3
1.0
2012
144
112
0.48
0.36
10.9
18.8
26.3
25.7
0.008
N/A
24.8
31.3
19.9
12.1
0.4
1.7
2011
141
101
0.38
0.38
13.4
18.6
24.2
24.8
0.009
N/A
32.4
21.9
18.3
12.8
0.3
2.4
2010
127
103
0.44
0.37
12.2
20.4
23.2
25.4
0.027
N/A
33.9
22.2
17.3
12.9
0.5
1.4
2009
153
106
0.51
0.29
16.0
20.0
24.0
22.4
0.009
0.025
45.2
20.1
18.8
12.9
1.1
1.4
2008
145
108
0.37
0.32
14.0
22.8
24.8
22.8
0.010
0.026
44.7
22.7
19.5
12.5
1.0
1.8
2007
121
125
0.39
0.34
14.0
23.6
24.3
23.9
0.013
0.027
N/A
25.9
N/A
13.1
1.9
2.2
2006
131
95
0.38
0.31
15.4
23.0
23.1
21.1
0.006
0.029
N/A
22.0
N/A
N/A
1.9
2.6
2005
132
110
0.43
0.55
12.8
23.5
24.1
23.3
0.012
0.027
N/A
26.2
N/A
N/A
3.7
3.3
2004
142
85
0.64
0.83
17.6
23.9
27.5
20.3
0.016
0.032
N/A
23.4
N/A
N/A
2.5
4.1
2003
145
99
0.94
0.69
27.1
25.1
19.8
20.0
0.030
0.030
N/A
23.3
N/A
N/A
2.1
3.1
2002
154
114
1.04
0.83
31.3
26.5
21.7
20.8
0.027
0.029
N/A
24.4
N/A
N/A
2.4
3.3
2001
135
107
1.16
0.83
37.0
27.3
18.7
19.2
0.041
0.031
N/A
28.5
N/A
N/A
2.4
4.3
2000
147
104
1.13
0.88
31.1
24.8
16.7
17.6
0.035
0.046
N/A
N/A
N/A
N/A
1.4
4.2
Natural disasters
Type
Los Angeles
Chicago
Tornado activity compared to U.S. average
16.2%
145.8%
Earthquake activity compared to U.S. average
7,082.4%
136.9%
Natural disasters compared to U.S. average
57%
20%
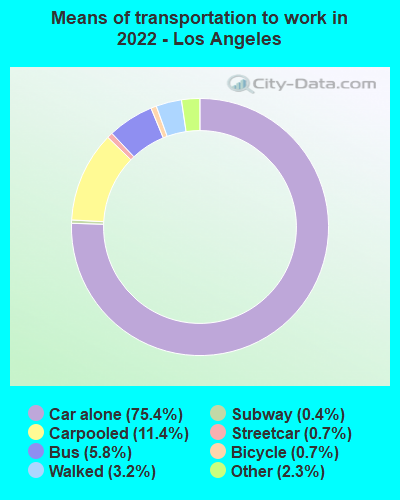
Transportation
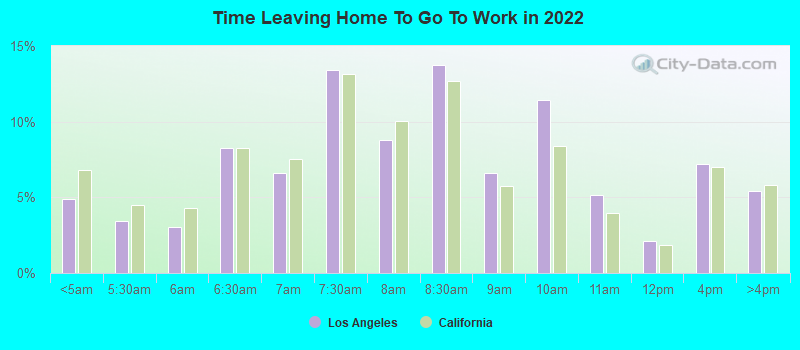
Chicago's public transit system is more extensive than LA's, with the "L" Train and buses covering most of the city, while LA's reliance on highways means having a car is advisable. However, LA has been investing heavily in public transit, expanding its metro and bus systems.
Transport
Type
Los Angeles
Chicago
Amtrak stations
1
1
Amtrak stations nearby
3
3
FAA registered aircraft
669
1
FAA registered aircraft manufacturers and dealers
14
12
Means of transportation to work
Type
Los Angeles
Chicago
Bicycle
0.6%
1.6%
Bus
5.8%
8%
Carpooled
10.6%
8.3%
Car alone
76.5%
62.3%
Ferryboat
0.2%
0%
Motorcycle
0.2%
0%
Railroad
0.1%
0.2%
Streetcar
0.5%
6.8%
Subway
0.2%
3.5%
Taxicab
0.1%
0.8%
Walked
3%
5.9%
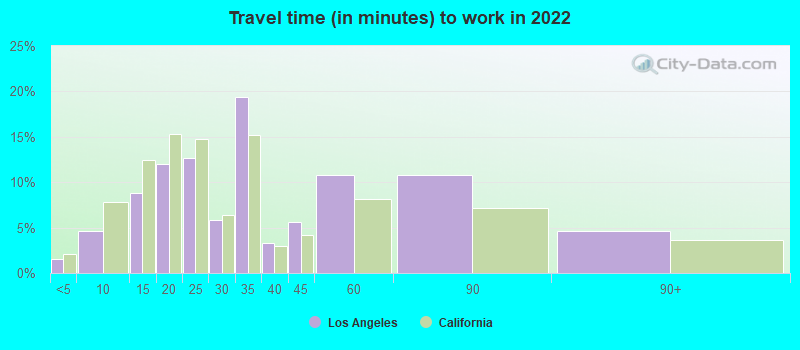
Average travel time to work
Type
Los Angeles
Chicago
Average
34.8 min
36.9 min
Other means
28.5 min
33.1 min
Public transportation
46.4 min
44.8 min
Private vehicle occupancy
Type
Los Angeles
Chicago
Average
1.2
1.2
Drove alone
87.4%
86.7%
In 2 person carpool
10.1%
9.3%
In 3 person carpool
1.6%
2.4%
In 4 person carpool
0.5%
0.9%
In 5-6 person carpool
0.3%
0.4%
In 7+ person carpool
0.1%
0.3%
How many people usually rode to work in the car, truck or van.
Real Estate
Los Angeles has a notoriously hot real estate market with high prices, whereas Chicago’s market is more moderate. Both cities offer diverse housing options, from urban apartments to suburban homes, but your budget will likely go further in Chicago.
Neighborhoods
Both LA and Chicago take pride in their distinct neighborhoods, each offering unique cultural experiences. From LA's beachside communities like Santa Monica to artistic neighborhoods like Silver Lake, or Chicago's ethnic enclaves such as Chinatown and historic areas like the Gold Coast, there’s a place for everyone.
Houses and residents
Type
Los Angeles
Chicago
Houses
1,542,391
1,272,191
Average household size (people)
2.8
2.5
Median year apartment built
1970
1955
Median year house/condo built
1957
1951
Length of stay in the house since moving in
16 years
14.7 years
Houses occupied
1,410,594 (91.5%)
1,139,537 (89.6%)
Houses occupied by owners
521,485 (37%)
530,977 (46.6%)
Houses occupied by renters
889,109 (63%)
608,560 (53.4%)
Median rent asked for vacant for-rent units
$2,146
$1,546
Median monthly housing costs
$1,845
$1,356
Median price asked for vacant for-sale houses and condos
$1,410,311
$355,671
Estimated median house or condo value
$812,800
$297,300
Median numbers of rooms
4.1
4.8
Median number of rooms in apartments
3.4
4
Median number of rooms in houses and condos
5.8
5.8
Median house price - detached houses
Over $1,000,000
$357,707
Median house price - in 2-unit structures
$906,968
$345,352
Median house price - in 3-to-4-unit structures
$752,598
$477,161
Median house price - in 5 or more unit structures
$760,192
$439,589
Median house price - mobile homes
$204,691
$472,017
Median house price - occupied boats, rvs, vans etc.
$134,345
$235,959
Median house price - Townhouses or other attached units
$809,932
$518,665
Median house price - All housing units
Over $1,000,000
$388,874
Median house age
57
70
Renting percentage
61.8%
55.1%
Housing density (houses/condos per square mile)
3,288.2
5,601.1
House value disparities
23.2%
35.6%
Household income disparities
47.7%
48.4%
Median household income for houses/condes with a mortgage
$122,032
$110,175
Median household income for apartments without a mortgage
$83,712
$72,495
Housing units without a mortgage
5,970 (1.6%)
6,624 (1.9%)
Housing units with both a second mortgage and home equity loan
28,556 (7.6%)
17,661 (5.1%)
Housing units with a mortgage
369,242 (98.4%)
339,523 (98.1%)
Housing units with a home equity loan
2,061 (0.5%)
808 (0.2%)
Housing units with a second mortgage
37,750 (10.1%)
25,416 (7.3%)
House/condo owner moved in on average (years ago)
15
12
House/condo renter moved in on average (years ago)
4
2
Housing units lacking complete kitchen facilities
3.1%
2.5%
Housing units lacking complete plumbing facilities
0.9%
1.8%
Housing units in structures
Housing units in structures
Los Angeles
Chicago
One, detached
37.2%
26.4%
One, attached
5.7%
3.5%
Two
2.8%
13.3%
3 or 4
6.3%
14.0%
5 to 9
8.9%
11.0%
10 to 19
9.5%
4.6%
20 to 49
13.1%
6.5%
50 or more
15.9%
20.6%
Mobile homes
0.6%
0.2%
Median real estate property taxes paid for housing units
Self-employed workers in own not incorporated business
200,073
67,964
State government workers
54,504
41,316
Unpaid family workers
4,643
4,164
Industries and Occupations
Los Angeles is renowned for its entertainment industry but also has a significant presence in technology, international trade, and fashion. On the other hand, Chicago is a global hub for finance and also has strong healthcare, education, and food processing sectors. Career opportunities are abundant in both cities but may favor different skill sets.
Both cities house cutting-edge medical facilities. Los Angeles is home to the UCLA Medical Center and Cedars-Sinai, while Chicago boasts the Northwestern Memorial Hospital and Rush University Medical Center.
Health (county statistics)
Type
Los Angeles
Chicago
General health status score of residents in this county from 1 (poor) to 5 (excellent)
Los Angeles' sprawling urban layout often necessitates a car, while Chicago’s grid layout and public transit system make it a more walkable city. Both cities are investing in infrastructure improvement, with LA focusing primarily on expanding public transit and Chicago concentrating on its roads and bridges.
Infrastructure
Type
Los Angeles
Chicago
Hospitals
62
86
TV stations
21
22
Arenas or stadiums
5
7
Bank branches located here
385
740
Bank institutions located here
73
99
Main business address for public companies
69
110
Drinking water stations with no reported violations in the past
5
22
Drinking water stations with reported violations in the past
HMDA - Conventional home purchase loans - Applications denied
Year
Los Angeles
Chicago
1999
10,170
7,501
2000
9,527
8,763
2001
7,928
7,090
2002
9,092
7,745
2003
14,114
10,485
2004
18,901
14,761
2005
22,524
24,041
2006
26,600
29,365
2007
19,394
17,767
2008
7,924
8,601
2009
4,210
3,506
Culture and Food
Los Angeles is known for its multiculturalism, artistic scene, Hollywood's glitz and glam, and health-focused cuisine with influences from Mexican to Asian food. Chicago showcases a vibrant music scene, world-class museums, and a much-lauded food scene featuring diverse cuisines and its famous deep-dish pizza.
Sports Teams
Both cities are home to various sports teams and have dedicated fan bases. LA's teams include the Lakers (NBA), Dodgers (MLB), and Rams (NFL). Chicago is home to the Bulls (NBA), Cubs and White Sox (MLB), and Bears (NFL).


 Los Angeles, CA
 Chicago, IL