Long Beach and West Covina, located in sunny California, each present unique elements that make them appealing for both living and visiting. From the dynamic urban sprawl and coastal charm of Long Beach to the quieter, suburban appeal of West Covina, each has a distinctive lifestyle to offer. Your preferences for cost of living, education, weather, and culture may attract you to one over the other. The following comparison paints a nuanced picture of what to expect, whether you're looking at a brief visit or a permanent move.
Distance between
Long Beach, CA and
West Covina, CA : 22.2 miles
Long Beach's population is larger by 326%. Its population has decreased by 5,460 people (1.2%) since 2000. The population of West Covina has grown by 1,937 people (1.8%) during that time.
Long Beach, being a larger metropolitan city, has higher crime rates compared to West Covina. However, certain neighborhoods have lower crime rates, like Los Altos and Belmont Shore. Conversely, West Covina, being a suburban city, generally has lower crime rates and is considered safer compared to larger cities. There are, nonetheless, certain neighborhoods that are more desirable, so it's always recommended to research and visit beforehand.
City-data.com crime index counts serious crimes and violent crime more heavily. It adjusts for the number of visitors and daily workers commuting into cities. (higher means more crime, U.S. average = 301.1)
City-data.com crime index counts serious crimes and violent crime more heavily. It adjusts for the number of visitors and daily workers commuting into cities. (higher means more crime, U.S. average = 301.1)
Sex Offenders
According to our data, there are 829 registered sex offenders living in Long Beach and 104 registered sex offenders living in . The ratio of residents to sex offenders in Long Beach is 567 to 1; the ratio in West Covina is 1,037 to 1. The number of registered sex offenders compared to the number of residents is larger in Long Beach than in West Covina.
Cost of Living
Long Beach generally has a higher cost of living due to its coastal location and city amenities. Housing, in particular, is higher than the national average. On the other hand, West Covina is more affordable, although still above the national average, with housing being the biggest factor.
Income Tax
Both cities are subject to California's progressive income tax system, with the actual rate varying based on income level.
Property Tax
Property tax rates are similar between the two cities, adhering to California’s standard rate, though actual tax bills can differ based on real estate values.
Sales Tax
Both cities have the standard California state sales tax rate, with Long Beach's total rate at 10.25% and West Covina's total rate at 9.50%.
Income
Type
Long Beach
West Covina
Estimated median household income
$73,905
$88,476
Estimated per capita income
$37,217
$35,743
Cost of living index (U.S. average is 100)
142
137.1
If you make $50,000 in West Covina, you will have to make $51,787 in Long Beach to maintain the same standard of living.
Geographical Conditions
Long Beach is a coastal city, providing beautiful beach access, and harbor views. West Covina is inland, surrounded by hills on the east and with views of the San Gabriel Mountains.
Long Beach boasts a robust education system, with several high-ranking public schools and private institutions. The city is also home to California State University, Long Beach, a highly sought-after public university. West Covina also has a fair share of good public and private schools, and while it doesn't host a university within its city boundaries, there are several nearby, including the University of Southern California.
Long Beach has a diversified economy with sectors like healthcare, education, and port-related industries driving growth. West Covina's economy is based on retail and healthcare, with the Plaza West Covina and Queen of the Valley Hospital being the city's top employers.
Biggest Employers
In Long Beach, the largest employers are Long Beach Memorial Medical Center, the Long Beach Unified School District, and Boeing. West Covina's notable employers are the Plaza West Covina and Queen of the Valley Hospital.
There were 304 building permits issued in Long Beach in 2012 (238 more than in 2011) compared to 22 building permits issued in West Covina in 2012 (18 more than in 2011).
Weather
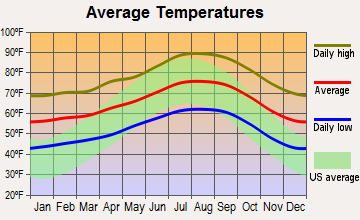
Both cities enjoy a Mediterranean climate, typical of Southern California. Long Beach enjoys warm summers and mild winters with cooler temperatures courtesy of its coastal location. West Covina, which is further inland, experiences a slight bit hotter summers and slightly colder winters, but the differences are minimal and both cities make for comfortable living year-round.
Weather and climate
Type
Long Beach
West Covina
Temperature - Average
65.3°F
65.4°F
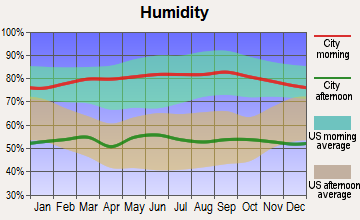
Humidity - Average morning or afternoon humidity
70.4%
64%
Humidity - Differences between morning and afternoon humidity
27%
19%
Humidity - Maximum monthly morning or afternoon humidity
79%
69.7%
Humidity - Minimum monthly morning or afternoon humidity
52%
50.7%
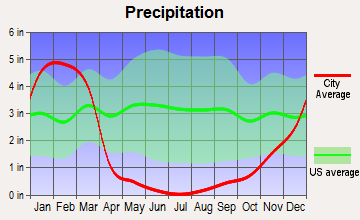
Precipitation - Yearly average
13.1 in
20.7 in
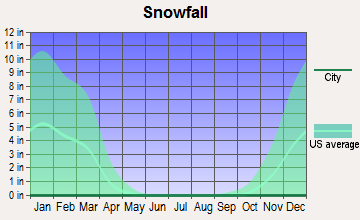
Snowfall - Yearly average
0 in
0 in
Clouds - Number of days clear of clouds
26.4%
28.4%
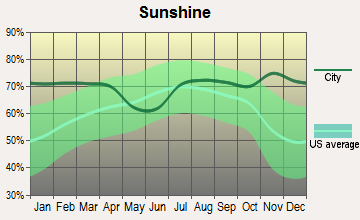
Sunshine amount - Average
78.4%
78.4%
Sunshine amount - Differences during a year
22%
22%
Sunshine amount - Maximum monthly
85%
85%
Sunshine amount - Minimum monthly
63%
63%
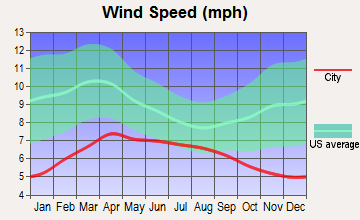
Wind speed - Average
6.1 mph
3.4 mph
Average climate in Long Beach, California
Average climate in West Covina, California
Air pollution
Type
AQI
CO
NO2
OZONE
PB
PM10
PM25
SO2
Year
Long Beach
West Covina
Long Beach
West Covina
Long Beach
West Covina
Long Beach
West Covina
Long Beach
West Covina
Long Beach
West Covina
Long Beach
West Covina
Long Beach
West Covina
2018
124
144
0.37
0.36
17.2
14.1
22.1
29.0
0.008
0.007
27.5
29.9
13.5
13.5
0.7
0.4
2017
122
151
0.36
0.36
18.1
14.9
23.2
30.2
0.007
0.007
26.7
32.8
14.5
13.2
0.8
0.5
2016
115
141
0.36
0.33
18.5
15.6
21.9
28.9
0.007
0.007
24.1
30.1
11.6
12.4
0.9
0.5
2015
111
146
0.38
0.32
19.9
15.2
22.5
29.6
0.005
0.007
25.0
29.9
13.9
14.8
0.9
0.4
2014
127
143
0.50
0.34
20.3
16.8
22.0
28.8
0.007
0.007
26.7
33.2
14.3
13.1
1.3
0.5
2013
126
148
0.48
0.36
20.0
17.1
24.7
27.1
0.005
0.007
32.3
31.3
14.6
12.7
1.0
0.5
2012
132
149
0.48
0.40
19.3
18.4
24.4
26.5
0.004
0.005
30.8
30.6
14.1
15.6
0.6
0.6
2011
119
149
0.43
0.42
20.2
18.5
23.4
25.9
0.006
0.008
28.4
30.1
15.6
17.4
1.2
0.6
2010
115
139
0.38
0.44
20.8
19.2
22.7
26.0
0.011
0.009
24.1
26.7
11.9
15.1
0.7
0.6
2009
132
156
0.50
0.40
21.0
20.6
22.0
27.0
0.008
0.010
27.7
27.6
13.1
16.6
1.1
0.6
2008
124
156
0.53
0.50
20.8
22.6
23.2
26.6
0.008
0.012
27.2
28.6
21.6
15.9
1.0
0.9
2007
109
135
0.60
0.51
20.3
24.8
21.1
24.2
0.010
0.015
N/A
N/A
N/A
N/A
1.4
1.2
2006
119
128
0.76
0.54
21.4
24.9
19.9
23.6
0.005
0.009
N/A
N/A
N/A
N/A
1.7
1.5
2005
108
128
0.74
0.57
24.3
25.6
20.5
22.0
0.011
0.014
N/A
N/A
N/A
N/A
2.7
1.8
2004
125
134
0.56
0.66
28.0
25.2
22.9
24.2
0.012
0.017
N/A
N/A
N/A
N/A
2.0
2.0
2003
130
139
0.83
0.79
28.1
30.0
22.4
23.8
0.032
0.024
N/A
N/A
N/A
N/A
1.1
1.5
2002
120
136
0.90
0.82
29.6
31.6
22.2
22.2
0.011
0.021
N/A
N/A
N/A
N/A
2.8
2.1
2001
124
143
0.81
0.98
30.3
32.2
21.5
20.6
0.011
0.028
N/A
N/A
N/A
N/A
3.3
1.9
2000
142
151
0.71
1.02
31.5
34.5
19.6
20.3
0.018
0.025
N/A
N/A
N/A
N/A
2.0
1.4
Natural disasters
Type
Long Beach
West Covina
Tornado activity compared to U.S. average
18.3%
18.6%
Earthquake activity compared to U.S. average
6,875.1%
7,258.6%
Natural disasters compared to U.S. average
57%
57%
Transportation
Long Beach has extensive public transport options including buses, light rail, and biking lanes, along with closer proximity to Los Angeles International Airport. West Covina primarily depends on freeways and personal vehicles, although some bus lines are available.
Transport
Type
Long Beach
West Covina
Amtrak stations
1
0
Amtrak stations nearby
3
3
FAA registered aircraft
312
24
FAA registered aircraft manufacturers and dealers
29
3
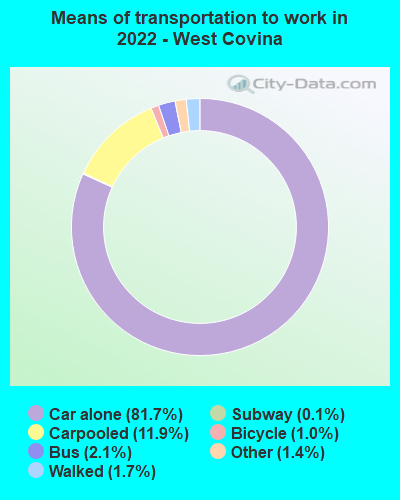
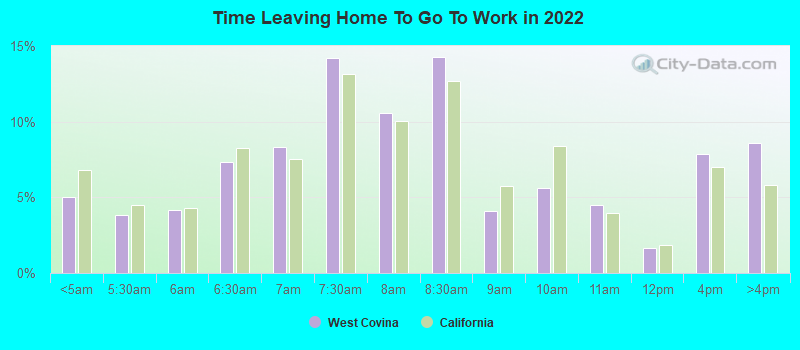
Means of transportation to work
Type
Long Beach
West Covina
Bicycle
0.5%
1%
Bus
3.3%
2.1%
Carpooled
9.8%
10.2%
Car alone
81.8%
83.6%
Motorcycle
0.2%
0.2%
Railroad
0%
0.8%
Streetcar
0.1%
0.2%
Subway
0.5%
0.1%
Walked
2.8%
1.6%
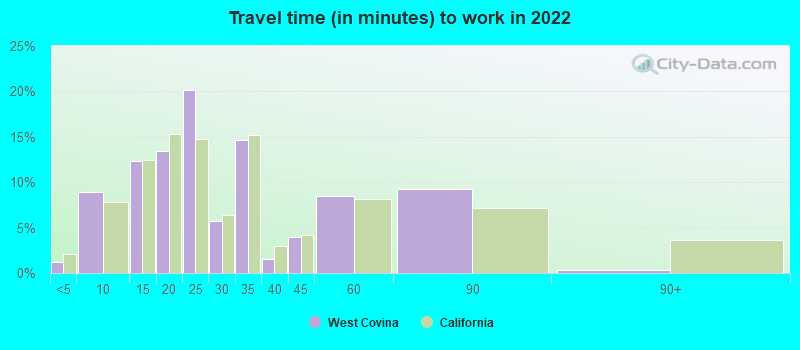
Average travel time to work
Type
Long Beach
West Covina
Average
30.7 min
27.6 min
Other means
28.5 min
33.7 min
Public transportation
46.4 min
55.1 min
Private vehicle occupancy
Type
Long Beach
West Covina
Average
1.1
1.2
Drove alone
89.7%
89.1%
In 2 person carpool
8.5%
7.6%
In 3 person carpool
1.4%
1.4%
In 4 person carpool
0.3%
0.8%
In 5-6 person carpool
0%
0.7%
In 7+ person carpool
0%
0.2%
How many people usually rode to work in the car, truck or van.
Real Estate
Real estate prices in Long Beach are higher in comparison to West Covina, largely driven by its coastal location. West Covina, while still more costly than the national average, is more affordable relative to Long Beach and much of Southern California.
Neighborhoods
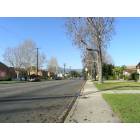
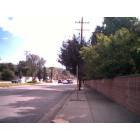
Long Beach has diverse neighborhoods, from the bustling Downtown to the serene Belmont Shore. West Covina features suburban, family-friendly neighborhoods, and the city is notably quieter compared to Long Beach.
Houses and residents
Type
Long Beach
West Covina
Houses
179,856
33,792
Average household size (people)
2.8
3.3
Median year apartment built
1964
1974
Median year house/condo built
1954
1960
Length of stay in the house since moving in
15.7 years
17.2 years
Houses occupied
172,599 (96%)
32,012 (94.7%)
Houses occupied by owners
69,470 (40.2%)
19,752 (61.7%)
Houses occupied by renters
103,129 (59.8%)
12,260 (38.3%)
Median rent asked for vacant for-rent units
$1,057
$1,233
Median monthly housing costs
$1,692
$1,974
Median price asked for vacant for-sale houses and condos
$520,992
$782,590
Estimated median house or condo value
$693,600
$636,300
Median numbers of rooms
4.2
5.4
Median number of rooms in apartments
3.6
4.2
Median number of rooms in houses and condos
5.5
6.1
Median house price - detached houses
$900,658
$771,573
Median house price - in 3-to-4-unit structures
$495,928
$544,131
Median house price - in 5 or more unit structures
$488,399
$367,562
Median house price - mobile homes
$333,777
$116,596
Median house price - Townhouses or other attached units
$634,684
$446,978
Median house price - All housing units
$805,766
$717,660
Median house age
62
52
Renting percentage
58.4%
34.5%
Housing density (houses/condos per square mile)
3,565.7
2,098.2
House value disparities
21.3%
15.7%
Household income disparities
44.7%
40.6%
Median household income for houses/condes with a mortgage
$116,421
$119,894
Median household income for apartments without a mortgage
$79,392
$75,036
Housing units without a mortgage
394 (0.8%)
195 (1.5%)
Housing units with both a second mortgage and home equity loan
3,069 (6.2%)
1,021 (7.7%)
Housing units with a mortgage
49,321 (99.2%)
13,115 (98.5%)
Housing units with a home equity loan
48 (0.1%)
131 (1%)
Housing units with a second mortgage
3,709 (7.5%)
1,496 (11.2%)
House/condo owner moved in on average (years ago)
15
18
House/condo renter moved in on average (years ago)
3
3
Housing units lacking complete kitchen facilities
2.6%
2.6%
Housing units in structures
Housing units in structures
Long Beach
West Covina
One, detached
40.2%
62.8%
One, attached
4.9%
9.0%
Two
5.3%
1.0%
3 or 4
8.8%
4.1%
5 to 9
10.4%
4.8%
10 to 19
10.8%
4.1%
20 to 49
8.0%
2.2%
50 or more
10.6%
11.0%
Mobile homes
0.8%
1.0%
Boats, RVs, vans, etc.
0.2%
0.0%
Median real estate property taxes paid for housing units
Self-employed workers in own not incorporated business
18,532
3,571
State government workers
6,550
1,385
Unpaid family workers
178
43
Industries and Occupations
Diverse industries dominate Long Beach, led by healthcare, education, and port-related jobs. West Covina, on the other hand, has a strong retail industry and healthcare sector.
Health diagnosing and treating practitioners and other technical occupations
4.9%
7.2%
Community and social service occupations
4.4%
2.7%
Personal care and service occupations
3.6%
3.6%
Arts, design, entertainment, sports, and media occupations
3.0%
4.4%
Building and grounds cleaning and maintenance occupations
2.9%
0.9%
Material moving occupations
2.8%
3.9%
Health technologists and technicians
2.8%
2.2%
Production occupations
2.7%
3.4%
Computer and mathematical occupations
1.9%
1.6%
Transportation occupations
1.4%
0.8%
Life, physical, and social science occupations
1.3%
0.0%
Legal occupations
1.3%
1.2%
Farming, fishing, and forestry occupations
0.4%
1.2%
Health Care
Long Beach has multiple top-notch medical centers, including Long Beach Memorial Medical Center. West Covina's Queen of the Valley Hospital is renowned in the San Gabriel Valley.
Long Beach has well-established infrastructure due to its urban nature, including ample public transportation, a significant port, and a busy airport. West Covina, being a suburban city, lacks such amenities but presents well-maintained roads and public facilities.
HMDA - Conventional home purchase loans - Applications denied
Year
Long Beach
West Covina
1999
1,159
237
2000
710
208
2001
677
193
2002
708
293
2003
1,861
401
2004
2,162
470
2005
3,065
545
2006
3,591
618
2007
2,287
419
2008
887
177
2009
475
80
Culture and Food
Long Beach has a vibrant arts scene and multicultural food options, owing to its diversity. West Covina offers a more suburban cultural scene but boasts strong Asian and Latino culinary influences.
Sports Teams
Long Beach doesn't homes any major league sports teams, but its proximity allows easy access to Los Angeles' teams. West Covina, while not hosting any pro sports, has a well-established youth and high school sports culture.


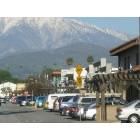
 Long Beach, CA
 West Covina, CA