Long Beach and Torrance are two vibrant cities located in Southern California. While they share similar climates and rich cultures, they differ significantly in other areas, including crime rates, cost of living, education, economy, and public transportation. Long Beach offers a diverse, beachside vibe with a larger population, more urban atmosphere, and slightly higher crime rates, while Torrance is generally safer, suburban, and has a somewhat higher cost of living. This evaluation will provide distinctive highlights of both cities, helping those looking to relocate or visit make a detailed and informed comparison.
Distance between
Long Beach, CA and
Torrance, CA : 10.7 miles
Long Beach's population is larger by 218%. Its population has decreased by 5,460 people (1.2%) since 2000. The population of Torrance has grown by 5,654 people (4.1%) during that time.
When it comes to safety, Torrance is generally safer compared to Long Beach. According to NeighborhoodScout, Torrance's crime rate is significantly lower than the national average, providing residents with a more secure living environment. Conversely, Long Beach, having a more urban environment, has a higher crime rate. However, certain neighborhoods in Long Beach like Belmont Shore and Park Estates are considered safer. Safety is an important concern for residents and tourists, and it's always advised to stay informed about the current situation regardless of the city.
City-data.com crime index counts serious crimes and violent crime more heavily. It adjusts for the number of visitors and daily workers commuting into cities. (higher means more crime, U.S. average = 301.1)
City-data.com crime index counts serious crimes and violent crime more heavily. It adjusts for the number of visitors and daily workers commuting into cities. (higher means more crime, U.S. average = 301.1)
Sex Offenders
According to our data, there are 834 registered sex offenders living in Long Beach and 126 registered sex offenders living in . The ratio of residents to sex offenders in Long Beach is 564 to 1; the ratio in Torrance is 1,168 to 1. The number of registered sex offenders compared to the number of residents is larger in Long Beach than in Torrance.
Cost of Living
Generally speaking, the cost of living in Torrance is higher than Long Beach. Expenses like housing, healthcare, and groceries tend to cost more in Torrance. Conversely, Long Beach's overall cost of living is relatively lower, though still higher than the national average, as is typical of many California cities. Prospective residents should consider this aspect according to their financial capabilities and lifestyle preferences.
Income Tax
California maintains a progressive income tax, meaning the rate of tax increases as income does. This applies equally to both cities. The current state tax ranges from 1% to 13.3% depending on income levels. For high earners, California has one of the highest tax rates in the nation.
Property Tax
Again, the property tax is governed at the state level in California, and it remains the same for both Torrance and Long Beach. The average effective property tax rate in California is relatively low at 0.73%, which could be a benefit for potential homeowners in both cities.
Sales Tax
The total sales tax rates for both Long Beach and Torrance are identical, currently standing at 10.25%, which is higher than the national average. This is divided between the California state tax, county tax, and a city tax. The high sales tax is a common feature of California cities and is something both residents and visitors should be aware of.
Income
Type
Long Beach
Torrance
Estimated median household income
$73,905
$100,392
Estimated per capita income
$37,217
$52,528
Cost of living index (U.S. average is 100)
142
142.7
If you make $50,000 in Long Beach, you will have to make $50,246 in Torrance to maintain the same standard of living.
Geographical Conditions
Both cities share similar geographical conditions, featuring a blend of suburban and urban landscapes, and beautiful coastal areas. Long Beach's shoreline offers sandy beaches and a bustling harbor. Torrance charms with its quieter beach experience, complete with a lush bird watching area at Madrona Marsh Preserve.
Both cities boast strong education systems. Long Beach Unified School District is one of the top urban school districts in the country. Long Beach also houses a number of universities, including California State University, Long Beach. In Torrance, the Torrance Unified School District has a great reputation, and El Camino College provides excellent higher education opportunities. Educational facilities here are also renowned.
Both Long Beach and Torrance have robust and diverse economies. Long Beach has a booming economy with sectors like healthcare, education, and port-related industries being major employers. Torrance, on the other hand, thrives in manufacturing, retail, and healthcare. Unemployment rates in both cities are relatively low, and both offer a wide range of job opportunities.
Biggest Employers
The biggest employers in Long Beach include Boeing, the Long Beach Memorial Medical Center, and the Long Beach Unified School District. In contrast, Torrance's largest employers feature Honda, Honeywell, and Providence Little Company of Mary Medical Center. Both cities offer strong employment opportunities.
There were 304 building permits issued in Long Beach in 2012 (238 more than in 2011) compared to 40 building permits issued in Torrance in 2012 (32 more than in 2011).
Weather
Both cities enjoy a Mediterranean climate with warm summers and mild winters, making them highly desirable locations for those who prefer consistent, moderate weather. Long Beach, located on the Pacific Coast, has consistent ocean breezes which might make it a tad cooler than Torrance. Torrance is also coastal but some distance inland which results in slightly warmer summers. Overall, both cities offer excellent weather conditions almost year-round, suitable for outdoor activities.
Weather and climate
Type
Long Beach
Torrance
Temperature - Average
65.3°F
63°F
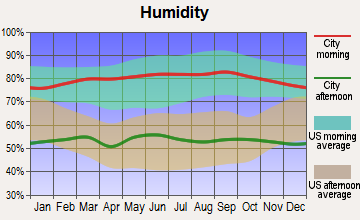
Humidity - Average morning or afternoon humidity
70.4%
68.6%
Humidity - Differences between morning and afternoon humidity
27%
24.4%
Humidity - Maximum monthly morning or afternoon humidity
79%
76.4%
Humidity - Minimum monthly morning or afternoon humidity
52%
52%
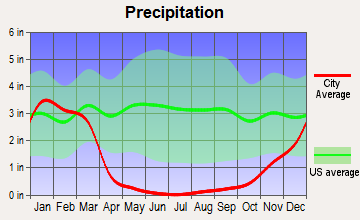
Precipitation - Yearly average
13.1 in
14.3 in
Snowfall - Yearly average
0 in
0 in
Clouds - Number of days clear of clouds
26.4%
26%
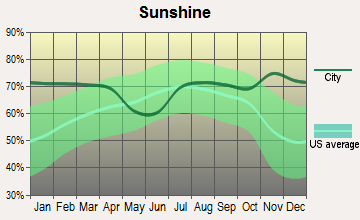
Sunshine amount - Average
78.4%
78.4%
Sunshine amount - Differences during a year
22%
22%
Sunshine amount - Maximum monthly
85%
85%
Sunshine amount - Minimum monthly
63%
63%
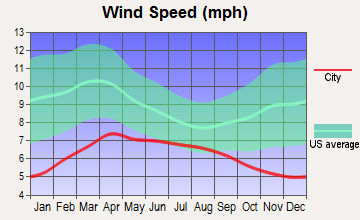
Wind speed - Average
6.1 mph
5.3 mph
Average climate in Long Beach, California
Average climate in Torrance, California
Air pollution
Type
AQI
CO
NO2
OZONE
PB
PM10
PM25
SO2
Year
Long Beach
Torrance
Long Beach
Torrance
Long Beach
Torrance
Long Beach
Torrance
Long Beach
Torrance
Long Beach
Torrance
Long Beach
Torrance
Long Beach
Torrance
2018
124
124
0.37
0.38
17.2
14.5
22.1
25.2
0.008
0.008
27.5
27.5
13.5
13.9
0.7
0.6
2017
122
122
0.36
0.40
18.1
15.6
23.2
25.7
0.007
0.007
26.7
26.7
14.5
14.7
0.8
0.7
2016
115
115
0.36
0.41
18.5
15.2
21.9
25.4
0.007
0.007
24.1
24.1
11.6
12.6
0.9
0.7
2015
111
111
0.38
0.40
19.9
16.2
22.5
26.0
0.005
0.005
25.0
25.0
13.9
14.8
0.9
0.7
2014
127
128
0.50
0.46
20.3
16.3
22.0
25.5
0.007
0.007
26.7
26.5
14.3
15.8
1.3
0.8
2013
126
127
0.48
0.48
20.0
17.3
24.7
25.7
0.005
0.005
32.3
30.4
14.6
15.2
1.0
0.7
2012
132
132
0.48
0.47
19.3
17.0
24.4
25.4
0.004
0.005
30.8
29.7
14.1
15.2
0.6
0.6
2011
119
124
0.43
0.41
20.2
18.3
23.4
24.1
0.006
0.007
28.4
28.6
15.6
16.1
1.2
0.8
2010
115
117
0.38
0.46
20.8
18.5
22.7
22.8
0.011
0.014
24.1
25.5
11.9
13.6
0.7
0.6
2009
132
136
0.50
0.50
21.0
19.8
22.0
23.9
0.008
0.009
27.7
33.3
13.1
15.0
1.1
1.3
2008
124
129
0.53
0.48
20.8
21.7
23.2
23.2
0.008
0.009
27.2
30.8
21.6
21.3
1.0
1.2
2007
109
111
0.60
0.48
20.3
21.4
21.1
23.2
0.010
0.012
N/A
N/A
N/A
N/A
1.4
2.2
2006
119
120
0.76
0.52
21.4
22.1
19.9
23.7
0.005
0.006
N/A
N/A
N/A
N/A
1.7
1.8
2005
108
111
0.74
0.53
24.3
22.6
20.5
23.1
0.011
0.012
N/A
N/A
N/A
N/A
2.7
4.3
2004
125
128
0.56
0.58
28.0
25.3
22.9
25.5
0.012
0.013
N/A
N/A
N/A
N/A
2.0
2.4
2003
130
131
0.83
0.80
28.1
26.8
22.4
21.5
0.032
0.025
N/A
N/A
N/A
N/A
1.1
0.8
2002
120
123
0.90
0.83
29.6
27.8
22.2
22.6
0.011
0.017
N/A
N/A
N/A
N/A
2.8
2.1
2001
124
126
0.81
0.83
30.3
29.1
21.5
21.5
0.011
0.031
N/A
N/A
N/A
N/A
3.3
3.7
2000
142
140
0.71
0.87
31.5
30.9
19.6
19.7
0.018
0.030
N/A
N/A
N/A
N/A
2.0
2.3
Natural disasters
Type
Long Beach
Torrance
Tornado activity compared to U.S. average
18.3%
17%
Earthquake activity compared to U.S. average
6,875.1%
6,816.1%
Natural disasters compared to U.S. average
57%
57%
Transportation
Long Beach offers a more comprehensive public transportation system, including bus lines and a light rail metro line connecting to Los Angeles. Torrance also provides bus services, but it's less extensive. Commuting is quite standard for Southern California, and freeway access from both cities to other parts of Los Angeles is relatively easy, although traffic can be heavy during peak hours.
Transport
Type
Long Beach
Torrance
Amtrak stations
1
0
Amtrak stations nearby
3
3
FAA registered aircraft
312
284
FAA registered aircraft manufacturers and dealers
29
17
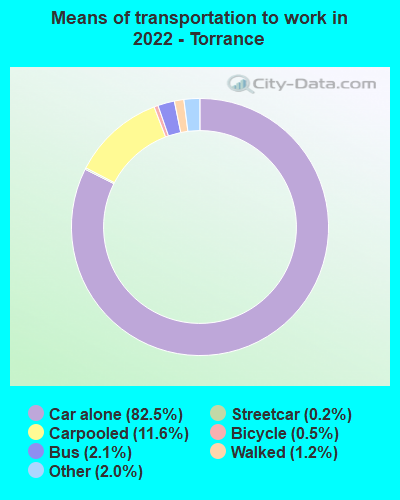
Means of transportation to work
Type
Long Beach
Torrance
Bicycle
0.5%
1.1%
Bus
3.3%
1.2%
Carpooled
9.8%
8.8%
Car alone
81.8%
85.2%
Motorcycle
0.2%
0.3%
Subway
0.5%
0%
Walked
2.8%
0.9%
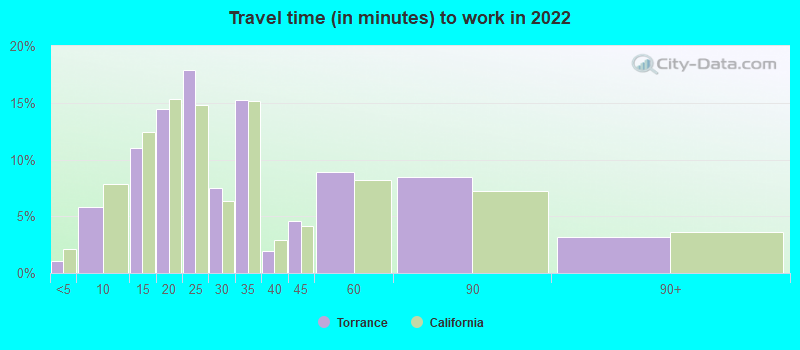
Average travel time to work
Type
Long Beach
Torrance
Average
30.7 min
29.5 min
Other means
28.5 min
26.5 min
Public transportation
46.4 min
45.2 min
Private vehicle occupancy
Type
Long Beach
Torrance
Average
1.1
1.1
Drove alone
89.7%
92.3%
In 2 person carpool
8.5%
5.2%
In 3 person carpool
1.4%
1.7%
In 4 person carpool
0.3%
0.1%
In 5-6 person carpool
0%
0.3%
In 7+ person carpool
0%
0.1%
How many people usually rode to work in the car, truck or van.
Real Estate
Real estate prices in Torrance tend to be higher than in Long Beach, reflecting the city's higher overall cost of living. Single-family homes in Torrance are particularly sought after. Meanwhile, Long Beach offers a varied real estate market, with options ranging from beachside properties to more affordable homes further from the centre.
Neighborhoods
Long Beach is known for its diverse neighborhoods, each with its own character, from the vibrant Downtown district to the upscale Naples and Belmont Shore. Torrance is often lauded for its family-friendly neighborhoods such as Southwood and West Torrance, known for their safety, quality schools, and sense of community. Both cities offer a variety of neighborhoods to suit different lifestyle preferences.
Houses and residents
Type
Long Beach
Torrance
Houses
179,856
60,220
Average household size (people)
2.8
2.6
Median year apartment built
1964
1968
Median year house/condo built
1954
1959
Length of stay in the house since moving in
15.7 years
17 years
Houses occupied
172,599 (96%)
57,584 (95.6%)
Houses occupied by owners
69,470 (40.2%)
32,109 (55.8%)
Houses occupied by renters
103,129 (59.8%)
25,475 (44.2%)
Median rent asked for vacant for-rent units
$1,057
$1,147
Median monthly housing costs
$1,692
$1,990
Median price asked for vacant for-sale houses and condos
$520,992
$1,098,324
Estimated median house or condo value
$693,600
$930,500
Median numbers of rooms
4.2
4.9
Median number of rooms in apartments
3.6
3.6
Median number of rooms in houses and condos
5.5
5.9
Median house price - detached houses
$900,658
Over $1,000,000
Median house price - in 2-unit structures
$823,515
$620,903
Median house price - in 3-to-4-unit structures
$495,928
$574,433
Median house price - in 5 or more unit structures
$488,399
$572,030
Median house price - mobile homes
$333,777
$199,102
Median house price - Townhouses or other attached units
$634,684
$736,305
Median house price - All housing units
$805,766
Over $1,000,000
Median house age
62
57
Renting percentage
58.4%
43.5%
Housing density (houses/condos per square mile)
3,565.7
2,931.7
House value disparities
21.3%
18.1%
Household income disparities
44.7%
40.9%
Median household income for houses/condes with a mortgage
$116,421
$132,732
Median household income for apartments without a mortgage
$79,392
$102,799
Housing units without a mortgage
394 (0.8%)
332 (1.6%)
Housing units with both a second mortgage and home equity loan
3,069 (6.2%)
1,364 (6.5%)
Housing units with a mortgage
49,321 (99.2%)
20,690 (98.4%)
Housing units with a home equity loan
48 (0.1%)
44 (0.2%)
Housing units with a second mortgage
3,709 (7.5%)
1,820 (8.7%)
House/condo owner moved in on average (years ago)
15
18
House/condo renter moved in on average (years ago)
3
3
Housing units lacking complete kitchen facilities
2.6%
2.2%
Housing units lacking complete plumbing facilities
0.4%
0.4%
Housing units in structures
Housing units in structures
Long Beach
Torrance
One, detached
40.2%
52.5%
One, attached
4.9%
7.4%
Two
5.3%
1.6%
3 or 4
8.8%
5.0%
5 to 9
10.4%
4.3%
10 to 19
10.8%
4.8%
20 to 49
8.0%
10.1%
50 or more
10.6%
12.3%
Mobile homes
0.8%
1.9%
Boats, RVs, vans, etc.
0.2%
0.0%
Median real estate property taxes paid for housing units
Self-employed workers in own not incorporated business
18,532
5,274
State government workers
6,550
1,875
Unpaid family workers
178
270
Industries and Occupations
In Long Beach, the leading industries include healthcare, shipping, and education. As for Torrance, manufacturing and retail dominate, with companies such as Northrop Grumman and Toyota having a strong presence. These established industries provide numerous employment opportunities for residents in a wide range of occupations.
Health diagnosing and treating practitioners and other technical occupations
4.9%
9.5%
Community and social service occupations
4.4%
0.5%
Personal care and service occupations
3.6%
3.2%
Arts, design, entertainment, sports, and media occupations
3.0%
3.2%
Building and grounds cleaning and maintenance occupations
2.9%
0.9%
Health technologists and technicians
2.8%
1.9%
Material moving occupations
2.8%
2.6%
Production occupations
2.7%
1.7%
Computer and mathematical occupations
1.9%
4.0%
Transportation occupations
1.4%
0.2%
Life, physical, and social science occupations
1.3%
0.7%
Legal occupations
1.3%
2.0%
Architecture and engineering occupations
1.0%
1.7%
Health Care
Both Long Beach and Torrance have excellent healthcare facilities. Long Beach is home to Long Beach Memorial Medical Center, one of the region's largest hospitals. Torrance houses the top-rated Torrance Memorial Medical Center and the Little Company of Mary Medical Center. Both cities provide an array of quality medical services, ensuring residents have access to quality healthcare.
Long Beach, as a larger city, benefits from a wider infrastructure base. The city houses a range of public facilities including parks, libraries, and museums, along with the famous Long Beach Port - one of the busiest container ports in the world. Torrance, while smaller, does manage to provide a well-structured and maintained city infrastructure, including plenty of parks, a regional shopping mall, and quality health-care facilities.
HMDA - Conventional home purchase loans - Applications denied
Year
Long Beach
Torrance
1999
1,159
320
2000
710
329
2001
677
244
2002
708
266
2003
1,861
297
2004
2,162
343
2005
3,065
465
2006
3,591
493
2007
2,287
374
2008
887
194
2009
475
136
Culture and Food
Long Beach is lauded for its vibrant multicultural atmosphere, influencing its diverse food scene, art galleries, music, and nightlife. Torrance, with its large Asian-American community, offers an excellent array of Asian cuisine and Japanese markets. Both cities host a number of cultural festivals throughout the year, adding to their cultural appeal.
Sports Teams
Long Beach does not host any major league sports teams, but it's a sport-oriented city offering numerous public golf courses, a convention center that holds sports events, and it's only a short drive from the major sports venues of Los Angeles. Torrance is home to the Los Angeles Galaxy soccer team's training grounds, but like Long Beach, primary professional sports viewing would involve a short drive to Los Angeles.


 Long Beach, CA
 Torrance, CA