Long Beach and Thousand Oaks are two cities in California with distinct characteristics that appeal differently to people considering relocation as well as tourists. Their different demographics, geographical features, work opportunities, and cultural offerings make each unique. The following sections will lay side by side the primary factors to consider from safety to culture, from economy to healthcare.
Distance between
Long Beach, CA and
Thousand Oaks, CA : 48.9 miles
Long Beach's population is larger by 263%. Its population has decreased by 5,460 people (1.2%) since 2000. The population of Thousand Oaks has grown by 8,749 people (7.5%) during that time.
Thousand Oaks has a significantly lower crime rate than Long Beach. Thousand Oaks consistently ranks as one of the safest cities in the US, with crime rates well below the national average. On the other hand, Long Beach has a higher crime rate than the national average, but local government efforts to improve safety have seen a gradual decline in crime rates.
City-data.com crime index counts serious crimes and violent crime more heavily. It adjusts for the number of visitors and daily workers commuting into cities. (higher means more crime, U.S. average = 301.1)
City-data.com crime index counts serious crimes and violent crime more heavily. It adjusts for the number of visitors and daily workers commuting into cities. (higher means more crime, U.S. average = 301.1)
Sex Offenders
According to our data, there are 834 registered sex offenders living in Long Beach and 41 registered sex offenders living in . The ratio of residents to sex offenders in Long Beach is 564 to 1; the ratio in Thousand Oaks is 3,144 to 1. The number of registered sex offenders compared to the number of residents is much larger in Long Beach than that in Thousand Oaks.
Cost of Living
The cost of living in Thousand Oaks is generally higher than in Long Beach. This is particularly influenced by the housing and property costs. However, groceries, utilities, and transportation costs are more expensive in Long Beach.
Income Tax
California has a high state income tax that is the same for residents of both cities. It's also noteworthy that there is no city specific income tax.
Property Tax
Both cities have similar property tax rates, which are slightly lower than the national average. However, properties in Thousand Oaks are generally more expensive, and thus homeowners there may end up paying more in property taxes.
Sales Tax
Both cities have higher sales tax rates than the national average due to California state tax regulations, but Thousand Oaks has a slightly lower city sales tax rate than Long Beach.
Income
Type
Long Beach
Thousand Oaks
Estimated median household income
$73,905
$114,791
Estimated per capita income
$37,217
$58,424
Cost of living index (U.S. average is 100)
142
94
If you make $50,000 in Thousand Oaks, you will have to make $75,532 in Long Beach to maintain the same standard of living.
Geographical Conditions
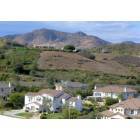
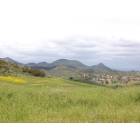
Long Beach, being a coastal city, offers beach access and water-related activities. Thousand Oaks, located inland, offers beautiful rolling hills and is around an hour's drive from the coast. Both cities provide beautiful natural areas for outdoor activities.
Both cities boast of quality education. However, Thousand Oaks has a higher percentage of residents with a bachelor's degree or higher. It is also home to California Lutheran University. In Long Beach, California State University, Long Beach offers a wide variety of programs.
Long Beach has a more diverse economy featuring healthcare, manufacturing, and shipping industries. In contrast, Thousand Oaks has a more concentrated economy, heavily reliant on biotechnology and electronics industries.
Biggest Employers
In Thousand Oaks, biotech company Amgen is the city's top employer. In contrast, Long Beach's biggest employer is Long Beach Unified School District, followed by companies in the healthcare sector and the City of Long Beach.
There were 304 building permits issued in Long Beach in 2012 (238 more than in 2011) compared to 16 building permits issued in Thousand Oaks in 2012 (2 less than in 2011).
In Long Beach (Los Angeles County), 69.7% voted for Democrats and 27.8% for Republicans in 2012 Presidential Election. In Thousand Oaks (Ventura County), 52.2% voted for Democrats and 45.2% for Republicans.
Elections
Type
Democrats
Republicans
Other
Year
Long Beach
Thousand Oaks
Long Beach
Thousand Oaks
Long Beach
Thousand Oaks
2020
71.0%
59.6%
26.9%
38.5%
2.1%
1.9%
2016
72.0%
54.6%
22.5%
37.2%
5.5%
8.2%
2012
69.7%
52.2%
27.8%
45.2%
2.4%
2.7%
2008
69.2%
55.2%
28.8%
42.9%
1.9%
1.9%
2004
63.3%
47.8%
35.7%
51.5%
1.0%
0.8%
2000
63.6%
47.2%
32.4%
48.3%
4.0%
4.5%
1996
59.3%
44.1%
31.0%
43.5%
9.7%
12.4%
Breakdown of population affiliated with a religious congregation
Type
Adherents
Congregations
Religion
Long Beach
Thousand Oaks
Long Beach
Thousand Oaks
CATHOLIC CHURCH
36.1%
28.2%
4.7%
4.1%
SOUTHERN BAPTIST CONVENTION
1.0%
0.6%
9.0%
5.0%
MUSLIM ESTIMATE
0.7%
0.4%
1.0%
0.6%
AMERICAN BAPTIST CHURCHES IN THE USA
0.5%
0.1%
3.1%
0.4%
SEVENTH DAY ADVENTIST CHURCH
0.5%
0.4%
2.4%
2.1%
EPISCOPAL CHURCH
0.4%
0.3%
1.4%
1.9%
EVANGELICAL LUTHERAN CHURCH IN AMERICA
0.2%
0.9%
1.9%
2.3%
LUTHERAN CHURCH
0.2%
0.5%
1.6%
2.5%
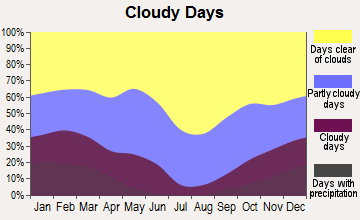
Weather
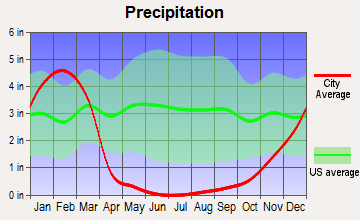
Both cities enjoy the typical Californian climate, but being closer to the coast, Long Beach experiences milder, more moderate temperatures throughout the year with cooler summers and warmer winters. Thousand Oaks, sitting inland, has slightly hotter summers and colder winters compared to Long Beach.
Weather and climate
Type
Long Beach
Thousand Oaks
Temperature - Average
65.3°F
62.5°F
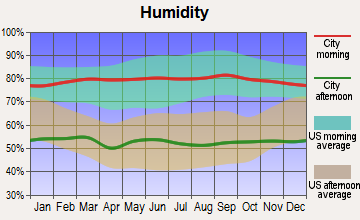
Humidity - Average morning or afternoon humidity
70.4%
64.3%
Humidity - Differences between morning and afternoon humidity
27%
18.9%
Humidity - Maximum monthly morning or afternoon humidity
79%
69.9%
Humidity - Minimum monthly morning or afternoon humidity
52%
51%
Precipitation - Yearly average
13.1 in
18.2 in
Snowfall - Yearly average
0 in
0 in
Clouds - Number of days clear of clouds
26.4%
27.1%
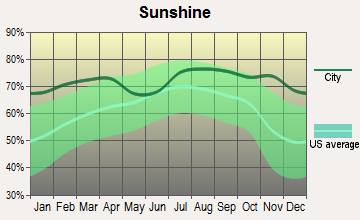
Sunshine amount - Average
78.4%
78.4%
Sunshine amount - Differences during a year
22%
22%
Sunshine amount - Maximum monthly
85%
85%
Sunshine amount - Minimum monthly
63%
63%
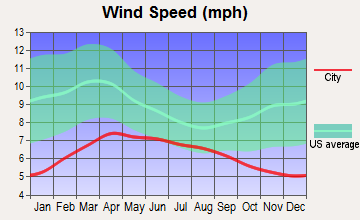
Wind speed - Average
6.1 mph
3.2 mph
Average climate in Long Beach, California
Average climate in Thousand Oaks, California
Air pollution
Type
AQI
CO
NO2
OZONE
PB
PM10
PM25
SO2
Year
Long Beach
Thousand Oaks
Long Beach
Thousand Oaks
Long Beach
Thousand Oaks
Long Beach
Thousand Oaks
Long Beach
Thousand Oaks
Long Beach
Thousand Oaks
Long Beach
Thousand Oaks
Long Beach
2018
124
130
0.37
0.27
17.2
8.7
22.1
30.5
0.008
0.002
27.5
25.4
13.5
9.3
0.7
N/A
2017
122
134
0.36
0.36
18.1
8.7
23.2
32.8
0.007
0.002
26.7
26.6
14.5
9.0
0.8
N/A
2016
115
117
0.36
0.40
18.5
8.6
21.9
31.1
0.007
0.002
24.1
24.1
11.6
9.6
0.9
N/A
2015
111
124
0.38
0.43
19.9
9.5
22.5
31.1
0.005
0.001
25.0
23.2
13.9
8.8
0.9
N/A
2014
127
130
0.50
0.38
20.3
9.3
22.0
30.2
0.007
0.003
26.7
25.9
14.3
9.4
1.3
N/A
2013
126
129
0.48
0.38
20.0
10.2
24.7
30.0
0.005
0.002
32.3
25.6
14.6
9.4
1.0
N/A
2012
132
127
0.48
0.34
19.3
10.6
24.4
29.9
0.004
0.002
30.8
26.5
14.1
9.6
0.6
N/A
2011
119
128
0.43
0.37
20.2
11.2
23.4
34.5
0.006
0.004
28.4
N/A
15.6
16.3
1.2
N/A
2010
115
123
0.38
0.33
20.8
11.6
22.7
33.6
0.011
0.003
24.1
N/A
11.9
14.4
0.7
N/A
2009
132
141
0.50
0.37
21.0
12.4
22.0
30.9
0.008
0.004
27.7
N/A
13.1
14.4
1.1
N/A
2008
124
131
0.53
0.41
20.8
13.2
23.2
32.2
0.008
N/A
27.2
N/A
21.6
N/A
1.0
N/A
2007
109
113
0.60
0.44
20.3
14.5
21.1
30.8
0.010
0.005
N/A
N/A
N/A
N/A
1.4
N/A
2006
119
115
0.76
0.42
21.4
14.2
19.9
30.0
0.005
N/A
N/A
N/A
N/A
N/A
1.7
N/A
2005
108
124
0.74
0.51
24.3
15.4
20.5
29.9
0.011
N/A
N/A
N/A
N/A
N/A
2.7
N/A
2004
125
132
0.56
0.55
28.0
14.4
22.9
31.0
0.012
N/A
N/A
N/A
N/A
N/A
2.0
N/A
2003
130
136
0.83
0.51
28.1
14.4
22.4
30.5
0.032
N/A
N/A
N/A
N/A
N/A
1.1
N/A
2002
120
141
0.90
0.51
29.6
14.5
22.2
30.2
0.011
0.006
N/A
N/A
N/A
N/A
2.8
N/A
2001
124
124
0.81
0.55
30.3
15.0
21.5
29.1
0.011
0.009
N/A
N/A
N/A
N/A
3.3
N/A
2000
142
123
0.71
0.63
31.5
16.4
19.6
27.0
0.018
0.004
N/A
N/A
N/A
N/A
2.0
N/A
Natural disasters
Type
Long Beach
Thousand Oaks
Tornado activity compared to U.S. average
18.3%
10.3%
Earthquake activity compared to U.S. average
6,875.1%
6,914.8%
Natural disasters compared to U.S. average
57%
36%
Transportation
Long Beach offers more public transportation options, including bus lines and a light rail system. Additionally, its port and airport provide international connectivity. Thousand Oaks, although smaller, has good road connections and is served by a bus system.
Transport
Type
Long Beach
Thousand Oaks
Amtrak stations
1
0
Amtrak stations nearby
3
3
FAA registered aircraft
312
97
FAA registered aircraft manufacturers and dealers
29
3
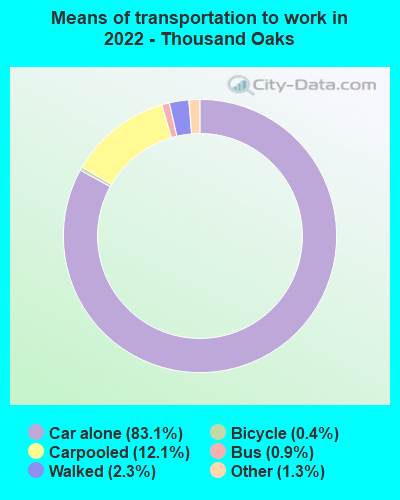
Means of transportation to work
Type
Long Beach
Thousand Oaks
Bicycle
0.5%
0.3%
Bus
3.3%
0.2%
Carpooled
9.8%
8.8%
Car alone
81.8%
88%
Motorcycle
0.2%
0.2%
Railroad
0%
0.2%
Subway
0.5%
0.1%
Taxicab
0%
0.1%
Walked
2.8%
1.4%
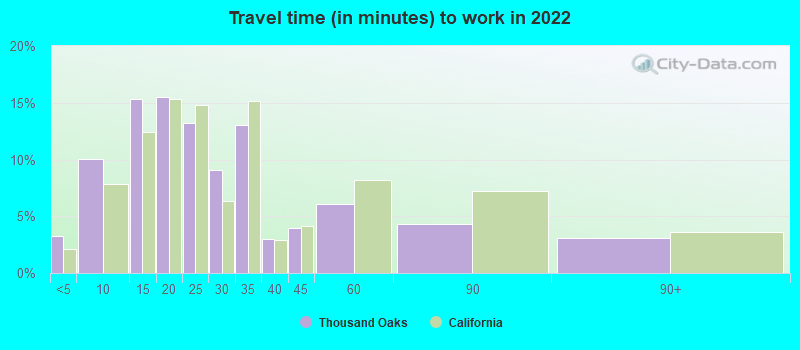
Average travel time to work
Type
Long Beach
Thousand Oaks
Average
30.7 min
26.2 min
Other means
28.5 min
27.7 min
Public transportation
46.4 min
48.9 min
Private vehicle occupancy
Type
Long Beach
Thousand Oaks
Average
1.1
1.1
Drove alone
89.7%
91.4%
In 2 person carpool
8.5%
6.8%
In 3 person carpool
1.4%
1.1%
In 4 person carpool
0.3%
0.2%
In 5-6 person carpool
0%
0.2%
How many people usually rode to work in the car, truck or van.
Real Estate
Home prices in Thousand Oaks are generally higher, reflecting its high-income residents and less dense population. Long Beach's real estate market is more accessible, but still higher than the national average due to the city's desirable coastal location and greater population density.
Neighborhoods
Long Beach is known for its varied and diverse neighborhoods, from the upscale Naples to the artsy East Village. Conversely, Thousand Oaks is more suburban, featuring neighborhoods that emphasize safety and strong community bonds.
Houses and residents
Type
Long Beach
Thousand Oaks
Houses
179,856
46,350
Average household size (people)
2.8
2.7
Median year apartment built
1964
1977
Median year house/condo built
1954
1976
Length of stay in the house since moving in
15.7 years
15.1 years
Houses occupied
172,599 (96%)
45,081 (97.3%)
Houses occupied by owners
69,470 (40.2%)
31,902 (70.8%)
Houses occupied by renters
103,129 (59.8%)
13,179 (29.2%)
Median rent asked for vacant for-rent units
$1,057
$2,617
Median monthly housing costs
$1,692
$2,362
Median price asked for vacant for-sale houses and condos
$520,992
$573,075
Estimated median house or condo value
$693,600
$858,200
Median numbers of rooms
4.2
6.1
Median number of rooms in apartments
3.6
4.3
Median number of rooms in houses and condos
5.5
6.8
Median house price - detached houses
$900,658
Over $1,000,000
Median house price - in 2-unit structures
$823,515
$344,165
Median house price - in 3-to-4-unit structures
$495,928
$472,452
Median house price - in 5 or more unit structures
$488,399
$256,813
Median house price - mobile homes
$333,777
$282,116
Median house price - Townhouses or other attached units
$634,684
$598,171
Median house price - All housing units
$805,766
$980,356
Median house age
62
45
Renting percentage
58.4%
26.9%
Housing density (houses/condos per square mile)
3,565.7
844.9
House value disparities
21.3%
20.6%
Household income disparities
44.7%
39.2%
Median household income for houses/condes with a mortgage
$116,421
$168,595
Median household income for apartments without a mortgage
$79,392
$88,679
Housing units without a mortgage
394 (0.8%)
359 (1.6%)
Housing units with both a second mortgage and home equity loan
3,069 (6.2%)
2,200 (9.7%)
Housing units with a mortgage
49,321 (99.2%)
22,263 (98.4%)
Housing units with a home equity loan
48 (0.1%)
73 (0.3%)
Housing units with a second mortgage
3,709 (7.5%)
2,480 (11%)
House/condo owner moved in on average (years ago)
15
15
House/condo renter moved in on average (years ago)
3
4
Housing units lacking complete kitchen facilities
2.6%
1.3%
Housing units lacking complete plumbing facilities
0.4%
0.4%
Housing units in structures
Housing units in structures
Long Beach
Thousand Oaks
One, detached
40.2%
69.5%
One, attached
4.9%
10.4%
Two
5.3%
0.1%
3 or 4
8.8%
3.6%
5 to 9
10.4%
3.6%
10 to 19
10.8%
2.8%
20 to 49
8.0%
3.6%
50 or more
10.6%
4.4%
Mobile homes
0.8%
2.0%
Boats, RVs, vans, etc.
0.2%
0.2%
Median real estate property taxes paid for housing units
Self-employed workers in own not incorporated business
18,532
5,703
State government workers
6,550
998
Unpaid family workers
178
31
Industries and Occupations
Thousand Oaks is home to several high-tech and biotech companies, and the occupations are high-income in nature. However, Long Beach provides more opportunities in a variety of sectors such as healthcare, education, and port-related jobs due to its more diverse economy.
Both cities offer high-quality healthcare facilities. Long Beach has more hospitals, including the Long Beach Memorial Medical Center. Thousand Oaks has fewer but top-rated facilities like Los Robles Regional Medical Center and Adventist Health Simi Valley.
Long Beach, being a larger city, has more developed infrastructure, including a busy port and an airport. On contrast, Thousand Oaks, though smaller, maintains well-designed roads and has easy access to two nearby airports, and maintains its smaller town charm.
Infrastructure
Type
Long Beach
Thousand Oaks
Hospitals
17
3
TV stations
5
4
Bank branches located here
67
24
Bank institutions located here
18
13
Main business address for public companies
11
2
Drinking water stations with no reported violations in the past
2
2
Drinking water stations with reported violations in the past
HMDA - Conventional home purchase loans - Applications denied
Year
Long Beach
Thousand Oaks
1999
1,159
672
2000
710
562
2001
677
396
2002
708
450
2003
1,861
496
2004
2,162
578
2005
3,065
625
2006
3,591
588
2007
2,287
412
2008
887
267
2009
475
161
Culture and Food
Long Beach has a vibrant and diverse cultural scene, featuring several music festivals and cultural events, as well as a variety of ethnic cuisine. Thousand Oaks also offers cultural events and festivals, but with a smaller and less diverse population, the city has less ethnic food variety.
Sports Teams
Long Beach residents have access to all the Los Angeles-based teams and often host pre-season training for some. Thousand Oaks is home to the Los Angeles Rams' training facility, and its residents are generally supporters of Los Angeles sports teams.


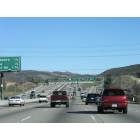
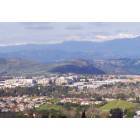

 Long Beach, CA
 Thousand Oaks, CA