Long Beach and Norwalk are both vibrant cities in Southern California. They both present their unique perks and challenges. We will compare these two cities in depth on various fronts like crime/safety, cost of living, infrastructure, etc. This comparison can assist both people considering relocating and tourists planning a visit, to make an informed choice.
Distance between
Long Beach, CA and
Norwalk, CA : 8.3 miles
Long Beach's population is larger by 354%. Its population has decreased by 5,460 people (1.2%) since 2000. The population of Norwalk has decreased by 2,925 people (2.8%) during that time.
Long Beach has a higher crime rate than Norwalk. While Long Beach's crime rates are improving, it remains an area of concern. Norwalk's crime rate is closer to the national average and the city's policing efforts have resulted in improvements in safety. Visitors and residents are advised to stay vigilant in both cities, particularly during the night.
City-data.com crime index counts serious crimes and violent crime more heavily. It adjusts for the number of visitors and daily workers commuting into cities. (higher means more crime, U.S. average = 301.1)
City-data.com crime index counts serious crimes and violent crime more heavily. It adjusts for the number of visitors and daily workers commuting into cities. (higher means more crime, U.S. average = 301.1)
Sex Offenders
According to our data, there are 834 registered sex offenders living in Long Beach and 147 registered sex offenders living in . The ratio of residents to sex offenders in Long Beach is 564 to 1; the ratio in Norwalk is 722 to 1. The number of registered sex offenders compared to the number of residents is larger in Long Beach than in Norwalk.
Cost of Living
The cost of living in Long Beach is significantly higher than in Norwalk. Factors leading to this include housing prices and overall goods and services. Norwalk offers more affordable living, making it more suitable for families on a budget.
Income Tax
California has a progressive state income tax system, and the same rates apply regardless of whether you reside in Long Beach or Norwalk.
Property Tax
Property taxes are based on the county's assessment of property value. Since both cities are in Los Angeles County, they share the same property tax rate.
Sales Tax
The sales tax rate is the same in both cities since they both fall within Los Angeles County, which is currently 9.5%. California's state sales tax stands at 7.25%.
Income
Type
Long Beach
Norwalk
Estimated median household income
$73,905
$79,850
Estimated per capita income
$37,217
$24,537
Cost of living index (U.S. average is 100)
142
138.1
If you make $50,000 in Norwalk, you will have to make $51,412 in Long Beach to maintain the same standard of living.
Geographical Conditions
Long Beach is coastal, offering extensive waterfront and beaches, while Norwalk is inland, featuring typical suburban landscapes and several parks.
Both cities boast a number of quality educational institutions. Long Beach is home to California State University-Long Beach, one of the largest campuses in the California State University system. Norwalk offers a variety of public and private schools and is close to several community colleges.
Long Beach's economy is diversified with sectors like healthcare, education, technology, and arts playing significant roles. Norwalk's economy leans more toward the services sector. Norwalk's proximity to Los Angeles can also be beneficial for commuters.
Biggest Employers
In Long Beach, some of the biggest employers include Long Beach Memorial Medical Center, Boeing, and California State University. In Norwalk, the largest employers are Norwalk La Mirada Unified School District, Los Angeles County Registrar, and Costco.
There were 304 building permits issued in Long Beach in 2012 (238 more than in 2011) compared to 3 building permits issued in Norwalk in 2012.
Weather
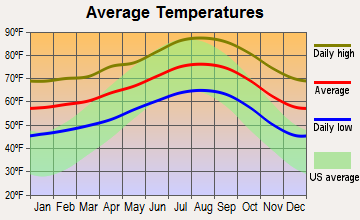
Long Beach and Norwalk have similar climates, typical of Southern California's Mediterranean-like weather: mild winters and warm summers. Long Beach, being closer to the coast, can exhibit slightly cooler temperatures and more frequent fog compared to Norwalk.
Weather and climate
Type
Long Beach
Norwalk
Temperature - Average
65.3°F
66.3°F
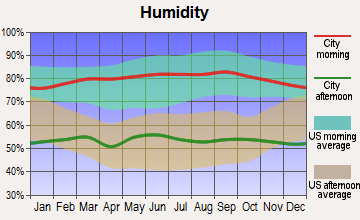
Humidity - Average morning or afternoon humidity
70.4%
69.4%
Humidity - Differences between morning and afternoon humidity
27%
25.6%
Humidity - Maximum monthly morning or afternoon humidity
79%
77.6%
Humidity - Minimum monthly morning or afternoon humidity
52%
52%
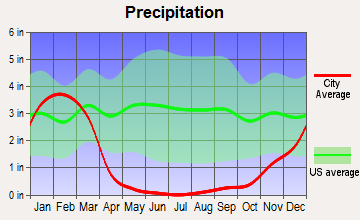
Precipitation - Yearly average
13.1 in
14.9 in
Snowfall - Yearly average
0 in
0 in
Clouds - Number of days clear of clouds
26.4%
26.7%
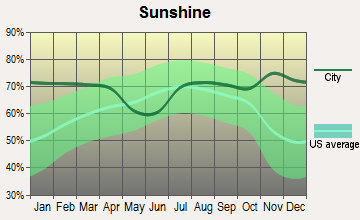
Sunshine amount - Average
78.4%
78.4%
Sunshine amount - Differences during a year
22%
22%
Sunshine amount - Maximum monthly
85%
85%
Sunshine amount - Minimum monthly
63%
63%
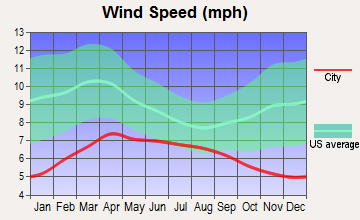
Wind speed - Average
6.1 mph
5.7 mph
Average climate in Long Beach, California
Average climate in Norwalk, California
Air pollution
Type
AQI
CO
NO2
OZONE
PB
PM10
PM25
SO2
Year
Long Beach
Norwalk
Long Beach
Norwalk
Long Beach
Norwalk
Long Beach
Norwalk
Long Beach
Norwalk
Long Beach
Norwalk
Long Beach
Norwalk
Long Beach
Norwalk
2018
124
140
0.37
0.38
17.2
14.3
22.1
25.5
0.008
0.008
27.5
27.1
13.5
13.4
0.7
0.6
2017
122
142
0.36
0.41
18.1
15.3
23.2
26.4
0.007
0.007
26.7
27.9
14.5
14.2
0.8
0.6
2016
115
128
0.36
0.43
18.5
15.1
21.9
25.8
0.007
0.007
24.1
25.3
11.6
12.7
0.9
0.6
2015
111
137
0.38
0.42
19.9
15.8
22.5
26.5
0.005
0.006
25.0
25.8
13.9
14.8
0.9
0.5
2014
127
138
0.50
0.40
20.3
15.9
22.0
25.8
0.007
0.007
26.7
27.8
14.3
15.7
1.3
0.7
2013
126
140
0.48
0.44
20.0
17.0
24.7
25.3
0.005
0.006
32.3
29.9
14.6
14.7
1.0
0.6
2012
132
144
0.48
0.45
19.3
17.1
24.4
24.8
0.004
0.005
30.8
28.9
14.1
15.1
0.6
0.5
2011
119
142
0.43
0.44
20.2
18.2
23.4
24.3
0.006
0.007
28.4
28.5
15.6
16.2
1.2
0.7
2010
115
128
0.38
0.50
20.8
18.5
22.7
22.8
0.011
0.013
24.1
25.5
11.9
14.1
0.7
0.6
2009
132
150
0.50
0.50
21.0
20.3
22.0
24.1
0.008
0.010
27.7
29.4
13.1
15.3
1.1
0.9
2008
124
152
0.53
0.51
20.8
22.9
23.2
22.9
0.008
0.012
27.2
31.0
21.6
18.3
1.0
0.9
2007
109
128
0.60
0.52
20.3
22.8
21.1
22.7
0.010
0.014
N/A
N/A
N/A
N/A
1.4
1.3
2006
119
125
0.76
0.58
21.4
23.7
19.9
23.7
0.005
0.009
N/A
N/A
N/A
N/A
1.7
1.6
2005
108
123
0.74
0.60
24.3
25.0
20.5
21.8
0.011
0.014
N/A
N/A
N/A
N/A
2.7
2.4
2004
125
132
0.56
0.64
28.0
26.5
22.9
24.1
0.012
0.016
N/A
N/A
N/A
N/A
2.0
2.2
2003
130
143
0.83
0.83
28.1
29.2
22.4
21.3
0.032
0.026
N/A
N/A
N/A
N/A
1.1
1.3
2002
120
137
0.90
0.87
29.6
30.1
22.2
20.3
0.011
0.021
N/A
N/A
N/A
N/A
2.8
2.4
2001
124
143
0.81
0.93
30.3
31.6
21.5
18.9
0.011
0.039
N/A
N/A
N/A
N/A
3.3
2.5
2000
142
149
0.71
0.94
31.5
33.4
19.6
18.4
0.018
0.031
N/A
N/A
N/A
N/A
2.0
1.7
Natural disasters
Type
Long Beach
Norwalk
Tornado activity compared to U.S. average
18.3%
18.8%
Earthquake activity compared to U.S. average
6,875.1%
7,030.2%
Natural disasters compared to U.S. average
57%
57%
Transportation
Both cities are served by well-structured public transit systems. Long Beach has a more developed public transit system with its own city bus and light rail service. Norwalk, due to its proximity to LA, has great access to freeways and public transportation going into the city.
Transport
Type
Long Beach
Norwalk
Amtrak stations
1
0
Amtrak stations nearby
3
3
FAA registered aircraft
312
16
FAA registered aircraft manufacturers and dealers
29
0
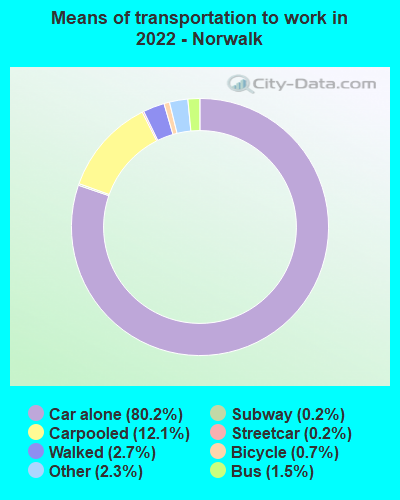
Means of transportation to work
Type
Long Beach
Norwalk
Bicycle
0.5%
0.6%
Bus
3.3%
1.6%
Carpooled
9.8%
10.2%
Car alone
81.8%
82.2%
Motorcycle
0.2%
0%
Streetcar
0.1%
0.2%
Subway
0.5%
0.3%
Walked
2.8%
2.3%
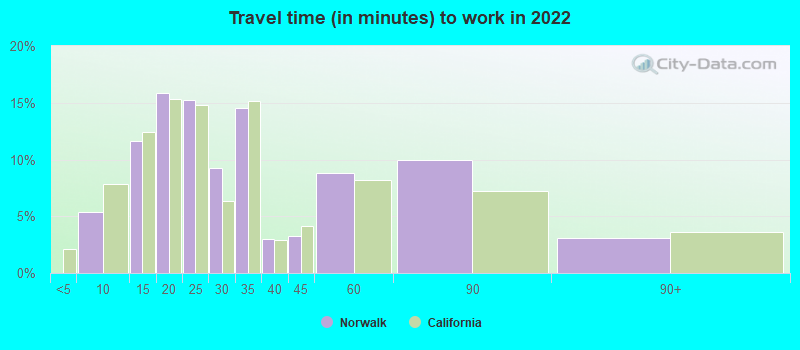
Average travel time to work
Type
Long Beach
Norwalk
Average
30.7 min
28.3 min
Other means
28.5 min
28.2 min
Public transportation
46.4 min
51.6 min
Private vehicle occupancy
Type
Long Beach
Norwalk
Average
1.1
1.2
Drove alone
89.7%
88.2%
In 2 person carpool
8.5%
7.7%
In 3 person carpool
1.4%
2.6%
In 4 person carpool
0.3%
0.8%
In 5-6 person carpool
0%
0.7%
How many people usually rode to work in the car, truck or van.
Real Estate
Real estate in Long Beach tends to be more expensive than in Norwalk due to its seaside location, with a variety of housing from apartments to single-family homes. Norwalk offers more affordable housing options and is a good choice for first-time homebuyers.
Neighborhoods
Long Beach boasts a range of neighborhoods from upscale seaside communities to urbanized downtown areas. Norwalk offers a more suburban vibe, with neighborhoods that feature single-family homes and are known for their family-friendly ambiance.
Houses and residents
Type
Long Beach
Norwalk
Houses
179,856
26,860
Average household size (people)
2.8
3.8
Median year apartment built
1964
1969
Median year house/condo built
1954
1956
Length of stay in the house since moving in
15.7 years
16.6 years
Houses occupied
172,599 (96%)
26,506 (98.7%)
Houses occupied by owners
69,470 (40.2%)
18,333 (69.2%)
Houses occupied by renters
103,129 (59.8%)
8,173 (30.8%)
Median rent asked for vacant for-rent units
$1,057
$1,744
Median monthly housing costs
$1,692
$1,688
Median price asked for vacant for-sale houses and condos
$520,992
$425,780
Estimated median house or condo value
$693,600
$585,200
Median numbers of rooms
4.2
5.1
Median number of rooms in apartments
3.6
4.1
Median number of rooms in houses and condos
5.5
5.5
Median house price - detached houses
$900,658
$571,504
Median house price - in 3-to-4-unit structures
$495,928
$401,042
Median house price - in 5 or more unit structures
$488,399
$334,508
Median house price - mobile homes
$333,777
$97,897
Median house price - Townhouses or other attached units
$634,684
$478,204
Median house price - All housing units
$805,766
$554,110
Median house age
62
64
Renting percentage
58.4%
34.9%
Housing density (houses/condos per square mile)
3,565.7
2,773.8
House value disparities
21.3%
15.5%
Household income disparities
44.7%
40.5%
Median household income for houses/condes with a mortgage
$116,421
$104,247
Median household income for apartments without a mortgage
$79,392
$69,620
Housing units without a mortgage
394 (0.8%)
244 (1.9%)
Housing units with both a second mortgage and home equity loan
3,069 (6.2%)
692 (5.5%)
Housing units with a mortgage
49,321 (99.2%)
12,410 (98.1%)
Housing units with a home equity loan
48 (0.1%)
0 (0%)
Housing units with a second mortgage
3,709 (7.5%)
692 (5.5%)
House/condo owner moved in on average (years ago)
15
16
House/condo renter moved in on average (years ago)
3
6
Housing units lacking complete kitchen facilities
2.6%
1.5%
Housing units lacking complete plumbing facilities
0.4%
0.5%
Housing units in structures
Housing units in structures
Long Beach
Norwalk
One, detached
40.2%
75.8%
One, attached
4.9%
3.5%
Two
5.3%
0.5%
3 or 4
8.8%
3.1%
5 to 9
10.4%
3.0%
10 to 19
10.8%
1.1%
20 to 49
8.0%
4.8%
50 or more
10.6%
6.2%
Mobile homes
0.8%
2.1%
Boats, RVs, vans, etc.
0.2%
0.0%
Median real estate property taxes paid for housing units
Self-employed workers in own not incorporated business
18,532
2,563
State government workers
6,550
1,173
Unpaid family workers
178
0
Industries and Occupations
The leading industries in Long Beach are healthcare, education, and technology, offering varied occupational opportunities. Norwalk is prominent in retail trade and manufacturing. Both cities offer diverse job opportunities.
Health diagnosing and treating practitioners and other technical occupations
4.9%
4.2%
Community and social service occupations
4.4%
3.4%
Personal care and service occupations
3.6%
2.9%
Arts, design, entertainment, sports, and media occupations
3.0%
1.2%
Building and grounds cleaning and maintenance occupations
2.9%
2.5%
Health technologists and technicians
2.8%
3.8%
Material moving occupations
2.8%
4.0%
Production occupations
2.7%
5.9%
Computer and mathematical occupations
1.9%
0.0%
Transportation occupations
1.4%
0.6%
Life, physical, and social science occupations
1.3%
0.4%
Legal occupations
1.3%
0.5%
Architecture and engineering occupations
1.0%
1.1%
Health Care
The healthcare system in Long Beach is more robust due to its larger population. It hosts several large hospitals and clinics. Norwalk also offers reliable healthcare facilities, with a number of clinics and a dependable community hospital network.
Long Beach is larger in terms of area and population, which translates to more infrastructure like hospitals, parks, and recreational facilities. Norwalk, although smaller, centres its infrastructure around community needs, with a focus on enhancing quality of life.
HMDA - Conventional home purchase loans - Applications denied
Year
Long Beach
Norwalk
1999
1,159
171
2000
710
190
2001
677
179
2002
708
227
2003
1,861
381
2004
2,162
532
2005
3,065
722
2006
3,591
805
2007
2,287
509
2008
887
159
2009
475
75
Culture and Food
Long Beach showcases cultural diversity with numerous festivals, art exhibits, and diverse culinary scene. Norwalk also has a variety of cultural experiences, but not on the same large scale as Long Beach. Both cities have a great selection of restaurants and food options.
Sports Teams
Long Beach doesn't have any major league sports teams but has an active local sports scene. Norwalk also doesn't have any major league teams. For both cities, the major Los Angeles teams are the closest professional sports options.

 Long Beach, CA
 Norwalk, CA