Comparing two Californian coastal cities - Long Beach and Huntington Beach, one can tell they are characteristically similar but uniquely different. Both cities are known for their beautiful beaches, vibrant communities, and amenities, however, the experience of living or visiting varies based on factors like cost of living, education, employment demographics, and more. Detailed comparison further provides distinct features of the two populous cities, making each attractive in their own way.
Distance between
Long Beach, CA and
Huntington Beach, CA : 11.9 miles
Long Beach's population is larger by 132%. Its population has decreased by 5,460 people (1.2%) since 2000. The population of Huntington Beach has grown by 7,058 people (3.7%) during that time.
Both Long Beach and Huntington Beach are relatively safe, but crime rates can vary between neighborhoods. Long Beach has higher crime rates compared to Huntington Beach, according to NeighborhoodScout. That doesn't mean Long Beach lacks safe neighborhoods, but Huntington Beach generally feels safer. Tourists and potential residents should be aware of the difference while planning their stay.
City-data.com crime index counts serious crimes and violent crime more heavily. It adjusts for the number of visitors and daily workers commuting into cities. (higher means more crime, U.S. average = 301.1)
City-data.com crime index counts serious crimes and violent crime more heavily. It adjusts for the number of visitors and daily workers commuting into cities. (higher means more crime, U.S. average = 301.1)
Sex Offenders
According to our data, there are 834 registered sex offenders living in Long Beach and 91 registered sex offenders living in . The ratio of residents to sex offenders in Long Beach is 564 to 1; the ratio in Huntington Beach is 2,205 to 1. The number of registered sex offenders compared to the number of residents is much larger in Long Beach than that in Huntington Beach.
Cost of Living
Cost of living in both cities is relatively high, in line with California's standards. As per Payscale, Huntington Beach has a higher cost of living - about 9% more expensive than Long Beach. This is reflected in the prices of goods, services, and notably, housing.
Income Tax
In terms of state income tax, both Long Beach and Huntington Beach residents are subject to the same California state income tax rates, ranging from 1% to 13.3% based on income level.
Property Tax
Property tax rates in both cities are also the same, at a basic rate of 1% of the assessed value of the property plus additional local taxes and bond measures.
Sales Tax
Sales tax in both cities is the same at 7.25%. This rate includes the California state sales tax of 6.00%, the county tax of 0.25%, and an additional district tax of 1.00%.
Income
Type
Long Beach
Huntington Beach
Estimated median household income
$73,905
$107,808
Estimated per capita income
$37,217
$56,934
Cost of living index (U.S. average is 100)
142
89.5
If you make $50,000 in Huntington Beach, you will have to make $79,330 in Long Beach to maintain the same standard of living.
Geographical Conditions
Both cities are coastal with beautiful Pacific Ocean beaches. Long Beach features a mix of cityscape and coastal areas, hosting the busiest container shipping port in the US. Huntington Beach, recognized as "Surf City USA," is primarily a beach town.
Long Beach is home to the prestigious California State University, Long Beach, as well as a variety of other educational institutions serving its diverse population. Huntington Beach also offers excellent education, but without the presence of a major state university, it doesn't have the same type of student culture and resources as Long Beach.
The economies of both Long Beach and Huntington Beach are robust and diverse. Long Beach, with its port, is a significant player in international trade, while Huntington Beach capitalizes on tourism and its thriving surf industry. Job seekers and entrepreneurs will find opportunities in various fields in both cities.
Biggest Employers
In Long Beach, some of the biggest employers are the Long Beach Unified School District, the City of Long Beach, and the Boeing Company. Huntington Beach's largest employers are the Huntington Beach Union High School District, the City of Huntington Beach, and Boeing as well.
There were 304 building permits issued in Long Beach in 2012 (238 more than in 2011) compared to 100 building permits issued in Huntington Beach in 2012 (76 more than in 2011).
In Long Beach (Los Angeles County), 69.7% voted for Democrats and 27.8% for Republicans in 2012 Presidential Election. In Huntington Beach (Orange County), 45.8% voted for Democrats and 52.0% for Republicans.
Elections
Type
Democrats
Republicans
Other
Year
Long Beach
Huntington Beach
Long Beach
Huntington Beach
Long Beach
Huntington Beach
2020
71.0%
53.6%
26.9%
44.6%
2.1%
1.8%
2016
72.0%
50.9%
22.5%
42.4%
5.5%
6.7%
2012
69.7%
45.8%
27.8%
52.0%
2.4%
2.3%
2008
69.2%
47.8%
28.8%
50.3%
1.9%
1.9%
2004
63.3%
39.3%
35.7%
60.2%
1.0%
0.5%
2000
63.6%
40.4%
32.4%
55.9%
4.0%
3.7%
1996
59.3%
37.9%
31.0%
51.7%
9.7%
10.5%
Breakdown of population affiliated with a religious congregation
Type
Adherents
Congregations
Religion
Long Beach
Huntington Beach
Long Beach
Huntington Beach
CATHOLIC CHURCH
36.1%
26.5%
4.7%
4.4%
SOUTHERN BAPTIST CONVENTION
1.0%
2.3%
9.0%
8.8%
MUSLIM ESTIMATE
0.7%
0.8%
1.0%
1.3%
AMERICAN BAPTIST CHURCHES IN THE USA
0.5%
0.2%
3.1%
1.7%
SEVENTH DAY ADVENTIST CHURCH
0.5%
0.4%
2.4%
1.3%
EPISCOPAL CHURCH
0.4%
0.4%
1.4%
1.4%
EVANGELICAL LUTHERAN CHURCH IN AMERICA
0.2%
0.4%
1.9%
2.3%
LUTHERAN CHURCH
0.2%
0.6%
1.6%
2.0%
REFORMED CHURCH IN AMERICA
0.1%
0.3%
0.2%
0.2%
Weather
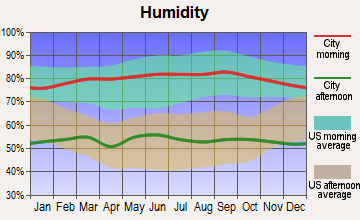
The weather in both cities is typically Southern Californian - mild, warm, and dry. Long Beach, being closer to Los Angeles, can be slightly warmer, while Huntington Beach, with its Pacific Ocean influence, often has a cooling sea breeze. Both cities experience abundant sunshine throughout the year, perfect for lovers of outdoor activities.
Weather and climate
Type
Long Beach
Huntington Beach
Temperature - Average
65.3°F
64.3°F
Humidity - Average morning or afternoon humidity
70.4%
70.1%
Humidity - Differences between morning and afternoon humidity
27%
26.7%
Humidity - Maximum monthly morning or afternoon humidity
79%
78.7%
Humidity - Minimum monthly morning or afternoon humidity
52%
52%
Precipitation - Yearly average
13.1 in
12.9 in
Snowfall - Yearly average
0 in
0 in
Clouds - Number of days clear of clouds
26.4%
26.5%
Sunshine amount - Average
78.4%
78.4%
Sunshine amount - Differences during a year
22%
21.9%
Sunshine amount - Maximum monthly
85%
84.8%
Sunshine amount - Minimum monthly
63%
62.9%
Wind speed - Average
6.1 mph
6 mph
Average climate in Long Beach, California
Average climate in Huntington Beach, California
Air pollution
Type
AQI
CO
NO2
OZONE
PB
PM10
PM25
SO2
Year
Long Beach
Huntington Beach
Long Beach
Huntington Beach
Long Beach
Huntington Beach
Long Beach
Huntington Beach
Long Beach
Huntington Beach
Long Beach
Huntington Beach
Long Beach
Huntington Beach
Long Beach
Huntington Beach
2018
124
119
0.37
0.35
17.2
14.5
22.1
26.2
0.008
N/A
27.5
27.5
13.5
12.7
0.7
0.7
2017
122
116
0.36
0.33
18.1
13.6
23.2
29.3
0.007
N/A
26.7
26.7
14.5
13.9
0.8
0.5
2016
115
102
0.36
0.31
18.5
11.8
21.9
29.9
0.007
N/A
24.1
24.1
11.6
12.4
0.9
0.2
2015
111
106
0.38
0.30
19.9
12.8
22.5
30.4
0.005
N/A
25.0
25.0
13.9
14.4
0.9
0.2
2014
127
110
0.50
0.27
20.3
12.4
22.0
29.0
0.007
N/A
26.7
26.7
14.3
15.4
1.3
0.4
2013
126
107
0.48
0.32
20.0
13.4
24.7
28.2
0.005
0.003
32.3
29.7
14.6
14.2
1.0
0.3
2012
132
103
0.48
0.27
19.3
12.1
24.4
27.1
0.004
0.004
30.8
28.3
14.1
14.3
0.6
0.1
2011
119
109
0.43
0.30
20.2
14.2
23.4
27.3
0.006
0.006
28.4
27.7
15.6
15.8
1.2
0.7
2010
115
102
0.38
0.31
20.8
13.6
22.7
26.5
0.011
0.011
24.1
23.6
11.9
13.9
0.7
0.6
2009
132
118
0.50
0.33
21.0
14.9
22.0
28.1
0.008
0.009
27.7
24.3
13.1
14.4
1.1
1.1
2008
124
124
0.53
0.38
20.8
15.7
23.2
28.7
0.008
0.010
27.2
29.3
21.6
21.6
1.0
1.1
2007
109
100
0.60
0.35
20.3
15.6
21.1
27.4
0.010
0.012
N/A
N/A
N/A
N/A
1.4
0.8
2006
119
114
0.76
0.39
21.4
16.6
19.9
26.6
0.005
0.007
N/A
N/A
N/A
N/A
1.7
1.3
2005
108
95
0.74
0.37
24.3
16.8
20.5
28.2
0.011
0.012
N/A
N/A
N/A
N/A
2.7
1.3
2004
125
119
0.56
0.49
28.0
18.5
22.9
30.6
0.012
0.014
N/A
N/A
N/A
N/A
2.0
1.6
2003
130
122
0.83
0.63
28.1
21.1
22.4
30.0
0.032
0.030
N/A
N/A
N/A
N/A
1.1
1.1
2002
120
106
0.90
0.63
29.6
21.2
22.2
26.3
0.011
0.018
N/A
N/A
N/A
N/A
2.8
1.7
2001
124
116
0.81
0.71
30.3
21.0
21.5
26.0
0.011
0.033
N/A
N/A
N/A
N/A
3.3
1.5
2000
142
125
0.71
0.80
31.5
23.3
19.6
24.6
0.018
0.027
N/A
N/A
N/A
N/A
2.0
1.9
Natural disasters
Type
Long Beach
Huntington Beach
Tornado activity compared to U.S. average
18.3%
18.5%
Earthquake activity compared to U.S. average
6,875.1%
6,818%
Natural disasters compared to U.S. average
57%
32%
Transportation
Both cities have comprehensive public transportation systems. Long Beach Transit provides bus services in Long Beach, while the Orange County Transportation Authority serves Huntington Beach. Due to its larger size, commuting times in Long Beach may be slightly longer.
Transport
Type
Long Beach
Huntington Beach
Amtrak stations
1
0
Amtrak stations nearby
3
3
FAA registered aircraft
312
156
FAA registered aircraft manufacturers and dealers
29
6
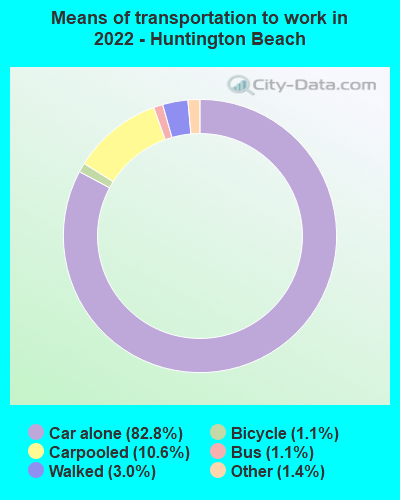
Means of transportation to work
Type
Long Beach
Huntington Beach
Bicycle
0.5%
0.4%
Bus
3.3%
1.1%
Carpooled
9.8%
9.8%
Car alone
81.8%
85.3%
Motorcycle
0.2%
0.2%
Subway
0.5%
0%
Walked
2.8%
2%
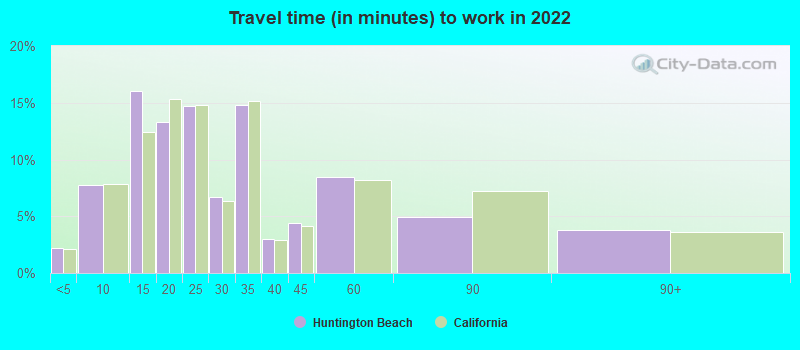
Average travel time to work
Type
Long Beach
Huntington Beach
Average
30.7 min
25.6 min
Other means
28.5 min
30.1 min
Public transportation
46.4 min
42.2 min
Private vehicle occupancy
Type
Long Beach
Huntington Beach
Average
1.1
1.1
Drove alone
89.7%
92.2%
In 2 person carpool
8.5%
6.3%
In 3 person carpool
1.4%
1%
In 4 person carpool
0.3%
0.5%
How many people usually rode to work in the car, truck or van.
Real Estate
The real estate market is more expensive in Huntington Beach compared to Long Beach. Median home prices in Huntington Beach are significantly higher than those in Long Beach. Rental prices also reflect this difference, which prospective residents should consider.
Neighborhoods
Long Beach is known for its diverse neighborhoods, from the urban Downtown area to the seaside Belmont Shore. Huntington Beach has less diversity but compensates with a more laid-back, small-town feel in its primary residential areas.
Houses and residents
Type
Long Beach
Huntington Beach
Houses
179,856
83,658
Average household size (people)
2.8
2.6
Median year apartment built
1964
1976
Median year house/condo built
1954
1971
Length of stay in the house since moving in
15.7 years
16.6 years
Houses occupied
172,599 (96%)
79,930 (95.5%)
Houses occupied by owners
69,470 (40.2%)
45,454 (56.9%)
Houses occupied by renters
103,129 (59.8%)
34,476 (43.1%)
Median rent asked for vacant for-rent units
$1,057
$2,370
Median monthly housing costs
$1,692
$2,132
Median price asked for vacant for-sale houses and condos
$520,992
$672,773
Estimated median house or condo value
$693,600
$937,200
Median numbers of rooms
4.2
5.3
Median number of rooms in apartments
3.6
4.1
Median number of rooms in houses and condos
5.5
6.2
Median house price - detached houses
$900,658
Over $1,000,000
Median house price - in 2-unit structures
$823,515
Over $1,000,000
Median house price - in 3-to-4-unit structures
$495,928
$728,022
Median house price - in 5 or more unit structures
$488,399
$577,548
Median house price - mobile homes
$333,777
$94,814
Median house price - Townhouses or other attached units
$634,684
$754,302
Median house price - All housing units
$805,766
$992,600
Median house age
62
48
Renting percentage
58.4%
39.5%
Housing density (houses/condos per square mile)
3,565.7
3,169.8
House value disparities
21.3%
21.8%
Household income disparities
44.7%
40.7%
Median household income for houses/condes with a mortgage
$116,421
$154,344
Median household income for apartments without a mortgage
$79,392
$104,573
Housing units without a mortgage
394 (0.8%)
644 (2.2%)
Housing units with both a second mortgage and home equity loan
3,069 (6.2%)
2,305 (8%)
Housing units with a mortgage
49,321 (99.2%)
28,306 (97.8%)
Housing units with a home equity loan
48 (0.1%)
132 (0.5%)
Housing units with a second mortgage
3,709 (7.5%)
2,690 (9.3%)
House/condo owner moved in on average (years ago)
15
17
House/condo renter moved in on average (years ago)
3
3
Housing units lacking complete kitchen facilities
2.6%
0.6%
Housing units in structures
Housing units in structures
Long Beach
Huntington Beach
One, detached
40.2%
50.0%
One, attached
4.9%
10.5%
Two
5.3%
1.0%
3 or 4
8.8%
13.6%
5 to 9
10.4%
4.7%
10 to 19
10.8%
5.0%
20 to 49
8.0%
2.9%
50 or more
10.6%
9.2%
Mobile homes
0.8%
3.2%
Boats, RVs, vans, etc.
0.2%
0.0%
Median real estate property taxes paid for housing units
Self-employed workers in own not incorporated business
18,532
7,644
State government workers
6,550
2,609
Unpaid family workers
178
245
Industries and Occupations
The leading industries in Long Beach include trade, education, health services, and government, while in Huntington Beach, tourism, health services, and retail dominate. Both cities have a mix of blue-collar and white-collar jobs, with a large number of professionals, sales and office workers, and service providers.
Both cities offer high-quality healthcare with numerous medical facilities. Long Beach Memorial Medical Center is a highly rated hospital in Long Beach. Huntington Beach Hospital serves the Huntington Beach area. Both cities are also within driving distance of specialist healthcare facilities in Los Angeles.
Health (county statistics)
Type
Long Beach
Huntington Beach
General health status score of residents in this county from 1 (poor) to 5 (excellent)
Both cities boast well-developed infrastructure, including transportation systems, utilities, and public services. Long Beach's infrastructure is larger, befitting its status as a port city, but Huntington Beach also offers high-quality infrastructure to its residents and visitors.
Infrastructure
Type
Long Beach
Huntington Beach
Hospitals
17
2
TV stations
5
2
Bank branches located here
67
46
Bank institutions located here
18
19
Main business address for public companies
11
3
Drinking water stations with no reported violations in the past
2
0
Drinking water stations with reported violations in the past
HMDA - Conventional home purchase loans - Applications denied
Year
Long Beach
Huntington Beach
1999
1,159
756
2000
710
771
2001
677
544
2002
708
493
2003
1,861
703
2004
2,162
738
2005
3,065
952
2006
3,591
715
2007
2,287
604
2008
887
375
2009
475
232
Culture and Food
Both cities have rich culture and food scenes. Long Beach, however, being a larger and more diverse city, boasts an impressive variety of international cuisine and cultural festivals. Huntington Beach has a more beachside, surf town vibe, with many casual eateries and seafood restaurants.
Sports Teams
Neither city has professional sports teams, but both cities are a short drive from Los Angeles, home to teams like the Lakers, Dodgers, and Kings. However, Huntington Beach is renowned worldwide for its surf culture, hosting prestigious surfing competitions like the US Open of Surfing.


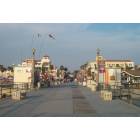
 Long Beach, CA
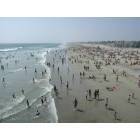
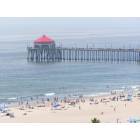
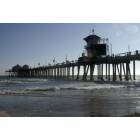
 Huntington Beach, CA