Long Beach, CA vs El Monte, CA - Advanced U.S. city comparison tool

Long Beach, CA vs El Monte, CA

California, known for its diverse culture and lifestyle, offers a variety of city landscapes to choose from. Long Beach and El Monte are two of such cities, each boasting its unique features and attractions. This comparison, focusing on aspects such as crime rates, weather, cost of living, and healthcare, among others, will provide a comprehensive overview of what each city has to offer for both prospective residents and tourists alike.
 
 
Distance between Long Beach, CA and El Monte, CA : 20.0 miles

Long Beach's population is larger by 327%. Its population has decreased by 5,460 people (1.2%) since 2000. The population of El Monte has decreased by 9,058 people (7.8%) during that time.

Population
Type Long Beach El Monte
Population 456,062 106,907
Female / male percentage 51.3% / 48.7%
51.3%
48.7%
48.4% / 51.6%
48.4%
51.6%
Racial makeup - percentage
Ethnicity Long BeachEl Monte
Hispanic 42.3% 67.7%
White Non-Hispanic 26.7% 3.0%
Asian 14.7% 28.1%
Black 11.0% 0.4%
Two or more 4.2% 0.4%
American Indian 0.2% 0.1%
Pacific Islander 0.2% 0.0%
Racial makeup - absolute values
Ethnicity Long BeachEl Monte
Hispanic 193,000 72,410
White Non-Hispanic 121,546 3,198
Asian 67,238 30,094
Black 50,199 429
Two or more 19,258 385
American Indian 1,107 100
Pacific Islander 1,026 0

Crime and Safety

The crime rate in Long Beach is relatively higher than in El Monte. Violent crimes and property crimes are more prevalent in Long Beach compared to El Monte. However, both cities have invested greatly in law enforcement, boosting security measures to ensure the safety of residents and visitors.

Crime by year per 100,000 residents
Type City-data.com crime indexRobberies per 100,000Murders per 100,000Rapes per 100,000Assaults per 100,000Burglaries per 100,000Theft per 100,000Auto theft per 100,000Arson per 100,000
Year Long BeachEl MonteLong BeachEl MonteLong BeachEl MonteLong BeachEl MonteLong BeachEl MonteLong BeachEl MonteLong BeachEl MonteLong BeachEl MonteLong BeachEl Monte
2020 312.7 191.4 155.8 105.5 7.8 7.8 52.3 34.6 290.5 153.0 552.0 293.9 1,593.6 847.1 600.9 393.3 42.8 18.2
2019 297.4 168.4 204.7 108.8 7.3 1.7 53.2 29.4 241.0 122.6 466.9 299.6 1,443.2 903.0 503.9 340.2 32.7 14.7
2018 335.4 209.0 208.1 127.9 6.4 5.2 46.6 30.1 437.0 147.7 494.9 413.9 1,554.9 1,078.4 484.4 432.8 27.0 17.2
2017 339.7 262.1 262.4 157.5 4.7 4.3 43.1 37.0 347.7 189.4 586.6 591.4 1,507.0 1,231.8 578.9 600.9 26.9 11.2
2016 342.8 237.0 238.8 142.3 6.9 2.6 41.3 26.4 310.2 210.5 627.1 575.2 1,758.1 969.7 600.0 586.3 24.6 19.6
2015 337.8 211.0 221.3 121.8 7.6 6.8 37.2 17.9 314.7 194.2 649.6 392.8 1,766.3 844.3 594.1 579.3 14.5 24.7
2014 284.9 193.0 188.7 141.1 4.9 1.7 23.3 17.2 272.1 126.5 739.1 397.5 1,459.3 1,005.0 441.7 501.6 16.6 4.3
2013 304.8 194.4 238.0 134.1 7.2 2.6 21.9 12.1 232.3 145.3 804.0 491.4 1,462.3 898.0 501.4 498.3 20.7 9.5
2012 335.4 211.8 263.7 176.0 6.8 3.5 24.5 12.1 280.7 150.8 808.5 495.0 1,639.1 937.1 559.7 501.1 22.1 12.1
2011 323.9 224.2 282.2 170.7 5.3 0.9 23.9 28.7 299.3 166.4 700.2 473.8 1,567.1 989.5 473.0 527.8 22.0 5.2
2010 312.2 283.9 260.0 233.5 6.9 2.6 29.0 23.8 292.5 268.8 633.6 534.9 1,411.3 1,052.2 473.5 702.4 17.1 11.5
2009 348.0 285.5 297.6 248.3 8.6 2.5 28.2 11.4 346.8 322.6 671.6 526.0 1,544.5 1,149.2 508.9 620.0 23.1 7.4
2008 353.5 309.6 318.4 215.4 8.6 9.8 25.7 26.0 323.5 399.0 659.5 513.6 1,507.1 1,083.3 614.9 569.7 27.8 22.8
2007 361.8 281.3 317.7 189.2 8.9 4.8 29.1 20.1 367.1 338.2 612.9 503.3 1,522.1 1,121.7 603.4 637.8 26.0 17.7
2006 357.9 290.0 301.1 151.3 8.6 4.0 28.0 20.2 377.4 332.5 605.5 672.2 1,379.5 1,160.9 686.6 754.8 21.5 16.2
2005 316.5 290.3 292.5 196.0 8.8 3.3 21.7 17.1 385.6 362.0 616.0 571.0 1,419.1 1,342.2 780.2 923.3 25.6 17.9
2004 346.1 299.6 318.7 190.0 10.0 5.7 28.5 26.0 423.5 423.1 674.7 586.3 1,546.3 1,302.5 795.5 777.1 39.5 13.8
2003 340.6 280.1 295.6 179.1 10.3 2.5 28.5 19.8 415.4 401.1 629.1 537.2 1,690.9 1,308.8 785.1 788.1 45.5 19.8

City-data.com crime index counts serious crimes and violent crime more heavily. It adjusts for the number of visitors and daily workers commuting into cities. (higher means more crime, U.S. average = 301.1)


Crime per year
Type City-data.com crime indexRobberiesMurdersRapesAssaultsBurglariesTheftAuto theftArson
Year Long BeachEl MonteLong BeachEl MonteLong BeachEl MonteLong BeachEl MonteLong BeachEl MonteLong BeachEl MonteLong BeachEl MonteLong BeachEl MonteLong BeachEl Monte
2019 297.4 168.4 958 126 34 2 249 34 1,128 142 2,185 347 6,754 1,046 2,358 394 153 17
2018 335.4 209.0 979 149 30 6 219 35 2,056 172 2,328 482 7,315 1,256 2,279 504 127 20
2017 339.7 262.1 1,237 183 22 5 203 43 1,639 220 2,765 687 7,104 1,431 2,729 698 127 13
2016 342.8 237.0 1,138 167 33 3 197 31 1,478 247 2,988 675 8,377 1,138 2,859 688 117 23
2015 337.8 211.0 1,054 143 36 8 177 21 1,499 228 3,094 461 8,413 991 2,830 680 69 29
2014 284.9 193.0 889 164 23 2 110 20 1,282 147 3,482 462 6,875 1,168 2,081 583 78 5
2013 304.8 194.4 1,118 155 34 3 103 14 1,091 168 3,776 568 6,868 1,038 2,355 576 97 11
2012 335.4 211.8 1,239 203 32 4 115 14 1,319 174 3,799 571 7,702 1,081 2,630 578 104 14
2011 323.9 224.2 1,320 196 25 1 112 33 1,400 191 3,275 544 7,329 1,136 2,212 606 103 6
2010 312.2 283.9 1,202 265 32 3 134 27 1,352 305 2,929 607 6,524 1,194 2,189 797 79 13
2009 348.0 285.5 1,381 304 40 3 131 14 1,609 395 3,116 644 7,166 1,407 2,361 759 107 9
2008 353.5 309.6 1,487 265 40 12 120 32 1,511 491 3,080 632 7,039 1,333 2,872 701 130 28
2007 361.8 281.3 1,506 235 42 6 138 25 1,740 420 2,905 625 7,214 1,393 2,860 792 123 22
2006 357.9 290.0 1,440 187 41 5 134 25 1,805 411 2,896 831 6,598 1,435 3,284 933 103 20
2005 316.5 290.3 1,403 241 42 4 104 21 1,850 445 2,955 702 6,808 1,650 3,743 1,135 123 22
2004 346.1 299.6 1,533 234 48 7 137 32 2,037 521 3,245 722 7,437 1,604 3,826 957 190 17
2003 340.6 280.1 1,411 217 49 3 136 24 1,983 486 3,003 651 8,072 1,586 3,748 955 217 24

City-data.com crime index counts serious crimes and violent crime more heavily. It adjusts for the number of visitors and daily workers commuting into cities. (higher means more crime, U.S. average = 301.1)

Sex Offenders

According to our data, there are 834 registered sex offenders living in Long Beach and 189 registered sex offenders living in .
The ratio of residents to sex offenders in Long Beach is 564 to 1; the ratio in El Monte is 617 to 1.
The number of registered sex offenders compared to the number of residents in Long Beach is near to than in El Monte.

Cost of Living

The cost of living in Long Beach is significantly higher than in El Monte. This is majorly influenced by the higher housing costs, healthcare, and transportation. Despite these costs, the quality of life in Long Beach is considered to be higher owing to the availability of amenities and recreational facilities.

Income Tax

California's state income tax applies uniformly across all cities, with rates ranging from 1% to 13.3% based on income levels.

Property Tax

Property tax rates vary slightly, with Long Beach averaging around 1.04% and El Monte around 1.16%. The higher rate in El Monte can be attributed to additional levies and special district taxes.

Sales Tax

Both cities are subject to California's standard sales tax rate of 7.25%. However, additional local taxes may apply, making the total sales tax in Long Beach 10.25% and in El Monte 10.5%.
Income
Type Long Beach El Monte
Estimated median household income $73,905 $55,609
Estimated per capita income $37,217 $21,307
Cost of living index (U.S. average is 100) 142 141.8

If you make $50,000 in El Monte, you will have to make $50,071 in Long Beach to maintain the same standard of living.

Geographical Conditions

Long Beach, located on the Pacific coast, boasts beachfront living and a picturesque pier. El Monte is nestled in the San Gabriel Valley providing beautiful mountain views.
Geographical information
Type Long Beach El Monte
Land area 50.4 sq. miles 9.6 sq. miles
Population density 9,041.5 people per sq. mile 11,191 people per sq. mile
Elevation 29 feet 283 feet
Relative area comparison
Long Beach, CA El Monte, CA
First ancestry reported - percentage
Ancestry Long BeachEl Monte
Irish 2.3% 0.1%
German 1.9% 0.2%
English 1.7% 0.1%
Italian 1.6% 0.2%
Norwegian 0.5% 0.0%
Polish 0.5% 0.0%
French 0.4% 0.0%
Russian 0.4% 0.0%
Scottish 0.4% 0.0%
Dutch 0.3% 0.0%
Swedish 0.3% 0.0%
Population origin - absolute values
Ancestry Long BeachEl Monte
Irish 6,493 115
German 5,503 141
English 4,947 100
Italian 4,619 132
Polish 1,476 22
Norwegian 1,408 20
French 1,168 8
Russian 1,164 0
Scottish 1,033 24
Swedish 942 8
Dutch 716 0
Czech 534 0
French Canadian 494 45
Greek 472 6
Ukrainian 365 22
Portuguese 358 13
Scotch-Irish 344 19
Welsh 285 11
Danish 215 3
Hungarian 184 4
Foreign born residents - absolute values
Type Count
Region Long BeachEl Monte
All 114,152 51,976
Africa 2,106 5
Asia 35,668 23,528
Europe 5,584 166
Latin America 69,194 28,263
North America 1,339 26
Oceania 987 316
Foreign born residents - percentage
Type Percentage
Region Long BeachEl Monte
All 24.9% 48.1%
Africa 0.5% 0.0%
Asia 7.8% 21.8%
Europe 1.2% 0.2%
Latin America 15.1% 26.2%
North America 0.3% 0.0%
Oceania 0.2% 0.3%

Education

El Monte and Long Beach both have robust educational systems. However, Long Beach has a higher population and therefore more schools, including several universities. Additionally, Long Beach Unified School District is renowned for its high-quality education system.
School enrollment
Type Long Beach El Monte
Nursery, preschool 3,330 (3.1%) 838 (3%)
Kindergarten 5,130 (4.8%) 1,067 (3.8%)
Grade 1 to 4 20,647 (19.3%) 6,028 (21.2%)
Grade 5 to 8 20,797 (19.4%) 5,923 (20.9%)
Grade 9 to 12 19,650 (18.3%) 6,878 (24.2%)
College undergrad 29,958 (27.9%) 6,800 (24%)
Graduate or professional 7,707 (7.2%) 845 (3%)
Students in private schools - absolute values
Type Count
Grade Long BeachEl Monte
Grades 1 to 8 (elementary and middle school) 3,638 187
Grades 9 to 12 (high school) 1,393 258
Undergraduate colleges 3,750 771
Students in private schools - percentage
Type Percentage
Grade Long BeachEl Monte
Grades 1 to 8 (elementary and middle school) 8.8% 1.6%
Grades 9 to 12 (high school) 7.1% 3.8%
Undergraduate colleges 12.5% 11.3%
Educational attainment
Type Long Beach El Monte
Less than high school 16.4% 35.8%
High school or equiv. 18.5% 28.5%
Less than 1 year of college 5.2% 5.4%
1 or more years of college 15.5% 11.5%
Associate degree 7.4% 4.7%
Bachelor's degree 23.9% 10.8%
Master's degree 9.5% 2.1%
Profess. school degree 1.9% 0.6%
Doctorate degree 1.7% 0.5%
Education level (25-year-olds and older)
Type Long Beach El Monte
Bachelor's degree or higher 37% 14%
Graduate or professional degree 13.1% 3.2%
High school or higher 83.6% 64.2%

Work and Economy

Long Beach's economy is diverse, majorly supported by industries such as healthcare, aerospace, and trade due to the presence of Port of Long Beach. El Monte's economy is smaller but growing, with industries in healthcare, retail, education, and manufacturing playing key roles.

Biggest Employers

In Long Beach, some of the biggest employers are the Long Beach Unified School District, Boeing, and the City of Long Beach. In El Monte, the major employers are the Mountain View School District, the El Monte Union High School District, and the City of El Monte.
Employment and residency - absolute values
Kind Long BeachEl Monte
Work and live in this city 61,685 7,975
Work and live in this county 190,126 41,737
Workers who work outside the city they live in 399,837 107,990
Workers who work outside the county they live in 34,274 3,696
Working at home 44,800 3,688
Not working at home 179,600 41,745
Employment and residency - percentage
Kind Long BeachEl Monte
Work and live in this city 33.4% 20.3%
Work and live in this county 84.7% 91.9%
Workers who work outside the city they live in 66.6% 79.7%
Workers who work outside the county they live in 15.3% 8.1%
Working at home 20.0% 8.1%
Not working at home 80.0% 91.9%
Geographical mobility: all
Type all
Mobility Long BeachEl Monte
Same house 1 year ago 89.0% 93.8%
Moved from abroad 0.4% 0.1%
Moved within same county 6.8% 5.4%
Moved from different state 1.6% 0.2%
Moved within same state 2.3% 0.4%
Geographical mobility: Asian
Type Asian
Mobility Long BeachEl Monte
Same house 1 year ago 90.6% 94.8%
Moved from abroad 0.3% 0.2%
Moved within same county 4.6% 4.2%
Moved from different state 1.7% 0.4%
Moved within same state 2.8% 0.8%
Geographical mobility: Black
Type Black
Mobility Long BeachEl Monte
Same house 1 year ago 88.1% 78.1%
Moved from abroad 0.2% 0%
Moved within same county 5.9% 18.4%
Moved from different state 3.5% 1.0%
Moved within same state 2.3% 1.1%
Geographical mobility: White
Type White
Mobility Long BeachEl Monte
Same house 1 year ago 87.6% 89.4%
Moved from abroad 0.7% 0.1%
Moved within same county 6.8% 8.7%
Moved from different state 2.0% 0.7%
Moved within same state 2.9% 0.7%
Building permits
Type Average valueCount
City Long BeachEl MonteLong BeachEl Monte
1997 $134,500 $109,200 55 50
1998 $163,700 $112,300 161 50
1999 $182,500 $73,300 81 69
2000 $190,100 $118,200 114 92
2001 $225,700 $101,100 91 232
2002 $202,400 $123,000 107 186
2003 $210,000 $133,200 67 105
2004 $208,300 $133,500 84 221
2005 $201,900 $87,500 85 317
2006 $197,100 $107,700 129 211
2007 $264,900 $90,100 60 99
2008 $341,100 $172,500 31 33
2009 $238,500 $47,100 14 178
2010 $203,700 $236,800 44 9
2011 $209,100 $180,200 66 32
2012 $264,500 $213,900 23 19
2013 $248,600 $250,000 20 42
2014 $234,600 $218,500 25 43
2015 $230,900 $248,800 20 39
2016 $371,900 $177,000 22 76
2017 $215,300 $218,500 104 23
2018 $198,100 $248,700 128 39
2019 $169,400 $238,700 100 35
2020 $62,600 $232,300 174 31
2021 $72,800 $234,400 304 36

There were 304 building permits issued in Long Beach in 2012 (238 more than in 2011) compared to 36 building permits issued in El Monte in 2012 (4 more than in 2011).

Weather

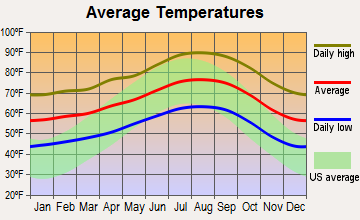
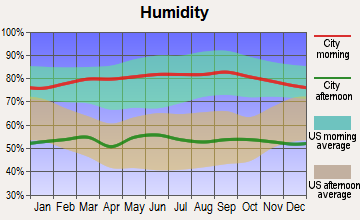
Both cities experience a Mediterranean climate with plenty of sunshine throughout the year. However, Long Beach enjoys a more coastal climate due to its location next to the Pacific Ocean, leading to milder temperatures overall compared to the more inland El Monte.
Weather and climate
Type Long Beach El Monte
Temperature - Average 65.3°F 66.3°F
Humidity - Average morning or afternoon humidity 70.4% 62.3%
Humidity - Differences between morning and afternoon humidity 27% 17.4%
Humidity - Maximum monthly morning or afternoon humidity 79% 67.2%
Humidity - Minimum monthly morning or afternoon humidity 52% 49.8%
Precipitation - Yearly average 13.1 in 16.4 in
Snowfall - Yearly average 0 in 0 in
Clouds - Number of days clear of clouds 26.4% 29.3%
Sunshine amount - Average 78.4% 78.4%
Sunshine amount - Differences during a year 22% 22%
Sunshine amount - Maximum monthly 85% 85%
Sunshine amount - Minimum monthly 63% 63%
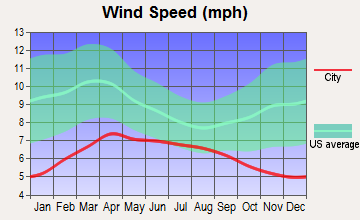
Wind speed - Average 6.1 mph 2.7 mph

Average climate in Long Beach, California

Chicago, Illinois average temperatures Chicago, Illinois average precipitation Chicago, Illinois humidity Chicago, Illinois wind speed Chicago, Illinois snowfall Chicago, Illinois sunshine Chicago, Illinois clear and cloudy days
 

Average climate in El Monte, California

Chicago, Illinois average temperatures Chicago, Illinois average precipitation Chicago, Illinois humidity Chicago, Illinois wind speed Chicago, Illinois snowfall Chicago, Illinois sunshine Chicago, Illinois clear and cloudy days
 

Air pollution
Type AQICONO2OZONEPBPM10PM25SO2
Year Long BeachEl MonteLong BeachEl MonteLong BeachEl MonteLong BeachEl MonteLong BeachEl MonteLong BeachEl MonteLong BeachEl MonteLong BeachEl Monte
2018 124 142 0.37 0.37 17.2 14.1 22.1 28.0 0.008 0.007 27.5 28.4 13.5 14.1 0.7 0.4
2017 122 146 0.36 0.37 18.1 15.0 23.2 29.2 0.007 0.007 26.7 30.9 14.5 14.2 0.8 0.5
2016 115 136 0.36 0.34 18.5 15.4 21.9 27.8 0.007 0.007 24.1 28.1 11.6 13.2 0.9 0.4
2015 111 144 0.38 0.34 19.9 15.2 22.5 28.2 0.005 0.006 25.0 28.1 13.9 15.3 0.9 0.3
2014 127 141 0.50 0.37 20.3 16.5 22.0 27.7 0.007 0.007 26.7 30.8 14.3 15.3 1.3 0.4
2013 126 144 0.48 0.40 20.0 17.2 24.7 26.3 0.005 0.007 32.3 29.3 14.6 14.7 1.0 0.4
2012 132 148 0.48 0.43 19.3 18.1 24.4 25.8 0.004 0.006 30.8 28.6 14.1 16.6 0.6 0.5
2011 119 146 0.43 0.46 20.2 18.8 23.4 24.8 0.006 0.008 28.4 29.0 15.6 17.5 1.2 0.5
2010 115 133 0.38 0.48 20.8 19.1 22.7 24.4 0.011 0.013 24.1 27.2 11.9 15.5 0.7 0.5
2009 132 153 0.50 0.41 21.0 20.9 22.0 25.3 0.008 0.010 27.7 32.3 13.1 17.2 1.1 0.6
2008 124 155 0.53 0.53 20.8 23.0 23.2 24.7 0.008 0.013 27.2 32.6 21.6 17.1 1.0 0.7
2007 109 135 0.60 0.55 20.3 24.3 21.1 23.1 0.010 0.015 N/A N/A N/A N/A 1.4 1.2
2006 119 129 0.76 0.58 21.4 24.6 19.9 23.0 0.005 0.009 N/A N/A N/A N/A 1.7 1.6
2005 108 128 0.74 0.60 24.3 25.8 20.5 21.1 0.011 0.014 N/A N/A N/A N/A 2.7 2.3
2004 125 135 0.56 0.70 28.0 27.1 22.9 22.8 0.012 0.017 N/A N/A N/A N/A 2.0 2.4
2003 130 143 0.83 0.88 28.1 31.7 22.4 22.3 0.032 0.025 N/A N/A N/A N/A 1.1 1.6
2002 120 137 0.90 0.90 29.6 32.7 22.2 20.8 0.011 0.022 N/A N/A N/A N/A 2.8 2.3
2001 124 143 0.81 1.03 30.3 33.5 21.5 19.0 0.011 0.033 N/A N/A N/A N/A 3.3 2.4
2000 142 151 0.71 1.06 31.5 34.3 19.6 19.2 0.018 0.029 N/A N/A N/A N/A 2.0 1.3
Natural disasters
Type Long Beach El Monte
Tornado activity compared to U.S. average 18.3% 18.3%
Earthquake activity compared to U.S. average 6,875.1% 7,229.8%
Natural disasters compared to U.S. average 57% 57%

Transportation

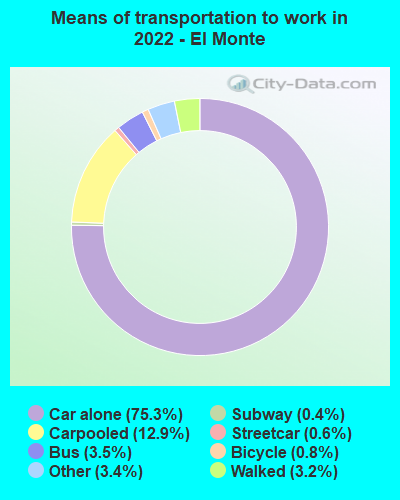
Public transportation and commuting are convenient in both cities. Long Beach has a more extensive transit system, including buses, light rail, and ferries. El Monte operates primarily bus services and has direct connections to downtown LA.
Transport
Type Long Beach El Monte
Amtrak stations 1 0
Amtrak stations nearby 3 3
FAA registered aircraft 312 34
FAA registered aircraft manufacturers and dealers 29 0
Means of transportation to work
Type Long Beach El Monte
Bicycle 0.5% 1.3%
Bus 3.3% 3%
Carpooled 9.8% 11.5%
Car alone 81.8% 79.6%
Motorcycle 0.2% 0.1%
Streetcar 0.1% 0.4%
Subway 0.5% 0.3%
Taxicab 0% 0.3%
Walked 2.8% 2%
Means of transportation to work
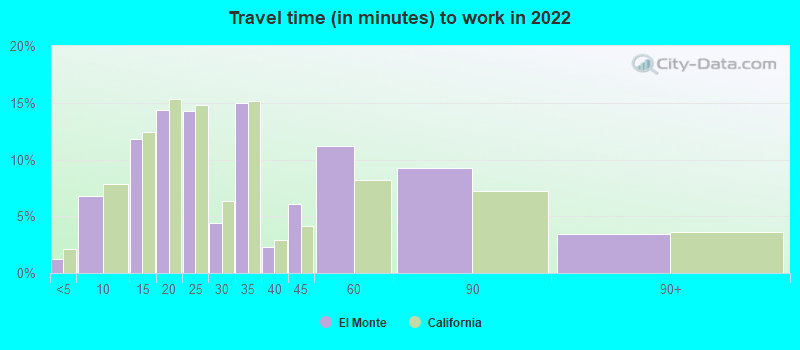
Average travel time to work
Type Long Beach El Monte
Average 30.7 min 29.6 min
Other means 28.5 min 26.8 min
Public transportation 46.4 min 45.5 min
Travel time to work
Time leaving to work
Travel time to work
Time leaving to work
Private vehicle occupancy
Type Long Beach El Monte
Average 1.1 1.3
Drove alone 89.7% 81.2%
In 2 person carpool 8.5% 13.3%
In 3 person carpool 1.4% 4.2%
In 4 person carpool 0.3% 1%
In 5-6 person carpool 0% 0.2%

How many people usually rode to work in the car, truck or van.

Real Estate

Real estate in Long Beach is more expensive compared to El Monte, reflecting the city’s coastal lifestyle and amenities. On the other hand, El Monte offers more affordable housing options but with more commute for work or attractions.

Neighborhoods

Long Beach is known for its diverse and vibrant neighborhoods like Belmont Shore and Naples. El Monte, though smaller, boasts historic neighborhoods like Norwood Village and is known for its strong community bonds.
Houses and residents
Type Long Beach El Monte
Houses 179,856 29,935
Average household size (people) 2.8 4
Median year apartment built 1964 1969
Median year house/condo built 1954 1962
Length of stay in the house since moving in 15.7 years 17.9 years
Houses occupied 172,599 (96%) 29,036 (97%)
Houses occupied by owners 69,470 (40.2%) 10,998 (37.9%)
Houses occupied by renters 103,129 (59.8%) 18,038 (62.1%)
Median rent asked for vacant for-rent units $1,057 $1,418
Median monthly housing costs $1,692 $1,450
Median price asked for vacant for-sale houses and condos $520,992 $520,221
Estimated median house or condo value $693,600 $566,600
Median numbers of rooms 4.2 4.4
Median number of rooms in apartments 3.6 4
Median number of rooms in houses and condos 5.5 5.2
Median house price - detached houses $900,658 $761,978
Median house price - in 5 or more unit structures $488,399 $643,944
Median house price - mobile homes $333,777 $67,476
Median house price - Townhouses or other attached units $634,684 $532,476
Median house price - All housing units $805,766 $669,761
Median house age 62 54
Renting percentage 58.4% 57.8%
Housing density (houses/condos per square mile) 3,565.7 3,133.7
House value disparities 21.3% 21.6%
Household income disparities 44.7% 42.9%
Median household income for houses/condes with a mortgage $116,421 $87,271
Median household income for apartments without a mortgage $79,392 $64,628
Housing units without a mortgage 394 (0.8%) 370 (5.4%)
Housing units with both a second mortgage and home equity loan 3,069 (6.2%) 94 (1.4%)
Housing units with a mortgage 49,321 (99.2%) 6,442 (94.6%)
Housing units with a home equity loan 48 (0.1%) 122 (1.8%)
Housing units with a second mortgage 3,709 (7.5%) 416 (6.1%)
House/condo owner moved in on average (years ago) 15 17
House/condo renter moved in on average (years ago) 3 7
Housing units lacking complete kitchen facilities 2.6% 2.9%
Housing units lacking complete plumbing facilities 0.4% 1.4%
Housing units in structures
Housing units in structures Long BeachEl Monte
One, detached 40.2% 51.5%
One, attached 4.9% 12.0%
Two 5.3% 4.3%
3 or 4 8.8% 3.9%
5 to 9 10.4% 5.6%
10 to 19 10.8% 5.4%
20 to 49 8.0% 6.2%
50 or more 10.6% 5.4%
Mobile homes 0.8% 5.6%
Boats, RVs, vans, etc. 0.2% 0.0%
Median real estate property taxes paid for housing units
Type Long Beach El Monte
With mortgages $5,222 (0.8%) $4,815 (0.8%)
With no mortgages $3,496 (0.5%) $4,371 (0.8%)
Marital status
Type Long Beach El Monte
Divorced 8% 6.1%
Never married 46.9% 43.7%
Now married 38.5% 42.7%
Separated 1.9% 3.1%
Widowed 4.7% 4.5%
Class of workers - percentage
Class of Workers Long BeachEl Monte
Employee of private company 67.5% 69.3%
Private not-for-profit wage and salary workers 9.1% 5.5%
Local government workers 8.5% 8.2%
Self-employed workers in own not incorporated business 8.0% 8.3%
State government workers 2.8% 2.8%
Self-employed in own incorporated business 2.4% 3.8%
Federal government workers 1.6% 2.0%
Unpaid family workers 0.1% 0.1%
Class of workers - absolute values
Class of Workers Long BeachEl Monte
Employee of private company 156,053 32,482
Federal government workers 3,620 929
Local government workers 19,737 3,822
Private not-for-profit wage and salary workers 20,943 2,580
Self-employed in own incorporated business 5,524 1,798
Self-employed workers in own not incorporated business 18,532 3,900
State government workers 6,550 1,314
Unpaid family workers 178 60

Industries and Occupations

In Long Beach, the top occupations are related to healthcare, education, and cargo due to its bustling port. El Monte, on the other hand, has more jobs in retail, manufacturing, and healthcare.
Most common male industries
Industry Long BeachEl Monte
Retail trade 12.8% 11.6%
Professional, scientific, and technical services 11.7% 2.2%
Manufacturing 10.7% 18.1%
Transportation and warehousing 10.4% 13.1%
Construction 8.9% 13.4%
Health care and social assistance 7.7% 4.1%
Accommodation and food services 6.4% 6.7%
Educational services 6.0% 3.5%
Administrative and support and waste management services 4.6% 9.4%
Other services, except public administration 4.3% 4.9%
Wholesale trade 3.3% 6.3%
Information 2.8% 0.7%
Public administration 2.7% 2.5%
Arts, entertainment, and recreation 2.5% 0.7%
Finance and insurance 2.3% 1.2%
Real estate and rental and leasing 1.6% 0.5%
Utilities 0.8% 0.0%
Agriculture, forestry, fishing and hunting 0.2% 1.0%
Management of companies and enterprises 0.1% 0.0%
Mining, quarrying, and oil and gas extraction 0.1% 0.0%
Most common female industries
Industry Long BeachEl Monte
Health care and social assistance 23.2% 20.5%
Retail trade 12.0% 11.0%
Educational services 11.8% 13.0%
Professional, scientific, and technical services 7.6% 2.6%
Accommodation and food services 6.9% 6.3%
Manufacturing 5.5% 9.0%
Other services, except public administration 5.3% 7.7%
Transportation and warehousing 5.0% 4.9%
Administrative and support and waste management services 4.4% 3.9%
Public administration 3.9% 5.0%
Finance and insurance 3.6% 4.3%
Real estate and rental and leasing 2.4% 1.0%
Arts, entertainment, and recreation 2.1% 2.1%
Information 2.0% 3.7%
Wholesale trade 1.8% 3.7%
Construction 1.5% 1.1%
Utilities 0.7% 0.0%
Agriculture, forestry, fishing and hunting 0.4% 0.3%
Most common male occupations
Occupation Long BeachEl Monte
Management occupations 10.6% 5.3%
Sales and related occupations 10.2% 7.0%
Office and administrative support occupations 7.3% 7.5%
Transportation occupations 7.0% 7.9%
Production occupations 6.7% 10.0%
Material moving occupations 6.2% 12.1%
Business and financial operations occupations 5.5% 3.4%
Construction and extraction occupations 5.3% 11.1%
Arts, design, entertainment, sports, and media occupations 4.9% 2.1%
Building and grounds cleaning and maintenance occupations 4.7% 7.7%
Food preparation and serving related occupations 4.6% 5.6%
Computer and mathematical occupations 4.2% 1.3%
Architecture and engineering occupations 4.0% 0.1%
Installation, maintenance, and repair occupations 3.9% 4.7%
Educational instruction, and library occupations 3.6% 1.7%
Health diagnosing and treating practitioners and other technical occupations 2.4% 1.1%
Healthcare support occupations 1.9% 1.6%
Firefighting and prevention, and other protective service workers including supervisors 1.5% 3.5%
Legal occupations 1.3% 0.4%
Health technologists and technicians 1.2% 1.2%
Most common female occupations
Occupation Long BeachEl Monte
Office and administrative support occupations 18.3% 21.5%
Sales and related occupations 10.5% 7.5%
Management occupations 9.3% 9.2%
Business and financial operations occupations 7.4% 4.1%
Educational instruction, and library occupations 7.0% 5.7%
Healthcare support occupations 6.5% 7.9%
Food preparation and serving related occupations 5.2% 5.3%
Health diagnosing and treating practitioners and other technical occupations 4.9% 3.8%
Community and social service occupations 4.4% 2.2%
Personal care and service occupations 3.6% 6.8%
Arts, design, entertainment, sports, and media occupations 3.0% 2.4%
Building and grounds cleaning and maintenance occupations 2.9% 6.5%
Health technologists and technicians 2.8% 3.0%
Material moving occupations 2.8% 3.1%
Production occupations 2.7% 6.0%
Computer and mathematical occupations 1.9% 1.7%
Transportation occupations 1.4% 1.3%
Life, physical, and social science occupations 1.3% 0.2%
Legal occupations 1.3% 0.1%

Health Care

Both cities have access to quality healthcare facilities. Long Beach, home to numerous specialty clinics and the Long Beach Memorial Medical Center, offers a breadth of healthcare facilities. El Monte also offers sound healthcare services via the Greater El Monte Community Hospital and other local clinics.

Fatal vehicle accidents per 100,000 residents
Type Total count per 100,000Drunk per 100,000Fatal count per 100,000Pedestrian count per 100,000Person count per 100,000Vehicle count per 100,000
Year Long BeachEl MonteLong BeachEl MonteLong BeachEl MonteLong BeachEl MonteLong BeachEl MonteLong BeachEl Monte
2021 7.0 4.7 0.0 0.0 7.2 4.7 4.8 2.8 11.4 17.8 9.9 13.1
2020 6.2 5.5 1.1 0.9 6.5 5.5 4.3 1.8 10.8 11.9 10.8 7.3
2019 7.9 0.9 1.5 0.0 8.3 0.9 5.5 0.9 14.2 0.9 12.2 0.9
2018 6.9 2.6 2.2 0.0 7.3 2.6 2.2 0.0 15.6 7.9 12.1 5.3
2017 5.6 0.9 0.9 0.0 5.8 0.9 1.9 0.9 11.4 0.9 8.6 0.9
2016 7.7 4.3 1.7 0.9 7.9 4.3 3.6 2.6 14.5 13.0 11.3 8.7
2015 6.2 3.5 1.9 0.0 6.8 3.5 3.0 2.6 11.5 6.1 8.9 4.3
2014 4.9 5.1 1.1 0.9 4.9 5.1 1.7 1.7 10.8 12.0 8.0 7.7
2013 5.8 6.9 1.3 1.7 6.0 6.9 2.1 1.7 13.8 10.4 11.5 8.6
2012 7.7 0.0 2.4 0.0 8.5 0.0 3.8 0.0 15.0 0.0 12.2 0.0
2011 5.6 1.8 1.1 0.0 5.8 1.8 1.7 0.9 13.5 2.6 8.8 1.8
2010 5.6 0.9 2.2 0.0 6.3 1.8 2.4 1.8 11.9 0.9 8.4 0.9
2009 6.1 6.6 1.5 3.3 6.3 6.6 2.4 2.5 12.3 16.5 9.5 11.5
2008 5.7 6.6 2.2 2.5 6.1 6.6 2.0 4.1 14.8 14.1 9.3 8.3
2007 8.5 8.3 3.7 3.3 8.7 10.0 3.7 1.7 20.4 23.2 12.0 16.6
2006 7.5 5.8 2.6 2.5 8.0 5.8 2.2 3.3 19.4 19.0 12.9 9.1
2005 6.4 2.5 1.9 0.0 7.1 2.5 1.7 0.8 20.5 9.9 11.1 4.1
2004 7.0 3.3 3.4 0.8 7.4 3.3 2.1 1.7 17.2 6.6 9.8 4.1
2003 7.6 3.3 3.6 3.3 8.1 3.3 1.9 0.8 21.4 15.0 11.9 5.0
2002 4.7 3.4 1.7 0.8 4.7 3.4 2.8 1.7 12.6 6.8 6.6 5.9
2001 4.7 4.3 2.2 2.6 4.7 4.3 3.2 0.9 12.3 14.5 6.7 6.0
2000 7.4 1.7 3.0 0.0 7.4 1.7 2.4 0.9 19.1 6.9 10.8 2.6
1999 5.5 8.0 2.3 8.0 6.4 8.0 1.8 4.4 19.3 19.5 9.9 9.7
1998 4.9 5.4 1.4 1.8 5.1 6.3 2.3 1.8 12.5 14.4 7.4 9.0
1997 7.5 4.6 3.5 0.0 8.6 4.6 2.3 2.7 23.4 17.3 11.2 6.4
1996 8.2 6.4 2.1 1.8 8.5 6.4 5.9 6.4 25.4 22.1 12.0 9.2
1995 7.5 9.3 1.6 2.8 7.7 9.3 4.2 3.7 21.3 25.9 10.5 11.1
1994 7.6 7.4 3.0 0.0 8.3 7.4 3.7 2.8 24.3 19.4 12.7 13.0
1993 7.6 12.0 3.0 1.8 9.2 12.0 2.5 6.5 22.2 31.4 13.4 15.7
1992 10.1 10.2 3.9 6.5 10.6 10.2 3.7 3.7 27.1 26.0 14.7 14.0
1991 13.1 12.2 5.5 6.6 13.6 12.2 4.4 4.7 36.0 31.1 21.0 16.0
1990 13.5 8.5 5.3 2.8 14.6 9.4 0.0 0.0 33.7 21.6 19.0 12.2
1989 14.4 12.6 6.6 3.9 14.9 12.6 0.0 0.0 38.1 34.8 21.1 18.4
1988 12.3 16.9 4.3 4.0 13.2 18.8 0.0 0.0 32.2 49.6 17.8 20.8
1987 15.6 11.2 6.8 4.1 16.1 12.2 0.0 0.0 38.6 26.5 22.2 14.3
1986 13.4 5.2 6.0 3.1 13.7 6.3 0.0 0.0 36.0 8.4 18.6 6.3
1985 14.4 10.8 4.6 4.3 15.4 14.0 0.0 0.0 37.4 25.8 21.2 10.8
1984 11.6 14.4 6.2 5.5 11.6 17.7 0.0 0.0 32.7 38.8 17.8 17.7
1983 13.9 4.6 6.0 2.3 14.9 4.6 0.0 0.0 37.4 11.4 20.2 6.9
1982 12.8 4.7 6.1 4.7 13.1 5.9 0.0 0.0 31.5 5.9 16.8 4.7
1981 17.4 6.1 7.6 2.4 18.5 6.1 0.0 0.0 39.4 13.4 23.4 7.3
1980 16.6 22.6 6.9 7.5 18.0 22.6 0.0 0.0 35.4 45.3 23.0 25.2
1979 20.2 12.7 10.0 8.9 20.8 15.3 0.0 0.0 47.3 30.6 29.3 17.8
1978 18.6 9.0 2.2 5.2 19.4 10.3 0.0 0.0 36.8 25.8 24.7 12.9
1977 19.1 15.7 6.9 9.1 19.7 19.6 0.0 0.0 47.1 50.9 26.1 24.8
1976 14.4 10.6 5.5 0.0 15.0 10.6 0.0 0.0 29.4 18.5 20.8 10.6
1975 14.4 10.7 5.6 0.0 15.0 10.7 0.0 0.0 29.4 18.7 20.8 10.7

Fatal vehicle accidents
Type Total countDrunkFatal countPedestrian countPerson countVehicle count
Year Long BeachEl MonteLong BeachEl MonteLong BeachEl MonteLong BeachEl MonteLong BeachEl MonteLong BeachEl Monte
1975 52 8 20 0 54 8 0 0 106 14 75 8
1976 52 8 20 0 54 8 0 0 106 14 75 8
1977 69 12 25 7 71 15 0 0 170 39 94 19
1978 67 7 8 4 70 8 0 0 133 20 89 10
1979 73 10 36 7 75 12 0 0 171 24 106 14
1980 60 18 25 6 65 18 0 0 128 36 83 20
1981 64 5 28 2 68 5 0 0 145 11 86 6
1982 48 4 23 4 49 5 0 0 118 5 63 4
1983 53 4 23 2 57 4 0 0 143 10 77 6
1984 45 13 24 5 45 16 0 0 127 35 69 16
1985 57 10 18 4 61 13 0 0 148 24 84 10
1986 54 5 24 3 55 6 0 0 145 8 75 6
1987 64 11 28 4 66 12 0 0 158 26 91 14
1988 51 17 18 4 55 19 0 0 134 50 74 21
1989 61 13 28 4 63 13 0 0 161 36 89 19
1990 58 9 23 3 63 10 0 0 145 23 82 13
1991 57 13 24 7 59 13 19 5 156 33 91 17
1992 44 11 17 7 46 11 16 4 118 28 64 15
1993 33 13 13 2 40 13 11 7 96 34 58 17
1994 33 8 13 0 36 8 16 3 105 21 55 14
1995 32 10 7 3 33 10 18 4 91 28 45 12
1996 35 7 9 2 36 7 25 7 108 24 51 10
1997 32 5 15 0 37 5 10 3 100 19 48 7
1998 21 6 6 2 22 7 10 2 54 16 32 10
1999 24 9 10 9 28 9 8 5 84 22 43 11
2000 34 2 14 0 34 2 11 1 88 8 50 3
2001 22 5 10 3 22 5 15 1 57 17 31 7
2002 22 4 8 1 22 4 13 2 59 8 31 7
2003 36 4 17 4 38 4 9 1 101 18 56 6
2004 33 4 16 1 35 4 10 2 81 8 46 5
2005 30 3 9 0 33 3 8 1 96 12 52 5
2006 35 7 12 3 37 7 10 4 90 23 60 11
2007 39 10 17 4 40 12 17 2 94 28 55 20
2008 26 8 10 3 28 8 9 5 68 17 43 10
2009 28 8 7 4 29 8 11 3 57 20 44 14
2010 26 1 10 0 29 2 11 2 55 1 39 1
2011 26 2 5 0 27 2 8 1 63 3 41 2
2012 36 0 11 0 40 0 18 0 70 0 57 0
2013 27 8 6 2 28 8 10 2 65 12 54 10
2014 23 6 5 1 23 6 8 2 51 14 38 9
2015 29 4 9 0 32 4 14 3 54 7 42 5
2016 36 5 8 1 37 5 17 3 68 15 53 10
2017 26 1 4 0 27 1 9 1 53 1 40 1
2018 32 3 10 0 34 3 10 0 72 9 56 6
2019 36 1 7 0 38 1 25 1 65 1 56 1
2020 29 6 5 1 30 6 20 2 50 13 50 8
2021 32 5 0 0 33 5 22 3 52 19 45 14
Police full-time law enforcement employees
Year Long BeachEl Monte
2021 1,023 152
2020 1,174 157
2019 1,203 160
2018 1,164 162
2017 1,180 164
2016 1,173 152
2015 1,123 148
2014 1,105 154
2013 1,117 157
2012 1,131 161
2011 1,193 168
2010 1,252 172
2009 1,328 174
2008 1,361 214
2007 1,377 224
2006 1,363 228
2005 1,344 227
2004 1,355 226
2003 1,438 208
Police full-time law enforcement employees (per 1,000 residents)
Year Long BeachEl Monte
2021 2.3 1.4
2020 2.5 1.4
2019 2.6 1.4
2018 2.5 1.4
2017 2.5 1.4
2016 2.5 1.3
2015 2.4 1.3
2014 2.3 1.3
2013 2.4 1.4
2012 2.4 1.4
2011 2.6 1.5
2010 2.7 1.5
2009 2.9 1.4
2008 2.9 1.7
2007 2.9 1.8
2006 2.9 1.8
2005 2.8 1.8
2004 2.8 1.8
2003 3.0 1.7
Local government: full-time employees
Job Long BeachEl Monte
Airports 99 0
Financial administration 139 15
Firefighters 389 0
Fire - other 89 0
Gas supply 180 0
Health 304 0
Judicial and legal 98 0
Local libraries 75 0
Other and unallocable 834 0
Other government administration 143 14
Parks and recreation 193 13
Police - other 261 42
Police protection - officers 786 118
Sewerage 30 0
Solid waste management 115 0
Streets and highways 101 43
Totals for government 5,289 284
Transit 694 6
Water supply 197 10
Water transport and terminals 490 0
Local government: part-time employees
Job Long BeachEl Monte
Airports 5 0
Financial administration 10 1
Fire - other 43 0
Gas supply 6 0
Health 40 0
Judicial and legal 8 0
Local libraries 93 0
Other and unallocable 46 0
Other government administration 41 15
Parks and recreation 425 85
Police - other 80 7
Sewerage 3 0
Solid waste management 9 0
Streets and highways 3 16
Totals for government 877 139
Transit 34 13
Water supply 8 0
Water transport and terminals 23 0
Place of birth - Foreign born
Residents Long BeachEl Monte
All residents 24.2% 46.8%
American Indian / Alaska Native residents 27.0% 51.6%
Asian residents 58.4% 75.2%
Black or African American residents 2.2% 7.1%
Native Hawaiian / Pacific Islander residents 0.0% 34.7%
Other race residents 37.2% 44.9%
Two or more races residents 20.3% 37.9%
White residents 13.8% 8.6%
White alone, not Hispanic / Latino residents 7.5% 6.0%
Place of birth - Native, outside of US
Residents Long BeachEl Monte
All residents 1.6% 1.3%
American Indian / Alaska Native residents 1.2% 0.0%
Asian residents 2.3% 2.5%
Black or African American residents 1.3% 0.0%
Native Hawaiian / Pacific Islander residents 16.3% 36.3%
Other race residents 1.2% 0.6%
Two or more races residents 2.4% 0.9%
White residents 0.8% 3.8%
White alone, not Hispanic / Latino residents 1.0% 1.9%
Place of birth - Born in state of residence
Residents Long BeachEl Monte
All residents 58.6% 49.4%
American Indian / Alaska Native residents 65.2% 47.8%
Asian residents 33.7% 21.3%
Black or African American residents 73.5% 82.1%
Native Hawaiian / Pacific Islander residents 59.0% 27.6%
Other race residents 58.4% 53.0%
Two or more races residents 67.3% 58.3%
White residents 61.2% 76.7%
White alone, not Hispanic / Latino residents 60.3% 70.3%
Place of birth - Born in other state
Residents Long BeachEl Monte
All residents 15.5% 2.5%
American Indian / Alaska Native residents 6.6% 0.6%
Asian residents 5.6% 1.0%
Black or African American residents 23.0% 10.8%
Native Hawaiian / Pacific Islander residents 24.7% 1.4%
Other race residents 3.1% 1.5%
Two or more races residents 9.9% 3.0%
White residents 24.3% 10.8%
White alone, not Hispanic / Latino residents 31.2% 21.8%
English speakers (speaking English at home)
Type Long Beach El Monte
Born in the United States residents 88.7% 56.4%
Foreign born residents 9.9% 3.8%
Native, born elsewhere residents 51.9% 27.8%
Total residents 54% 16.9%

Infrastructure

Long Beach boasts of more developed infrastructure, with the Port of Long Beach being a significant infrastructural asset. El Monte also has good infrastructure including the El Monte Station, the largest bus-only transit station serving the San Gabriel and Pomona Valleys.
Infrastructure
Type Long Beach El Monte
Hospitals 17 1
TV stations 5 26
Bank branches located here 67 13
Bank institutions located here 18 8
Drinking water stations with no reported violations in the past 2 0
Drinking water stations with reported violations in the past 1 1

Schools

School facilities
Type Long Beach El Monte
Private elementary/middle schools 24 3
Private high schools 8 0
Public elementary/middle schools 61 25
Public high schools 14 5
Colleges/Universities 7 3
HMDA - Conventional home purchase loans - Applications denied
Year Long BeachEl Monte
1999 1,159 154
2000 710 58
2001 677 32
2002 708 60
2003 1,861 282
2004 2,162 353
2005 3,065 363
2006 3,591 516
2007 2,287 290
2008 887 105
2009 475 83

Culture and Food

Both cities offer diverse cultural experiences. Long Beach, however, stands out with its lively arts scene, music festivals, and international food culture. El Monte, while smaller, boasts a rich historic culture and a great food scene influenced by its large Hispanic population.

Sports Teams

Long Beach is home to several minor league teams and hosts a variety of sporting events like the annual Long Beach Grand Prix. El Monte doesn't host any major sports teams.