Nestled in the heart of Southern California, Long Beach and East Los Angeles offer unique living experiences, each with their distinct character. Long Beach, famed for its waterfront attractions, coupled with a diverse culture gives a city-like feel while East Los Angeles, a predominantly residential area, promises a more laid-back lifestyle. We delve into comparisons between these two Southern California hotspots, examining details about crime, weather, cost of living, education, economy, and more, to give you a comprehensive understanding of what to expect from both spaces.
Distance between
Long Beach, CA and
East Los Angeles, CA : 15.7 miles
Long Beach's population is larger by 294%. Its population has decreased by 5,460 people (1.2%) since 2000. The population of East Los Angeles has decreased by 8,480 people (6.8%) during that time.
Long Beach has considerably lower crime rates than East Los Angeles, offering residents and tourists better safety prospects. Although it's crucial to note that crime rates can fluctuate between neighborhoods within the city. The presence of community initiatives such as Neighborhood Watch Programs also contribute to making Long Beach a safer place. East Los Angeles, on the other hand, experiences higher levels of crime, particularly in terms of violent and drug-related incidents.
Cost of Living
The cost of living in Long Beach is higher than in East Los Angeles. This is reflected in higher housing costs, whether renting or buying. Other living costs, such as groceries, transportation, and healthcare are also higher in Long Beach compared to East Los Angeles, which remains one of the more affordable areas in Los Angeles County.
Income Tax
For both cities, the state income tax imposed by California ranges from 1% to 13.3% based on income brackets, making it amongst the highest in the nation. Neither city imposes an additional local income tax.
Property Tax
The average property tax rate for both cities is 0.793% of assessed home value, relatively low compared to other US states. However, Long Beach homeowners tend to pay more due to more expensive property values.
Sales Tax
Both cities are subject to the general state sales tax rate of 7.25%. However, with added local taxes, the total sales tax rate in Long Beach is 10.25%, slightly higher than East Los Angeles's 9.5%.
Income
Type
Long Beach
East Los Angeles
Estimated median household income
$73,905
$65,971
Estimated per capita income
$37,217
$21,820
Cost of living index (U.S. average is 100)
142
140.8
If you make $50,000 in East Los Angeles, you will have to make $50,426 in Long Beach to maintain the same standard of living.
Geographical Conditions
Geographically, Long Beach offers coastal beauty, with vistas of the Pacific Ocean and an extensive coastline. East LA is more landlocked and urban, but with proximity to green spaces like the Whittier Narrows Nature Center.
Both cities offer a variety of educational opportunities, but Long Beach stands out due to a higher ranking for its public schools and the presence of California State University Long Beach. East Los Angeles is home to many public and charter schools, along with East Los Angeles College.
Long Beach has a diverse economy with a strong presence in healthcare, aerospace, and professional services. In contrast, East Los Angeles is primarily residential with most of its working residents commuting to jobs in other LA areas. The unemployment rate is typically higher in East Los Angeles than in Long Beach.
Biggest Employers
In Long Beach, big employers include healthcare giants like Long Beach Memorial Medical Center and Molina Healthcare, and aerospace entity, Boeing. East Los Angeles doesn't host many large employers, but residents often work in nearby areas that house companies like USC and the County of LA.
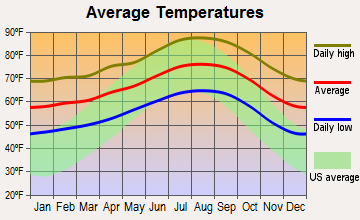
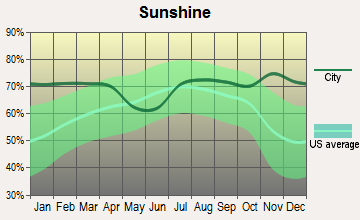
The weather in both Long Beach and East Los Angeles is typically Southern Californian – pleasant and mild. They both enjoy a Mediterranean-like climate with plenty of sunshine throughout the year. However, Long Beach, being a coastal city, offers cooler temperatures and sea breezes, making it more attractive during summer.
Weather and climate
Type
Long Beach
East Los Angeles
Temperature - Average
65.3°F
66.6°F
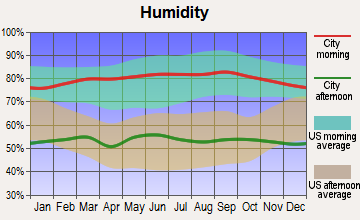
Humidity - Average morning or afternoon humidity
70.4%
61%
Humidity - Differences between morning and afternoon humidity
27%
16.2%
Humidity - Maximum monthly morning or afternoon humidity
79%
65.3%
Humidity - Minimum monthly morning or afternoon humidity
52%
49.1%
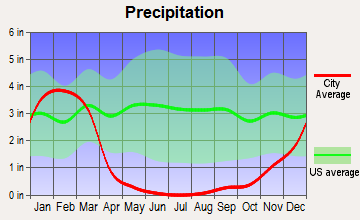
Precipitation - Yearly average
13.1 in
15.6 in
Snowfall - Yearly average
0 in
0 in
Clouds - Number of days clear of clouds
26.4%
30.4%
Sunshine amount - Average
78.4%
78.4%
Sunshine amount - Differences during a year
22%
22%
Sunshine amount - Maximum monthly
85%
85%
Sunshine amount - Minimum monthly
63%
63%
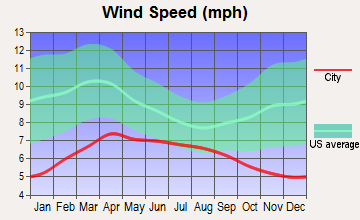
Wind speed - Average
6.1 mph
2.1 mph
Average climate in Long Beach, California
Average climate in East Los Angeles, California
Air pollution
Type
AQI
CO
NO2
OZONE
PB
PM10
PM25
SO2
Year
Long Beach
East Los Angeles
Long Beach
East Los Angeles
Long Beach
East Los Angeles
Long Beach
East Los Angeles
Long Beach
East Los Angeles
Long Beach
East Los Angeles
Long Beach
East Los Angeles
Long Beach
East Los Angeles
2018
124
142
0.37
0.41
17.2
14.1
22.1
25.4
0.008
0.008
27.5
27.4
13.5
15.6
0.7
0.4
2017
122
143
0.36
0.44
18.1
15.0
23.2
26.4
0.007
0.007
26.7
29.7
14.5
15.8
0.8
0.4
2016
115
129
0.36
0.41
18.5
14.9
21.9
25.7
0.007
0.007
24.1
27.2
11.6
14.9
0.9
0.3
2015
111
138
0.38
0.43
19.9
15.3
22.5
26.7
0.005
0.005
25.0
27.2
13.9
16.9
0.9
0.2
2014
127
138
0.50
0.46
20.3
16.0
22.0
26.1
0.007
0.007
26.7
29.2
14.3
19.0
1.3
0.3
2013
126
142
0.48
0.48
20.0
17.3
24.7
24.3
0.005
0.007
32.3
28.2
14.6
17.8
1.0
0.4
2012
132
145
0.48
0.49
19.3
17.5
24.4
24.1
0.004
0.007
30.8
27.5
14.1
18.7
0.6
0.5
2011
119
143
0.43
0.50
20.2
18.8
23.4
22.8
0.006
0.009
28.4
30.8
15.6
17.8
1.2
0.4
2010
115
131
0.38
0.52
20.8
19.0
22.7
21.8
0.011
0.023
24.1
31.7
11.9
16.7
0.7
0.4
2009
132
151
0.50
0.50
21.0
21.2
22.0
22.5
0.008
0.012
27.7
42.7
13.1
18.2
1.1
0.5
2008
124
154
0.53
0.46
20.8
24.1
23.2
21.7
0.008
0.014
27.2
41.8
21.6
18.7
1.0
0.6
2007
109
130
0.60
0.52
20.3
24.3
21.1
21.0
0.010
0.018
N/A
N/A
N/A
N/A
1.4
1.1
2006
119
125
0.76
0.58
21.4
24.8
19.9
21.4
0.005
0.010
N/A
N/A
N/A
N/A
1.7
1.8
2005
108
128
0.74
0.64
24.3
25.7
20.5
20.2
0.011
0.016
N/A
N/A
N/A
N/A
2.7
2.0
2004
125
138
0.56
0.74
28.0
27.6
22.9
23.0
0.012
0.020
N/A
N/A
N/A
N/A
2.0
2.4
2003
130
144
0.83
0.93
28.1
30.9
22.4
21.0
0.032
0.028
N/A
N/A
N/A
N/A
1.1
1.9
2002
120
143
0.90
1.02
29.6
33.0
22.2
21.6
0.011
0.025
N/A
N/A
N/A
N/A
2.8
2.4
2001
124
143
0.81
1.15
30.3
35.4
21.5
18.7
0.011
0.041
N/A
N/A
N/A
N/A
3.3
2.3
2000
142
147
0.71
1.09
31.5
34.0
19.6
17.7
0.018
0.034
N/A
N/A
N/A
N/A
2.0
1.4
Natural disasters
Type
Long Beach
East Los Angeles
Tornado activity compared to U.S. average
18.3%
17.9%
Earthquake activity compared to U.S. average
6,875.1%
7,124.7%
Natural disasters compared to U.S. average
57%
57%
Transportation
Both cities have reliable public transit systems. Long Beach Transit serves the entire city, and Metro Rail connects East LA with downtown LA. Long Beach, with its bike-friendly streets, also provides an appealing alternative mode of transportation.
Transport
Type
Long Beach
East Los Angeles
Amtrak stations
1
0
Amtrak stations nearby
3
3
FAA registered aircraft
312
0
FAA registered aircraft manufacturers and dealers
29
0
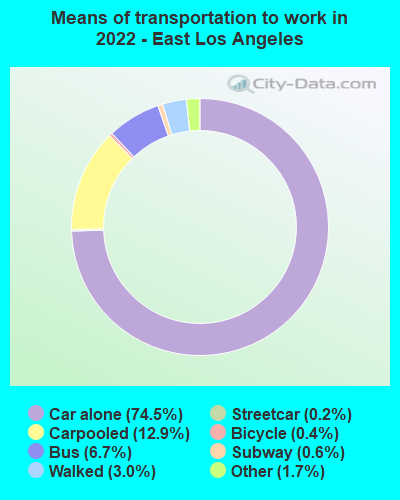
Means of transportation to work
Type
Long Beach
East Los Angeles
Bicycle
0.5%
0.6%
Bus
3.3%
4.4%
Carpooled
9.8%
13.3%
Car alone
81.8%
75.8%
Motorcycle
0.2%
0%
Streetcar
0.1%
0.3%
Subway
0.5%
0.4%
Walked
2.8%
2.8%
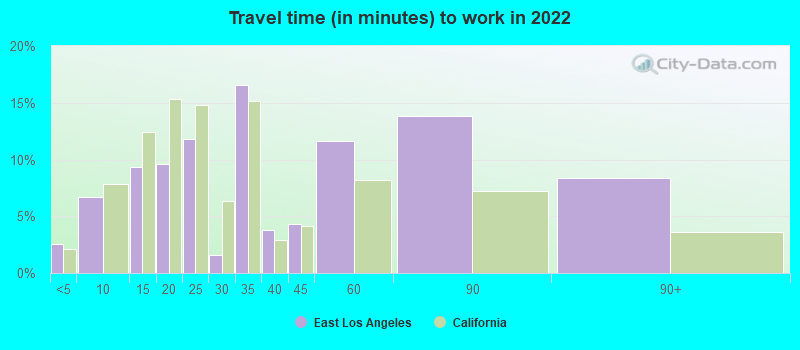
Average travel time to work
Type
Long Beach
East Los Angeles
Average
30.7 min
36.1 min
Other means
28.5 min
26.2 min
Public transportation
46.4 min
45.5 min
Private vehicle occupancy
Type
Long Beach
East Los Angeles
Average
1.1
1.3
Drove alone
89.7%
79.1%
In 2 person carpool
8.5%
15.8%
In 3 person carpool
1.4%
3.7%
In 4 person carpool
0.3%
0.8%
In 5-6 person carpool
0%
0.6%
How many people usually rode to work in the car, truck or van.
Real Estate
Real estate in Long Beach is considerably more expensive than in East Los Angeles due to its beachfront location. Property types range from bungalows to contemporary apartments. East LA features more affordable homes including single-family residences and small apartments, making it a better choice for budget-conscious buyers and renters.
Neighborhoods
Finding the right neighborhood between these two cities significantly comes down to personal preference. Long Beach offers neighborhoods like Belmont Shore, buzzing with activity and Naples, known for its Italian-inspired canals. East LA is famous for its tight-knit communities, like City Terrace.
Houses and residents
Type
Long Beach
East Los Angeles
Houses
179,856
33,124
Average household size (people)
2.8
4.1
Median year apartment built
1964
1958
Median year house/condo built
1954
1946
Length of stay in the house since moving in
15.7 years
20.5 years
Houses occupied
172,599 (96%)
31,072 (93.8%)
Houses occupied by owners
69,470 (40.2%)
9,953 (32%)
Houses occupied by renters
103,129 (59.8%)
21,119 (68%)
Median rent asked for vacant for-rent units
$1,057
$1,359
Median monthly housing costs
$1,692
$1,313
Median price asked for vacant for-sale houses and condos
$520,992
$1,683,130
Estimated median house or condo value
$693,600
$592,100
Median numbers of rooms
4.2
4.2
Median number of rooms in apartments
3.6
3.9
Median number of rooms in houses and condos
5.5
5.1
Median house price - detached houses
$900,658
$521,296
Median house price - in 2-unit structures
$823,515
$409,715
Median house price - in 3-to-4-unit structures
$495,928
$523,623
Median house price - in 5 or more unit structures
$488,399
$532,168
Median house price - mobile homes
$333,777
$367,354
Median house price - Townhouses or other attached units
$634,684
$532,071
Median house price - All housing units
$805,766
$518,582
Median house age
62
68
Renting percentage
58.4%
64.4%
Housing density (houses/condos per square mile)
3,565.7
4,450.2
House value disparities
21.3%
17.4%
Household income disparities
44.7%
40.5%
Median household income for houses/condes with a mortgage
$116,421
$94,860
Median household income for apartments without a mortgage
$79,392
$69,231
Housing units without a mortgage
394 (0.8%)
129 (2.3%)
Housing units with both a second mortgage and home equity loan
3,069 (6.2%)
276 (5%)
Housing units with a mortgage
49,321 (99.2%)
5,365 (97.7%)
Housing units with a home equity loan
48 (0.1%)
76 (1.4%)
Housing units with a second mortgage
3,709 (7.5%)
604 (11%)
House/condo owner moved in on average (years ago)
15
23
House/condo renter moved in on average (years ago)
3
9
Housing units lacking complete kitchen facilities
2.6%
4.3%
Housing units lacking complete plumbing facilities
0.4%
0.3%
Housing units in structures
Housing units in structures
Long Beach
East Los Angeles
One, detached
40.2%
53.0%
One, attached
4.9%
21.5%
Two
5.3%
4.9%
3 or 4
8.8%
8.5%
5 to 9
10.4%
6.3%
10 to 19
10.8%
2.0%
20 to 49
8.0%
1.6%
50 or more
10.6%
1.1%
Mobile homes
0.8%
0.9%
Boats, RVs, vans, etc.
0.2%
0.1%
Median real estate property taxes paid for housing units
Self-employed workers in own not incorporated business
18,532
4,362
State government workers
6,550
1,105
Unpaid family workers
178
134
Industries and Occupations
Long Beach is known for its diversified economy, supported by industries like healthcare, aerospace, trade, and tourism. East LA's economy isn’t as robust, with many residents working in service, sales, and administrative support roles.
Health diagnosing and treating practitioners and other technical occupations
4.9%
1.1%
Community and social service occupations
4.4%
3.2%
Personal care and service occupations
3.6%
4.5%
Arts, design, entertainment, sports, and media occupations
3.0%
1.4%
Building and grounds cleaning and maintenance occupations
2.9%
9.2%
Health technologists and technicians
2.8%
3.2%
Material moving occupations
2.8%
4.5%
Production occupations
2.7%
8.1%
Computer and mathematical occupations
1.9%
0.1%
Transportation occupations
1.4%
0.2%
Life, physical, and social science occupations
1.3%
1.1%
Legal occupations
1.3%
0.1%
Health Care
Healthcare in Long Beach is outstanding, with top-rated hospitals like Long Beach Memorial. East Los Angeles also offers reliable healthcare but individuals often travel to neighboring regions for more specialized care.
Long Beach boasts a robust and well-maintained infrastructure including the Port of Long Beach, the second busiest container port in the US. East Los Angeles, while mainly residential, boasts a solid infrastructure with key highways and available amenities due to its proximity to downtown LA.
HMDA - Conventional home purchase loans - Applications denied
Year
Long Beach
East Los Angeles
1999
1,159
95
2000
710
77
2001
677
76
2002
708
110
2003
1,861
303
2004
2,162
424
2005
3,065
460
2006
3,591
606
2007
2,287
409
2008
887
105
2009
475
55
Culture and Food
Culturally, Long Beach is diverse, rich in arts and hosts several events throughout the year, including the Long Beach Jazz Festival. The foodie scene is eclectic, enjoying a vibrant mix of culinary offerings. East Los Angeles, due to its predominantly Hispanic population, boasts an abundant presence of genuine, family-owned Mexican eateries and a vibrant Latin American cultural scene.
Sports Teams
While neither city hosts a major sports team, they both enjoy proximity to the LA area which is home to many, including the Lakers (NBA), Rams (NFL), and Dodgers (MLB). Long Beach, however, has a thriving local sports scene and host to major events like the Long Beach Grand Prix.
 Long Beach, CA
 East Los Angeles, CA