Las Vegas, NV and West Contra Costa, CA both have unique aspects that make them attractive places to live or visit. This comparison takes into account various factors important to residents and tourists, including crime and safety, weather, cost of living, education, work and economy, and more. Each city offers its own appeal, whether it's the bustling entertainment industry of Las Vegas or the quieter, more relaxed lifestyle of West Contra Costa.
Like many large cities, Las Vegas does have a higher crime rate compared to the national average. However, the crime rates can vary depending on the specific neighborhood. On the other hand, West Contra Costa, CA, with its smaller population, generally sees lower crime rates. Both cities have well-staffed police departments that work diligently to maintain safety for their residents and visitors.
Cost of Living
The overall cost of living in Las Vegas typically is lower than that in West Contra Costa. Housing is usually more affordable in Las Vegas; in addition, Nevada has no state income tax, which can help reduce costs. West Contra Costa, located in the San Francisco Bay area, has a high cost of living, due in large part to high housing costs.
Income Tax
Nevada residents enjoy the benefit of having no state income tax. On the contrary, California imposes one of the highest state income taxes in the country.
Property Tax
Nevada's average property tax rate is relatively low, while California's property tax is moderate when compared to other states. However, the high real estate values in West Contra Costa can end up leading to significant property tax bills.
Sales Tax
Nevada's sales tax rate is 8.265%, which is high compared to other states. The sales tax rate for West Contra Costa in California is 8.25%.
Income
Type
Las Vegas
West Contra Costa
Estimated median household income
$59,746
$87,268
Estimated per capita income
$33,825
$39,820
Cost of living index (U.S. average is 100)
99.1
131
If you make $50,000 in Las Vegas, you will have to make $66,095 in West Contra Costa to maintain the same standard of living.
Geographical Conditions
Las Vegas is located in a desert valley surrounded by mountains, while West Contra Costa, located in the San Francisco Bay area, offers hills, flatlands, and access to the ocean.
Geographical information
Type
Las Vegas
West Contra Costa
Land area
113.3 sq. miles
68.1 sq. miles
Population density
5,708.4 people per sq. mile
3,673.6 people per sq. mile
Relative area comparison
Las Vegas, NV West Contra Costa, CA
Education
Both Las Vegas and West Contra Costa have a wide range of educational opportunities. Las Vegas offers numerous public and private schools and is home to higher education institutions such as the University of Nevada, Las Vegas. West Contra Costa has its own unified school district and is in close proximity to renowned universities such as UC Berkeley.
Las Vegas thrives on tourism, hospitality, and entertainment, but it also has a burgeoning tech industry. West Contra Costa, as part of the greater Bay Area, enjoys a diverse economy with sectors in tech, healthcare, and education. Job growth has been steady and positive in both cities.
Biggest Employers
The biggest employers in Las Vegas are typically in the hospitality and gaming industry, with MGM Resorts International and Caesars Entertainment among the top. In West Contra Costa, the largest employers include Chevron, West Contra Costa Unified School District, and Kaiser Permanente.
In Las Vegas (Clark County), 56.4% voted for Democrats and 41.8% for Republicans in 2012 Presidential Election. In West Contra Costa (Contra Costa County), 66.2% voted for Democrats and 31.1% for Republicans.
Elections
Type
Democrats
Republicans
Other
Year
Las Vegas
West Contra Costa
Las Vegas
West Contra Costa
Las Vegas
West Contra Costa
2020
53.7%
71.8%
44.3%
26.4%
2.0%
1.8%
2016
52.4%
67.5%
41.7%
24.5%
5.8%
8.0%
2012
56.4%
66.2%
41.8%
31.1%
1.8%
2.7%
2008
58.5%
68.0%
39.5%
30.2%
2.0%
1.8%
2004
51.8%
62.6%
46.9%
36.7%
1.3%
0.7%
2000
51.4%
59.0%
44.8%
37.2%
3.8%
3.8%
1996
75.5%
55.7%
18.8%
35.2%
5.7%
9.1%
Breakdown of population affiliated with a religious congregation
Type
Adherents
Congregations
Religion
Las Vegas
West Contra Costa
Las Vegas
West Contra Costa
CATHOLIC CHURCH
18.1%
21.8%
4.0%
5.2%
SOUTHERN BAPTIST CONVENTION
1.6%
1.3%
11.2%
10.0%
EVANGELICAL LUTHERAN CHURCH IN AMERICA
0.4%
0.5%
1.6%
2.0%
SEVENTH DAY ADVENTIST CHURCH
0.2%
0.3%
1.6%
1.5%
EPISCOPAL CHURCH
0.1%
0.5%
1.1%
2.3%
MUSLIM ESTIMATE
0.1%
1.0%
0.6%
1.4%
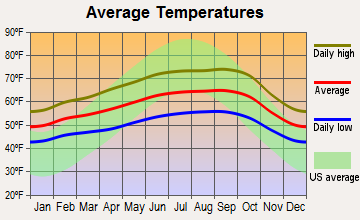
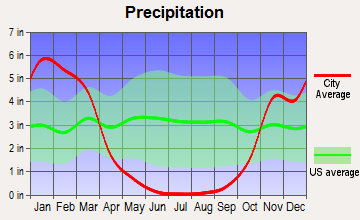
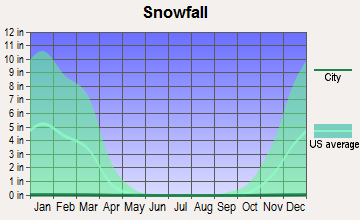
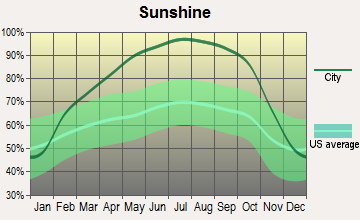
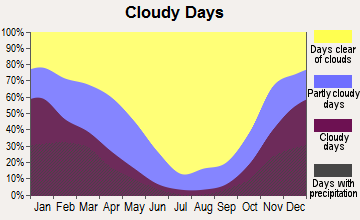
Weather
Las Vegas is located in a desert, which results in very hot summers and mild winters. The city is quite sunny, getting more than 300 days of sunshine per year. West Contra Costa, nearby the Pacific Ocean, experiences more temperate weather. Summers are mild and winters are cool, with greater humidity and more rainfall compared to Las Vegas.
Weather and climate
Type
Las Vegas
West Contra Costa
Temperature - Average
65.5°F
58.3°F
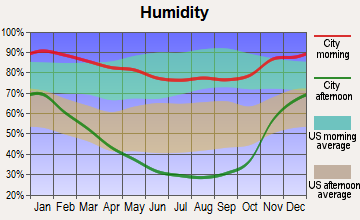
Humidity - Average morning or afternoon humidity
30.7%
84.1%
Humidity - Differences between morning and afternoon humidity
42%
29%
Humidity - Maximum monthly morning or afternoon humidity
52%
90.8%
Humidity - Minimum monthly morning or afternoon humidity
10%
61.7%
Precipitation - Yearly average
5.7 in
28.6 in
Snowfall - Yearly average
1.6 in
0 in
Clouds - Number of days clear of clouds
35.1%
27.1%
Sunshine amount - Average
91.8%
73%
Sunshine amount - Differences during a year
16%
22.1%
Sunshine amount - Maximum monthly
92%
77%
Sunshine amount - Minimum monthly
76%
55%
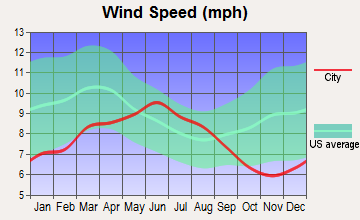
Wind speed - Average
9.2 mph
11.4 mph
Average climate in Las Vegas, Nevada
Average climate in West Contra Costa, California
Air pollution
Type
AQI
CO
NO2
OZONE
PB
PM10
PM25
SO2
Year
Las Vegas
West Contra Costa
Las Vegas
West Contra Costa
Las Vegas
West Contra Costa
Las Vegas
West Contra Costa
West Contra Costa
Las Vegas
Las Vegas
West Contra Costa
Las Vegas
West Contra Costa
2018
100
105
0.42
0.42
13.1
8.7
37.2
24.4
0.012
N/A
24.4
N/A
6.0
12.9
0.7
0.5
2017
101
104
0.29
0.37
13.0
9.2
38.5
23.1
0.008
N/A
20.3
N/A
7.3
10.7
0.8
0.7
2016
97
76
0.38
0.36
11.2
8.6
36.5
22.8
0.005
N/A
20.6
N/A
8.7
8.1
0.8
0.8
2015
92
91
0.36
0.45
12.4
9.5
35.6
23.6
0.004
N/A
18.9
N/A
8.4
9.1
1.2
0.8
2014
91
86
0.40
0.42
10.8
9.4
36.5
22.3
0.005
N/A
21.1
N/A
9.2
10.4
1.4
0.9
2013
103
87
0.45
0.33
9.6
10.6
36.9
22.1
0.004
N/A
22.1
N/A
8.6
11.8
1.5
0.5
2012
94
90
0.49
0.33
5.9
9.6
38.5
24.1
0.003
N/A
21.5
N/A
8.3
8.2
1.4
1.9
2011
85
94
0.40
0.34
5.3
10.3
37.5
22.7
0.003
N/A
18.2
N/A
7.8
10.0
1.2
3.1
2010
86
90
0.50
0.33
5.7
11.2
36.6
21.9
0.015
N/A
16.1
N/A
7.1
9.1
N/A
1.3
2009
87
99
0.56
0.27
6.0
12.2
33.3
19.9
0.006
N/A
20.9
N/A
8.3
10.4
N/A
0.9
2008
82
110
0.66
0.23
8.2
12.0
33.0
22.7
0.006
N/A
N/A
N/A
9.2
12.7
N/A
1.1
2007
97
99
0.61
0.38
11.7
12.0
32.4
22.1
0.006
N/A
N/A
N/A
8.6
10.6
0.1
1.2
2006
102
104
0.75
0.43
13.4
12.7
32.7
21.4
N/A
N/A
N/A
N/A
8.3
11.0
0.8
1.6
2005
100
94
0.76
0.37
15.1
12.0
30.2
20.4
N/A
N/A
N/A
N/A
7.8
10.3
5.3
1.7
2004
85
105
0.71
0.59
16.0
13.1
30.6
20.7
0.004
N/A
N/A
N/A
N/A
12.0
1.6
1.6
2003
99
79
0.67
0.50
15.9
13.5
29.8
22.0
N/A
N/A
N/A
N/A
N/A
N/A
1.0
1.5
2002
94
81
0.73
0.47
15.7
13.8
30.6
22.6
0.008
N/A
N/A
N/A
N/A
N/A
0.7
1.2
2001
95
83
0.76
0.41
15.0
13.9
29.4
21.5
0.008
N/A
N/A
N/A
N/A
N/A
1.1
1.3
2000
95
76
0.88
0.48
14.7
14.0
29.7
19.9
0.013
N/A
N/A
N/A
N/A
N/A
0.4
2.0
Natural disasters
Type
Las Vegas
West Contra Costa
Tornado activity compared to U.S. average
2.1%
8.4%
Earthquake activity compared to U.S. average
6,093.4%
7,617.7%
Natural disasters compared to U.S. average
12%
18%
Transportation
Las Vegas provides a range of public transportation options including buses and monorail system. West Contra Costa has extensive bus lines and Bay Area Rapid Transit (BART) stations for access to other Bay Area cities. Both cities are supported by well-maintained road systems for commuters.
Transport
Type
Las Vegas
West Contra Costa
Amtrak stations
1
0
Amtrak stations nearby
1
3
FAA registered aircraft
1
0
FAA registered aircraft manufacturers and dealers
81
0
Means of transportation to work
Type
Las Vegas
West Contra Costa
Bicycle
0.1%
0.7%
Bus
2.2%
4.1%
Carpooled
10.3%
18.6%
Car alone
82.7%
63%
Motorcycle
0.4%
0.2%
Railroad
0%
0.4%
Streetcar
0%
0.1%
Subway
0%
7%
Taxicab
0%
0.2%
Walked
1.4%
1.5%
Average travel time to work
Type
Las Vegas
West Contra Costa
Average
26.3 min
35 min
Real Estate
Real estate in Las Vegas offers a lower median home price compared to the national average and has a variety of housing options to fit different needs. West Contra Costa, being part of the pricey Bay Area, has higher real estate costs, but this also can lead to more significant property value appreciation.
Neighborhoods
Las Vegas has a mix of suburban and urban neighborhoods, with the world-famous Strip attracting tourists. West Contra Costa, comprising several cities, has varied neighborhoods - from industrial areas to suburban pockets - offering more laid-back California living.
Houses and residents
Type
Las Vegas
West Contra Costa
Houses
269,602
86,004
Average household size (people)
2.7
2.8
Houses occupied
250,350 (92.9%)
83,291 (96.8%)
Houses occupied by owners
138,677 (55.4%)
50,448 (60.6%)
Houses occupied by renters
111,673 (44.6%)
32,843 (39.4%)
Median rent asked for vacant for-rent units
$1,176
$1,781
Median price asked for vacant for-sale houses and condos
$989,410
$1,269,474
Estimated median house or condo value
$362,400
$597,522
Median number of rooms in apartments
4.1
4.3
Median number of rooms in houses and condos
6.1
5.4
Renting percentage
43.5%
40.9%
Housing density (houses/condos per square mile)
2,379.4
1,262.7
Household income disparities
47.1%
46.4%
Housing units without a mortgage
1,172 (1.2%)
11,194 (24.8%)
Housing units with both a second mortgage and home equity loan
4,450 (4.6%)
155 (0.3%)
Housing units with a mortgage
95,992 (98.8%)
34,015 (75.2%)
Housing units with a home equity loan
178 (0.2%)
3,361 (7.4%)
Housing units with a second mortgage
5,092 (5.2%)
4,664 (10.3%)
Housing units lacking complete kitchen facilities
1.3%
0.8%
Housing units lacking complete plumbing facilities
Self-employed workers in own not incorporated business
18,990
8,123
State government workers
6,950
5,849
Unpaid family workers
614
314
Industries and Occupations
Las Vegas is globally known for its hospitality and entertainment industry, but healthcare, retail, and education are also leading employers. West Contra Costa hosts a variety of industries including educational services, health care, manufacturing, and retail.
Both Las Vegas and West Contra Costa offer excellent healthcare facilities. Las Vegas has numerous reputed hospitals, while West Contra Costa residents have access to the acclaimed UCSF Medical Center and Stanford Health Care among others.
Health (county statistics)
Type
Las Vegas
West Contra Costa
General health status score of residents in this county from 1 (poor) to 5 (excellent)
Las Vegas has a robust infrastructure catering to both residents and millions of tourists each year. West Contra Costa also has a good infrastructure that supports its residential settings and industrial areas, providing access to San Francisco and other major cities in the Bay Area.
Infrastructure
Type
Las Vegas
West Contra Costa
TV stations
12
22
Culture and Food
Las Vegas is a cultural melting pot, known for its nightlife, entertainment, and diverse food scene. West Contra Costa also offers cultural diversity and is known for local eateries offering a variety of international cuisine.
Sports Teams
Las Vegas has recently welcomed major sports teams with the Raiders (NFL) and Golden Knights (NHL). West Contra Costa residents support Bay Area teams like the San Francisco 49ers (NFL), Golden State Warriors (NBA), and the Oakland Athletics (MLB).
 Las Vegas, NV
 West Contra Costa, CA