Two iconic and exciting southwest U.S. cities, Las Vegas, NV and Riverside, CA, offer distinctive living and visitor experiences. For those contemplating relocating or just visiting, it's necessary to evaluate the cities in terms of crime/safety, weather, cost of living, education, economy, infrastructure, and more. Let's dive deeper into these categories for a comprehensive comparison between Las Vegas and Riverside.
Distance between
Las Vegas, NV and
Riverside, CA : 198.0 miles
Las Vegas's population is larger by 104%. Its population has grown by 168,356 people (35.2%) since 2000. The population of Riverside has grown by 62,095 people (24.3%) during that time.
Both Las Vegas and Riverside have crime rates higher than the US average, although the rate in Las Vegas is significantly higher. However, it is noteworthy that the majority of crimes in Las Vegas are property-related, as thefts associated with the booming tourist industry are common. Conversely, Riverside has more concern with violent crimes compared to property crimes. Both cities have been taking significant steps to improve safety, with increased police presence and community initiatives.
City-data.com crime index counts serious crimes and violent crime more heavily. It adjusts for the number of visitors and daily workers commuting into cities. (higher means more crime, U.S. average = 301.1)
City-data.com crime index counts serious crimes and violent crime more heavily. It adjusts for the number of visitors and daily workers commuting into cities. (higher means more crime, U.S. average = 301.1)
Sex Offenders
According to our data, there are 4,821 registered sex offenders living in Las Vegas and 648 registered sex offenders living in . The ratio of residents to sex offenders in Las Vegas is 131 to 1; the ratio in Riverside is 501 to 1. The number of registered sex offenders compared to the number of residents is much larger in Las Vegas than that in Riverside.
Cost of Living
Living costs in both cities are quite distinct, mainly due to varying state tax policies and real-estate costs. Las Vegas boasts a lower cost of living, mainly driven by lower housing costs, and Nevada's advantageous tax policies, including no state income tax. Contrarily, Riverside, like most Californian cities, has a higher cost of living, particularly when it comes to housing and taxes.
Income Tax
Unlike California, Nevada does not impose a state income tax, which may make Las Vegas more appealing to some.
Property Tax
Property taxes in Las Vegas are relatively low, with a rate of 0.64% compared to Riverside's 0.77%. This can make owning a home in Las Vegas more affordable than in Riverside.
Sales Tax
Nevada's statewide sales tax of 6.85%, with potential county add-ons, is lower than California's 7.25% base rate plus local surcharges, making Vegas a more sales-tax friendly city.
Income
Type
Las Vegas
Riverside
Estimated median household income
$59,746
$76,558
Estimated per capita income
$33,825
$29,013
Cost of living index (U.S. average is 100)
99.1
83
If you make $50,000 in Riverside, you will have to make $59,699 in Las Vegas to maintain the same standard of living.
Geographical Conditions
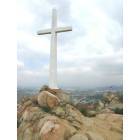
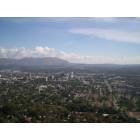
Las Vegas, situated in a valley surrounded by mountain ranges, is in proximity to breathtaking natural sites like the Grand Canyon. Conversely, Riverside is nestled in the Inland Empire and provides plenty of outdoor recreation opportunities, with its close proximity to mountains, beaches, and desert.
While both cities have varied educational opportunities, Riverside has a slight edge, housing the University of California, Riverside and several reputable colleges. Las Vegas, despite having the University of Nevada, Las Vegas and a few colleges, grapples with the reputation of Nevada's public-school education system, ranked as one of the lowest in the nation.
Las Vegas and Riverside house diverse economies. The former, widely known for hospitality and entertainment, recently has been diversifying into industries like technology and logistics. Conversely, Riverside's economy is based on education, healthcare, manufacturing, and retail. Unemployment rates are relatively comparable in both cities.
Biggest Employers
The biggest employers in Las Vegas are the casino-resorts like the MGM Grand and Caesar's Palace, and the Clark County School District. The University of California system, Riverside County, and Riverside Community Hospital are Riverside's leading employers.
There were 2,700 building permits issued in Las Vegas in 2012 (1886 more than in 2011) compared to 293 building permits issued in Riverside in 2012 (250 more than in 2011).
In Las Vegas (Clark County), 56.4% voted for Democrats and 41.8% for Republicans in 2012 Presidential Election. In Riverside (Riverside County), 49.6% voted for Democrats and 48.0% for Republicans.
Elections
Type
Democrats
Republicans
Other
Year
Las Vegas
Riverside
Las Vegas
Riverside
Las Vegas
Riverside
2020
53.7%
53.0%
44.3%
45.0%
2.0%
2.0%
2016
52.4%
49.7%
41.7%
44.4%
5.8%
5.9%
2012
56.4%
49.6%
41.8%
48.0%
1.8%
2.4%
2008
58.5%
50.4%
39.5%
48.1%
2.0%
1.5%
2004
51.8%
41.3%
46.9%
58.2%
1.3%
0.6%
2000
51.4%
45.0%
44.8%
51.6%
3.8%
3.4%
1996
75.5%
43.0%
18.8%
45.6%
5.7%
11.3%
Breakdown of population affiliated with a religious congregation
Type
Adherents
Congregations
Religion
Las Vegas
Riverside
Las Vegas
Riverside
CATHOLIC CHURCH
18.1%
27.5%
4.0%
4.5%
SOUTHERN BAPTIST CONVENTION
1.6%
1.2%
11.2%
11.2%
EVANGELICAL LUTHERAN CHURCH IN AMERICA
0.4%
0.3%
1.6%
1.5%
SEVENTH DAY ADVENTIST CHURCH
0.2%
0.9%
1.6%
3.4%
MUSLIM ESTIMATE
0.1%
0.5%
0.6%
0.7%
Weather
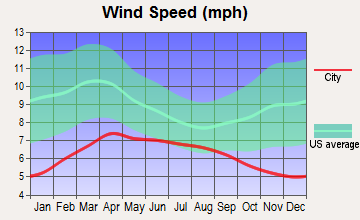
Las Vegas, situated in the Mojave Desert, has hot desert climate with consistent sunshine, low humidity, and scarce precipitation. Expect high temperatures exceeding 100°F in the summer. In contrast, Riverside enjoys a Mediterranean climate with hot, dry summers and mild, wet winters. Temperature fluctuations are less extreme in Riverside than in Las Vegas.
Weather and climate
Type
Las Vegas
Riverside
Temperature - Average
65.5°F
66°F
Humidity - Average morning or afternoon humidity
30.7%
66.7%
Humidity - Differences between morning and afternoon humidity
42%
21.4%
Humidity - Maximum monthly morning or afternoon humidity
52%
73.5%
Humidity - Minimum monthly morning or afternoon humidity
10%
52.1%
Precipitation - Yearly average
5.7 in
10.3 in
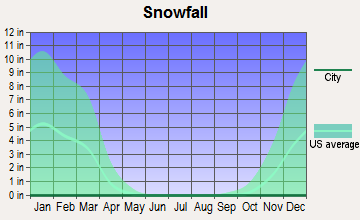
Snowfall - Yearly average
1.6 in
0 in
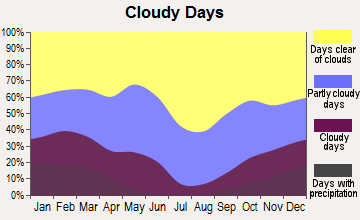
Clouds - Number of days clear of clouds
35.1%
27.3%
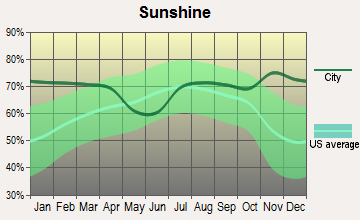
Sunshine amount - Average
91.8%
78.2%
Sunshine amount - Differences during a year
16%
21.5%
Sunshine amount - Maximum monthly
92%
84.2%
Sunshine amount - Minimum monthly
76%
62.6%
Wind speed - Average
9.2 mph
4.5 mph
Average climate in Las Vegas, Nevada
Average climate in Riverside, California
Air pollution
Type
AQI
CO
NO2
OZONE
PB
PM10
PM25
SO2
Year
Las Vegas
Riverside
Las Vegas
Riverside
Las Vegas
Riverside
Las Vegas
Riverside
Riverside
Las Vegas
Riverside
Las Vegas
Riverside
Las Vegas
Riverside
2018
100
153
0.42
0.35
13.1
14.4
37.2
29.8
0.006
N/A
24.4
44.6
6.0
13.6
0.7
0.4
2017
101
151
0.29
0.34
13.0
14.7
38.5
31.5
0.004
N/A
20.3
48.4
7.3
14.8
0.8
0.3
2016
97
140
0.38
0.33
11.2
14.8
36.5
30.9
0.006
N/A
20.6
44.4
8.7
14.5
0.8
0.2
2015
92
147
0.36
0.33
12.4
14.5
35.6
30.8
0.004
N/A
18.9
43.6
8.4
15.4
1.2
0.3
2014
91
147
0.40
0.37
10.8
15.9
36.5
30.7
0.006
N/A
21.1
34.1
9.2
16.5
1.4
0.3
2013
103
147
0.45
0.38
9.6
16.4
36.9
29.2
0.006
N/A
22.1
33.2
8.6
16.4
1.5
0.2
2012
94
148
0.49
0.35
5.9
16.4
38.5
30.2
0.007
N/A
21.5
32.3
8.3
16.0
1.4
0.3
2011
85
150
0.40
0.37
5.3
16.3
37.5
32.0
0.006
N/A
18.2
33.1
7.8
15.2
1.2
0.3
2010
86
144
0.50
0.42
5.7
17.8
36.6
30.9
0.008
N/A
16.1
31.9
7.1
15.5
N/A
1.3
2009
87
151
0.56
0.37
6.0
20.0
33.3
29.0
0.009
N/A
20.9
38.0
8.3
19.6
N/A
1.5
2008
82
157
0.66
0.41
8.2
20.5
33.0
30.0
0.010
N/A
N/A
43.6
9.2
16.3
N/A
0.9
2007
97
135
0.61
0.65
11.7
20.8
32.4
28.3
0.011
N/A
N/A
N/A
8.6
N/A
0.1
1.6
2006
102
129
0.75
0.58
13.4
21.0
32.7
28.0
0.005
N/A
N/A
N/A
8.3
N/A
0.8
1.4
2005
100
134
0.76
0.53
15.1
22.8
30.2
27.3
0.012
N/A
N/A
N/A
7.8
N/A
5.3
3.3
2004
85
142
0.71
0.72
16.0
18.5
30.6
29.5
0.013
N/A
N/A
N/A
N/A
N/A
1.6
3.1
2003
99
144
0.67
0.75
15.9
22.7
29.8
28.5
0.013
N/A
N/A
N/A
N/A
N/A
1.0
2.0
2002
94
142
0.73
0.82
15.7
24.9
30.6
28.5
0.015
N/A
N/A
N/A
N/A
N/A
0.7
0.2
2001
95
145
0.76
0.79
15.0
25.7
29.4
26.1
0.025
N/A
N/A
N/A
N/A
N/A
1.1
0.9
2000
95
157
0.88
0.82
14.7
24.2
29.7
25.0
0.031
N/A
N/A
N/A
N/A
N/A
0.4
1.2
Natural disasters
Type
Las Vegas
Riverside
Tornado activity compared to U.S. average
2.1%
17.4%
Earthquake activity compared to U.S. average
6,093.4%
7,322.6%
Natural disasters compared to U.S. average
12%
46%
Transportation
Las Vegas offers a robust public transit system with the RTC bus system, ample taxis, and rideshare options. Riverside also provides an efficient transit system with Metrolink train, RTA buses, and increasing biking infrastructure. Both cities experience standard commute times; however, Riverside residents commuting to other parts of Southern California face longer travel times.
Transport
Type
Las Vegas
Riverside
Amtrak stations
1
1
Amtrak stations nearby
1
3
FAA registered aircraft
1
307
FAA registered aircraft manufacturers and dealers
81
15
Means of transportation to work
Type
Las Vegas
Riverside
Bicycle
0.1%
0.5%
Bus
2.2%
0.9%
Carpooled
10.3%
9%
Car alone
82.7%
85.7%
Motorcycle
0.4%
0.3%
Railroad
0%
0.4%
Walked
1.4%
2.3%
Average travel time to work
Type
Las Vegas
Riverside
Average
26.3 min
31.3 min
Other means
24 min
28.7 min
Public transportation
49.9 min
45.3 min
Private vehicle occupancy
Type
Las Vegas
Riverside
Average
1.2
1.1
Drove alone
88.9%
89.1%
In 2 person carpool
8.2%
8.4%
In 3 person carpool
2.1%
2%
In 4 person carpool
0.2%
0.2%
In 5-6 person carpool
0.4%
0.2%
In 7+ person carpool
0.2%
0.1%
How many people usually rode to work in the car, truck or van.
Real Estate
Las Vegas offers comparatively more affordable home prices than Riverside. The real estate market in Riverside is highly competitive, reflecting California's overall housing market with higher prices and demand outstripping supply.
Neighborhoods
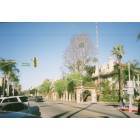
Both cities offer a variety of neighborhoods for different lifestyles. Las Vegas's Summerlin and Henderson areas are popular for families, while the downtown area appeals to young professionals. Riverside boasts historic neighborhoods like Mission Inn and Victoria, alongside suburban enclaves like Orangecrest.
Houses and residents
Type
Las Vegas
Riverside
Houses
269,602
94,246
Average household size (people)
2.7
3.2
Median year apartment built
1991
1982
Median year house/condo built
1995
1974
Length of stay in the house since moving in
10.1 years
14.2 years
Houses occupied
250,350 (92.9%)
91,110 (96.7%)
Houses occupied by owners
138,677 (55.4%)
51,211 (56.2%)
Houses occupied by renters
111,673 (44.6%)
39,899 (43.8%)
Median rent asked for vacant for-rent units
$1,176
$1,277
Median monthly housing costs
$1,255
$1,680
Median price asked for vacant for-sale houses and condos
$989,410
$414,585
Estimated median house or condo value
$362,400
$483,300
Median numbers of rooms
5.2
5.2
Median number of rooms in apartments
4.1
3.9
Median number of rooms in houses and condos
6.1
6.1
Median house price - detached houses
$439,169
$548,362
Median house price - in 2-unit structures
$161,204
$525,372
Median house price - in 3-to-4-unit structures
$201,871
$450,463
Median house price - in 5 or more unit structures
$327,174
$408,213
Median house price - mobile homes
$113,235
$81,780
Median house price - Townhouses or other attached units
$274,961
$442,670
Median house price - All housing units
$417,434
$529,360
Median house age
27
44
Renting percentage
43.5%
44.3%
Housing density (houses/condos per square mile)
2,379.4
1,206.8
House value disparities
27.1%
21%
Household income disparities
47.1%
40.5%
Median household income for houses/condes with a mortgage
$90,388
$104,161
Median household income for apartments without a mortgage
$62,287
$71,925
Housing units without a mortgage
1,172 (1.2%)
393 (1%)
Housing units with both a second mortgage and home equity loan
4,450 (4.6%)
1,312 (3.3%)
Housing units with a mortgage
95,992 (98.8%)
39,744 (99%)
Housing units with a home equity loan
178 (0.2%)
123 (0.3%)
Housing units with a second mortgage
5,092 (5.2%)
2,112 (5.3%)
House/condo owner moved in on average (years ago)
7
13
House/condo renter moved in on average (years ago)
2
3
Housing units lacking complete kitchen facilities
1.3%
2.5%
Housing units lacking complete plumbing facilities
1%
0.4%
Housing units in structures
Housing units in structures
Las Vegas
Riverside
One, detached
61.5%
63.1%
One, attached
5.3%
5.6%
Two
1.3%
1.1%
3 or 4
7.7%
3.7%
5 to 9
8.4%
6.8%
10 to 19
4.8%
7.0%
20 to 49
2.8%
4.6%
50 or more
6.8%
6.4%
Mobile homes
1.4%
1.8%
Boats, RVs, vans, etc.
0.1%
0.0%
Median real estate property taxes paid for housing units
Self-employed workers in own not incorporated business
18,990
8,164
State government workers
6,950
8,293
Unpaid family workers
614
199
Industries and Occupations
The economy of Las Vegas heavily relies on the gaming and entertainment industry, followed by accommodation, food services, and retail trade. In Riverside, education, healthcare, government, and trade are the leading industries. Both cities have a similar occupational composition, with office and administrative support roles dominating the labor market.
Both cities offer quality healthcare, with several hospitals and medical centers. However, Las Vegas generally ranks slightly lower in healthcare quality than Riverside, indicating room for improvement.
Health (county statistics)
Type
Las Vegas
Riverside
General health status score of residents in this county from 1 (poor) to 5 (excellent)
Las Vegas, known for its impressive hospitality infrastructure, is also committed to investing in transportation, healthcare, and schools. Similarly, Riverside aggressively improves its infrastructure, with a focus on transit systems, local amenities, and education facilities.
Infrastructure
Type
Las Vegas
Riverside
Hospitals
39
20
TV stations
12
5
Bank branches located here
281
61
Bank institutions located here
34
18
Main business address for public companies
57
2
Drinking water stations with no reported violations in the past
32
2
Drinking water stations with reported violations in the past
HMDA - Conventional home purchase loans - Applications denied
Year
Las Vegas
Riverside
1999
2,657
794
2000
579
375
2001
371
310
2002
380
405
2003
3,590
1,399
2004
5,908
1,892
2005
7,894
2,728
2006
6,914
3,235
2007
3,733
1,568
2008
1,431
544
2009
813
285
Culture and Food
Las Vegas is globally recognized for its vibrant nightlife, entertainment scene, and diverse culinary offerings. Riverside offers a contrasting cultural scene with a focus on arts, museums, and a locally driven cuisine, enriched by its fertile agricultural surroundings.
Sports Teams
Las Vegas has recently attracted major sports teams like the Raiders (NFL) and Golden Knights (NHL). Riverside does not have its own professional sports franchises but is within reach of all Southern California teams.


 Las Vegas, NV
 Riverside, CA