Comparing life in Las Vegas, Nevada and Palmdale, California, one finds unique characteristics in both regions. Las Vegas, known world-over as the Entertainment Capital of the World, offers glitz and glamour alongside a robust economy and diverse cuisine. Palmdale, a city in the Mojave Desert of Southern California, offers a quieter lifestyle distinguished by its aerospace industry, excellent school system, and scenic environment. In considering factors like crime, weather, cost of living, and education, we explore the unique lifestyle opportunities each city offers both to residents and to tourists.
Distance between
Las Vegas, NV and
Palmdale, CA : 196.7 miles
Las Vegas's population is larger by 290%. Its population has grown by 168,356 people (35.2%) since 2000. The population of Palmdale has grown by 49,091 people (42.1%) during that time.
Las Vegas has a significantly higher crime rate compared to Palmdale. Violent crime levels in Las Vegas often exceed national averages, which might deter certain individuals. However, high tourist areas are usually heavily policed and relatively safer. In contrast, Palmdale’s overall crime rate is lower, making it relatively safer for both residents and tourists.
City-data.com crime index counts serious crimes and violent crime more heavily. It adjusts for the number of visitors and daily workers commuting into cities. (higher means more crime, U.S. average = 301.1)
City-data.com crime index counts serious crimes and violent crime more heavily. It adjusts for the number of visitors and daily workers commuting into cities. (higher means more crime, U.S. average = 301.1)
Sex Offenders
According to our data, there are 4,821 registered sex offenders living in Las Vegas and 202 registered sex offenders living in . The ratio of residents to sex offenders in Las Vegas is 131 to 1; the ratio in Palmdale is 779 to 1. The number of registered sex offenders compared to the number of residents is much larger in Las Vegas than that in Palmdale.
Cost of Living
Las Vegas generally has a lower cost of living compared to Palmdale. Housing is notably more affordable, but transportation and healthcare costs are relatively comparable. Palmdale suffers from inflated housing prices due to its California location, despite being more remote and less populated.
Income Tax
Nevada, including Las Vegas, has no state income tax which can be a significant attraction. However, Palmdale residents are subject to California state income tax, which is considered one of the highest in the U.S.
Property Tax
Property tax rates are generally more favorable in Las Vegas, with the average being around 0.64%, compared to Palmdale’s standard rate of 0.77%.
Sales Tax
Las Vegas carries a higher sales tax rate at 8.375% compared to Palmdale’s 7.75%. However, there is no state income tax in Nevada unlike California, where income tax rates vary.
Income
Type
Las Vegas
Palmdale
Estimated median household income
$59,746
$73,417
Estimated per capita income
$33,825
$25,895
Cost of living index (U.S. average is 100)
99.1
129.6
If you make $50,000 in Las Vegas, you will have to make $65,388 in Palmdale to maintain the same standard of living.
Geographical Conditions
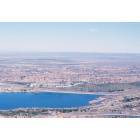
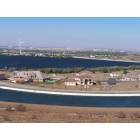
Las Vegas is located in a valley surrounded by mountains in the Mojave Desert. Palmdale is in the high desert, offering beautiful views of the San Gabriel Mountains and a more moderate climate.
Both areas have a solid commitment to education. In Palmdale, the school system is lauded for high-achieving students and quality teachers. Las Vegas’ education system is improving with several high-ranking public and private schools, but faces challenges related to student-teacher ratios.
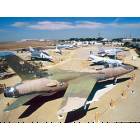
Las Vegas delivers a strong economy driven by tourism, hospitality, gaming, and entertainment. Palmdale possesses a thriving economy majorly propelled by the aerospace industry. Job growth in both cities is anticipated to be higher than the national average over the next decade.
Biggest Employers
Las Vegas' biggest employers include MGM Resorts International, Caesars Entertainment, and Clark County School District. In Palmdale, top employers are Lockheed Martin, Northrop Grumman, and Antelope Valley Mall.
There were 2,700 building permits issued in Las Vegas in 2012 (1886 more than in 2011) compared to 187 building permits issued in Palmdale in 2012 (80 more than in 2011).
In Las Vegas (Clark County), 56.4% voted for Democrats and 41.8% for Republicans in 2012 Presidential Election. In Palmdale (Los Angeles County), 69.7% voted for Democrats and 27.8% for Republicans.
Elections
Type
Democrats
Republicans
Other
Year
Las Vegas
Palmdale
Las Vegas
Palmdale
Las Vegas
Palmdale
2020
53.7%
71.0%
44.3%
26.9%
2.0%
2.1%
2016
52.4%
72.0%
41.7%
22.5%
5.8%
5.5%
2012
56.4%
69.7%
41.8%
27.8%
1.8%
2.4%
2008
58.5%
69.2%
39.5%
28.8%
2.0%
1.9%
2004
51.8%
63.3%
46.9%
35.7%
1.3%
1.0%
2000
51.4%
63.6%
44.8%
32.4%
3.8%
4.0%
1996
75.5%
59.3%
18.8%
31.0%
5.7%
9.7%
Breakdown of population affiliated with a religious congregation
Type
Adherents
Congregations
Religion
Las Vegas
Palmdale
Las Vegas
Palmdale
CATHOLIC CHURCH
18.1%
36.1%
4.0%
4.7%
SOUTHERN BAPTIST CONVENTION
1.6%
1.0%
11.2%
9.0%
EVANGELICAL LUTHERAN CHURCH IN AMERICA
0.4%
0.2%
1.6%
1.9%
AMERICAN BAPTIST CHURCHES IN THE USA
0.2%
0.5%
1.4%
3.1%
SEVENTH DAY ADVENTIST CHURCH
0.2%
0.5%
1.6%
2.4%
EPISCOPAL CHURCH
0.1%
0.4%
1.1%
1.4%
MUSLIM ESTIMATE
0.1%
0.7%
0.6%
1.0%
Weather
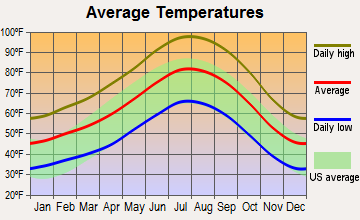
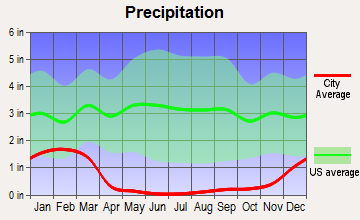
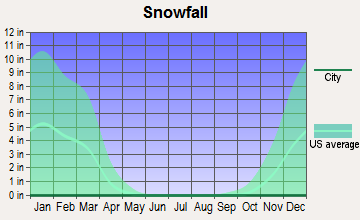
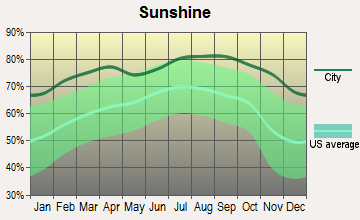
Las Vegas experiences a hot desert climate with very little rainfall; it can be extremely hot during the summer months, with temperatures often exceeding 100°F. In Palmdale, the weather is generally much cooler due to its higher altitude, with hot summers and cold, windy winters. Nonetheless, both cities enjoy a lot of sunshine.
Weather and climate
Type
Las Vegas
Palmdale
Temperature - Average
65.5°F
63°F
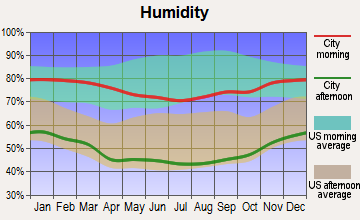
Humidity - Average morning or afternoon humidity
30.7%
62.2%
Humidity - Differences between morning and afternoon humidity
42%
17.2%
Humidity - Maximum monthly morning or afternoon humidity
52%
65.6%
Humidity - Minimum monthly morning or afternoon humidity
10%
48.5%
Precipitation - Yearly average
5.7 in
7.4 in
Snowfall - Yearly average
1.6 in
0 in
Clouds - Number of days clear of clouds
35.1%
27.5%
Sunshine amount - Average
91.8%
78.6%
Sunshine amount - Differences during a year
16%
21.3%
Sunshine amount - Maximum monthly
92%
84.5%
Sunshine amount - Minimum monthly
76%
63.3%
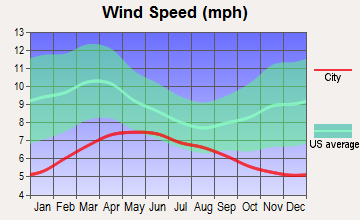
Wind speed - Average
9.2 mph
4.1 mph
Average climate in Las Vegas, Nevada
Average climate in Palmdale, California
Air pollution
Type
AQI
CO
NO2
OZONE
PM10
PM25
SO2
Year
Las Vegas
Palmdale
Las Vegas
Palmdale
Las Vegas
Palmdale
Las Vegas
Palmdale
Las Vegas
Palmdale
Las Vegas
Palmdale
Las Vegas
2018
100
95
0.42
0.21
13.1
8.7
37.2
39.8
24.4
25.4
6.0
7.3
0.7
N/A
2017
101
89
0.29
0.26
13.0
7.8
38.5
38.3
20.3
25.4
7.3
7.4
0.8
N/A
2016
97
91
0.38
0.25
11.2
8.1
36.5
40.2
20.6
25.0
8.7
7.7
0.8
N/A
2015
92
104
0.36
0.27
12.4
6.7
35.6
41.5
18.9
18.4
8.4
N/A
1.2
N/A
2014
91
90
0.40
0.16
10.8
8.2
36.5
38.7
21.1
22.7
9.2
N/A
1.4
N/A
2013
103
96
0.45
0.20
9.6
8.0
36.9
39.4
22.1
22.5
8.6
N/A
1.5
N/A
2012
94
89
0.49
0.28
5.9
8.9
38.5
40.5
21.5
29.5
8.3
N/A
1.4
N/A
2011
85
97
0.40
0.27
5.3
11.7
37.5
41.9
18.2
19.7
7.8
N/A
1.2
N/A
2010
86
93
0.50
0.16
5.7
11.7
36.6
41.8
16.1
19.0
7.1
N/A
N/A
N/A
2009
87
103
0.56
0.15
6.0
12.7
33.3
40.9
20.9
20.6
8.3
N/A
N/A
N/A
2008
82
98
0.66
0.17
8.2
13.2
33.0
37.7
N/A
26.5
9.2
N/A
N/A
N/A
2007
97
97
0.61
0.20
11.7
14.5
32.4
37.5
N/A
23.8
8.6
N/A
0.1
N/A
2006
102
95
0.75
0.24
13.4
14.9
32.7
35.6
N/A
23.6
8.3
N/A
0.8
N/A
2005
100
102
0.76
0.23
15.1
15.4
30.2
36.4
N/A
22.2
7.8
N/A
5.3
N/A
2004
85
109
0.71
0.25
16.0
14.5
30.6
39.1
N/A
24.8
N/A
N/A
1.6
N/A
2003
99
112
0.67
0.27
15.9
15.0
29.8
38.1
N/A
26.4
N/A
N/A
1.0
N/A
2002
94
113
0.73
0.30
15.7
15.7
30.6
38.5
N/A
28.8
N/A
N/A
0.7
N/A
2001
95
103
0.76
0.39
15.0
15.8
29.4
37.8
N/A
25.9
N/A
N/A
1.1
N/A
2000
95
109
0.88
0.52
14.7
15.6
29.7
37.2
N/A
26.6
N/A
N/A
0.4
N/A
Natural disasters
Type
Las Vegas
Palmdale
Tornado activity compared to U.S. average
2.1%
12.6%
Earthquake activity compared to U.S. average
6,093.4%
7,632.2%
Natural disasters compared to U.S. average
12%
57%
Transportation
Las Vegas presents a comprehensive public transportation system supported by buses, monorails, and shuttles, making commuting relatively easy. Palmdale offers a stable public transit system, bolstered by Metrolink train service for commuting to downtown Los Angeles.
Transport
Type
Las Vegas
Palmdale
Amtrak stations
1
1
Amtrak stations nearby
1
3
FAA registered aircraft
1
82
FAA registered aircraft manufacturers and dealers
81
2
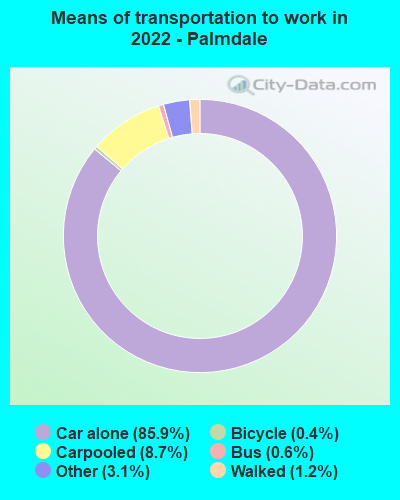
Means of transportation to work
Type
Las Vegas
Palmdale
Bicycle
0.1%
0.3%
Bus
2.2%
0.7%
Carpooled
10.3%
8.4%
Car alone
82.7%
86.1%
Motorcycle
0.4%
0.3%
Railroad
0%
0.6%
Subway
0%
0.1%
Walked
1.4%
1.2%
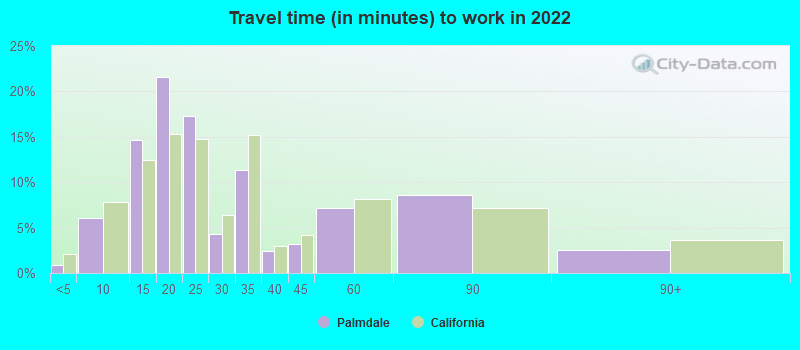
Average travel time to work
Type
Las Vegas
Palmdale
Average
26.3 min
27.3 min
Other means
24 min
42.1 min
Public transportation
49.9 min
61.6 min
Private vehicle occupancy
Type
Las Vegas
Palmdale
Average
1.2
1.2
Drove alone
88.9%
89.3%
In 2 person carpool
8.2%
5.4%
In 3 person carpool
2.1%
3%
In 4 person carpool
0.2%
0.9%
In 5-6 person carpool
0.4%
1.5%
In 7+ person carpool
0.2%
0%
How many people usually rode to work in the car, truck or van.
Real Estate
Bearing lower housing costs, Las Vegas tends to offer a more affordable real estate market than Palmdale. Both cities have varying types of housing options ranging from apartments to single-family homes.
Neighborhoods
Las Vegas presents a variety of neighborhoods, each with its unique character – from the sophistication of Summerlin to the vibrant downtown vicinity. Palmdale possesses quieter residential areas, with most neighborhoods offering open space, parks, and scenic views.
Houses and residents
Type
Las Vegas
Palmdale
Houses
269,602
47,738
Average household size (people)
2.7
3.6
Median year apartment built
1991
1987
Median year house/condo built
1995
1991
Length of stay in the house since moving in
10.1 years
12.7 years
Houses occupied
250,350 (92.9%)
46,650 (97.7%)
Houses occupied by owners
138,677 (55.4%)
31,401 (67.3%)
Houses occupied by renters
111,673 (44.6%)
15,249 (32.7%)
Median rent asked for vacant for-rent units
$1,176
$1,421
Median monthly housing costs
$1,255
$1,706
Median price asked for vacant for-sale houses and condos
$989,410
$394,753
Estimated median house or condo value
$362,400
$399,000
Median numbers of rooms
5.2
6.3
Median number of rooms in apartments
4.1
5.2
Median number of rooms in houses and condos
6.1
6.8
Median house price - detached houses
$439,169
$383,478
Median house price - in 2-unit structures
$161,204
$550,538
Median house price - in 3-to-4-unit structures
$201,871
$572,509
Median house price - in 5 or more unit structures
$327,174
$441,622
Median house price - mobile homes
$113,235
$80,441
Median house price - Townhouses or other attached units
$274,961
$315,513
Median house price - All housing units
$417,434
$368,474
Median house age
27
31
Renting percentage
43.5%
32.1%
Housing density (houses/condos per square mile)
2,379.4
454.8
House value disparities
27.1%
23.5%
Household income disparities
47.1%
40.9%
Median household income for houses/condes with a mortgage
$90,388
$90,004
Median household income for apartments without a mortgage
$62,287
$61,301
Housing units without a mortgage
1,172 (1.2%)
222 (1%)
Housing units with both a second mortgage and home equity loan
4,450 (4.6%)
994 (4.3%)
Housing units with a mortgage
95,992 (98.8%)
23,090 (99%)
Housing units with a home equity loan
178 (0.2%)
27 (0.1%)
Housing units with a second mortgage
5,092 (5.2%)
1,492 (6.4%)
House/condo owner moved in on average (years ago)
7
12
House/condo renter moved in on average (years ago)
2
4
Housing units lacking complete kitchen facilities
1.3%
0.9%
Housing units lacking complete plumbing facilities
1%
0.5%
Housing units in structures
Housing units in structures
Las Vegas
Palmdale
One, detached
61.5%
81.4%
One, attached
5.3%
1.0%
Two
1.3%
0.4%
3 or 4
7.7%
1.2%
5 to 9
8.4%
1.8%
10 to 19
4.8%
2.7%
20 to 49
2.8%
1.5%
50 or more
6.8%
6.3%
Mobile homes
1.4%
3.6%
Boats, RVs, vans, etc.
0.1%
0.0%
Median real estate property taxes paid for housing units
Self-employed workers in own not incorporated business
18,990
6,202
State government workers
6,950
2,825
Unpaid family workers
614
162
Industries and Occupations
In Las Vegas, employment is concentrated in accommodation and food services, retail trade, and healthcare. Palmdale's economy is driven by the aerospace industry, retail, and education, with leading employers like Lockheed Martin and Antelope Valley Union High School District.
Las Vegas offers superior healthcare facilities with various top-rated hospitals. Palmdale also has several reputable healthcare providers but generally fewer facilities than Las Vegas.
Health (county statistics)
Type
Las Vegas
Palmdale
General health status score of residents in this county from 1 (poor) to 5 (excellent)
Las Vegas boasts world-class infrastructure facilitating millions of visitors yearly, including the McCarran International Airport, resorts, and public transport system. Palmdale’s infrastructure is stable and reliable, focused on connecting the city to other Southern California areas, notably with the Palmdale Regional Airport and Metrolink rail service.
Infrastructure
Type
Las Vegas
Palmdale
Hospitals
39
2
TV stations
12
16
Bank branches located here
281
16
Bank institutions located here
34
6
Drinking water stations with no reported violations in the past
32
3
Drinking water stations with reported violations in the past
HMDA - Conventional home purchase loans - Applications denied
Year
Las Vegas
Palmdale
1999
2,657
374
2000
579
12
2001
371
10
2002
380
14
2003
3,590
1,069
2004
5,908
1,520
2005
7,894
2,332
2006
6,914
2,500
2007
3,733
1,709
2008
1,431
684
2009
813
278
Culture and Food
Las Vegas is globally famed for its vibrant culture and diverse food scenes. The city is packed with world-renowned chefs, restaurants, and food festivals. Palmdale offers a more suburban culture with an array of casual dining options.
Sports Teams
Las Vegas is home to the Golden Knights (NHL), Raiders (NFL), and the Las Vegas Aces (WNBA). Palmdale lacks major sports franchises but has proximity to Los Angeles teams like the Lakers (NBA) and Dodgers (MLB).


 Las Vegas, NV
 Palmdale, CA