Las Vegas, Nevada and Ontario, California are distinct in their lifestyle offerings. Sin City is known for its vibrant nightlife, bright lights, entertainment opportunities, while Ontario, part of the Greater Los Angeles Area, has a more suburban vibe with access to the cultural amenities of Southern California. A comparison across crime and safety, weather, cost of living, education, economy, infrastructure, industries and occupations, employers, real estate, neighborhoods, transportation, taxes, culture and food, sports, geographical conditions, and healthcare, will provide insights into what makes these two cities uniquely appealing and offer potential tips for relocators or visitors.
Distance between
Las Vegas, NV and
Ontario, CA : 200.9 miles
Las Vegas's population is larger by 263%. Its population has grown by 168,356 people (35.2%) since 2000. The population of Ontario has grown by 19,956 people (12.6%) during that time.
In terms of crime and safety, Las Vegas tends to have higher crime rates compared to Ontario. Violent and property crime rates in Las Vegas are above national averages. In contrast, Ontario's violent and property crime rates are on par with national averages. Tourists need to be cautious in areas known for higher crime incidences.
City-data.com crime index counts serious crimes and violent crime more heavily. It adjusts for the number of visitors and daily workers commuting into cities. (higher means more crime, U.S. average = 301.1)
City-data.com crime index counts serious crimes and violent crime more heavily. It adjusts for the number of visitors and daily workers commuting into cities. (higher means more crime, U.S. average = 301.1)
Sex Offenders
According to our data, there are 4,821 registered sex offenders living in Las Vegas and 217 registered sex offenders living in . The ratio of residents to sex offenders in Las Vegas is 131 to 1; the ratio in Ontario is 798 to 1. The number of registered sex offenders compared to the number of residents is much larger in Las Vegas than that in Ontario.
Cost of Living
The cost of living in Las Vegas is generally lower than in Ontario due to cheaper housing costs and lower taxes. Ontario, being in Southern California, has a high cost of living driven by housing, transportation, and healthcare costs.
Income Tax
Nevada, including Las Vegas, does not have a state income tax, making it attractive for those with high incomes. On the contrary, residents of Ontario, like all Californians, are subjected to a state income tax.
Property Tax
While property values are generally higher in Ontario, the city’s property tax rates are lower compared to Las Vegas. Las Vegas has lower property values but higher property tax rates.
Sales Tax
Las Vegas has a high sales tax rate of 8.38%, while Ontario's sales tax rate is 7.75%, slightly lower than Las Vegas's rate.
Income
Type
Las Vegas
Ontario
Estimated median household income
$59,746
$73,872
Estimated per capita income
$33,825
$28,662
Cost of living index (U.S. average is 100)
99.1
84.1
If you make $50,000 in Ontario, you will have to make $58,918 in Las Vegas to maintain the same standard of living.
Geographical Conditions
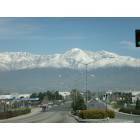
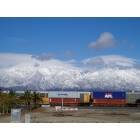
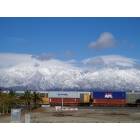
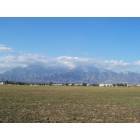
Las Vegas is nestled within a desert, surrounded by mountains. Ontario, in contrast, is positioned in the San Bernardino Valley and is between the coast and mountains, which influences its climate.
Both cities have public schools, charter schools, and private schools that offer quality education. Top-performing schools in Las Vegas include the Advanced Technologies Academy and the Clark County School District. In Ontario, Chaffey Joint Union High and Ontario-Montclair are among notable school districts.
The bustling tourism and hospitality industry fuels Las Vegas's economy, and job opportunities abound in these areas. Ontario has a more diversified job market, with roles in healthcare, manufacturing, and logistics being mainstays. Ontario also features more corporate and tech-related jobs.
Biggest Employers
Las Vegas's biggest employers are MGM Resorts International, Caesars Entertainment, and Wynn Resorts. Major Ontario employers include Ontario International Airport, Prime Healthcare Services, and Ontario-Montclair School District.
There were 2,700 building permits issued in Las Vegas in 2012 (1886 more than in 2011) compared to 738 building permits issued in Ontario in 2012 (702 more than in 2011).
In Las Vegas (Clark County), 56.4% voted for Democrats and 41.8% for Republicans in 2012 Presidential Election. In Ontario (San Bernardino County), 52.3% voted for Democrats and 45.0% for Republicans.
Elections
Type
Democrats
Republicans
Other
Year
Las Vegas
Ontario
Las Vegas
Ontario
Las Vegas
Ontario
2020
53.7%
54.2%
44.3%
43.6%
2.0%
2.2%
2016
52.4%
52.1%
41.7%
41.5%
5.8%
6.4%
2012
56.4%
52.3%
41.8%
45.0%
1.8%
2.6%
2008
58.5%
52.2%
39.5%
45.8%
2.0%
2.0%
2004
51.8%
43.8%
46.9%
55.6%
1.3%
0.6%
2000
51.4%
47.3%
44.8%
48.8%
3.8%
3.9%
1996
75.5%
44.4%
18.8%
43.6%
5.7%
12.1%
Breakdown of population affiliated with a religious congregation
Type
Adherents
Congregations
Religion
Las Vegas
Ontario
Las Vegas
Ontario
CATHOLIC CHURCH
18.1%
21.9%
4.0%
4.3%
SOUTHERN BAPTIST CONVENTION
1.6%
2.2%
11.2%
9.6%
EVANGELICAL LUTHERAN CHURCH IN AMERICA
0.4%
0.2%
1.6%
1.5%
SEVENTH DAY ADVENTIST CHURCH
0.2%
1.6%
1.6%
4.6%
MUSLIM ESTIMATE
0.1%
0.6%
0.6%
1.1%
Weather
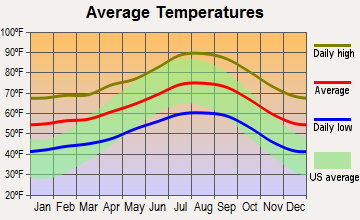
With its desert climate, Las Vegas offers hot, blisteringly dry summers, and short, cool winters. On the contrary, Ontario enjoys a Mediterranean climate with mild and short winters, hot and dry summers, and enjoys coastal breezes.
Weather and climate
Type
Las Vegas
Ontario
Temperature - Average
65.5°F
64.1°F
Humidity - Average morning or afternoon humidity
30.7%
65.5%
Humidity - Differences between morning and afternoon humidity
42%
20.4%
Humidity - Maximum monthly morning or afternoon humidity
52%
71.9%
Humidity - Minimum monthly morning or afternoon humidity
10%
51.5%
Precipitation - Yearly average
5.7 in
18.4 in
Snowfall - Yearly average
1.6 in
0 in
Clouds - Number of days clear of clouds
35.1%
27.6%
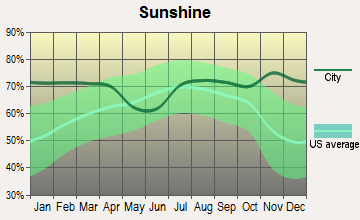
Sunshine amount - Average
91.8%
78.4%
Sunshine amount - Differences during a year
16%
21.9%
Sunshine amount - Maximum monthly
92%
84.8%
Sunshine amount - Minimum monthly
76%
62.9%
Wind speed - Average
9.2 mph
4 mph
Average climate in Las Vegas, Nevada
Average climate in Ontario, California
Air pollution
Type
AQI
CO
NO2
OZONE
PB
PM10
PM25
SO2
Year
Las Vegas
Ontario
Las Vegas
Ontario
Las Vegas
Ontario
Las Vegas
Ontario
Ontario
Las Vegas
Ontario
Las Vegas
Ontario
Las Vegas
Ontario
2018
100
152
0.42
0.37
13.1
15.4
37.2
28.3
0.006
N/A
24.4
35.4
6.0
15.2
0.7
0.4
2017
101
153
0.29
0.43
13.0
15.9
38.5
31.2
0.005
N/A
20.3
35.5
7.3
16.4
0.8
0.2
2016
97
140
0.38
0.39
11.2
16.6
36.5
31.1
0.006
N/A
20.6
29.5
8.7
16.7
0.8
0.3
2015
92
148
0.36
0.37
12.4
16.3
35.6
30.7
0.005
N/A
18.9
31.1
8.4
16.0
1.2
0.3
2014
91
145
0.40
0.36
10.8
17.2
36.5
29.1
0.006
N/A
21.1
33.4
9.2
17.4
1.4
0.3
2013
103
145
0.45
0.34
9.6
18.4
36.9
27.0
0.006
N/A
22.1
33.9
8.6
16.2
1.5
0.4
2012
94
148
0.49
0.39
5.9
19.2
38.5
27.7
0.006
N/A
21.5
34.3
8.3
18.2
1.4
0.5
2011
85
147
0.40
0.39
5.3
19.6
37.5
26.5
0.007
N/A
18.2
32.5
7.8
20.5
1.2
0.5
2010
86
143
0.50
0.41
5.7
20.2
36.6
27.8
0.008
N/A
16.1
29.8
7.1
18.7
N/A
1.1
2009
87
153
0.56
0.39
6.0
22.5
33.3
27.4
0.008
N/A
20.9
27.7
8.3
19.3
N/A
1.1
2008
82
161
0.66
0.45
8.2
22.9
33.0
27.8
0.009
N/A
N/A
31.3
9.2
18.3
N/A
1.4
2007
97
137
0.61
0.55
11.7
26.6
32.4
25.7
0.011
N/A
N/A
N/A
8.6
N/A
0.1
1.7
2006
102
127
0.75
0.61
13.4
29.1
32.7
25.3
0.007
N/A
N/A
N/A
8.3
N/A
0.8
1.7
2005
100
133
0.76
0.64
15.1
29.7
30.2
22.3
0.012
N/A
N/A
N/A
7.8
N/A
5.3
2.5
2004
85
142
0.71
0.70
16.0
29.0
30.6
22.9
0.012
N/A
N/A
N/A
N/A
N/A
1.6
1.7
2003
99
141
0.67
0.55
15.9
32.8
29.8
22.3
0.019
N/A
N/A
N/A
N/A
N/A
1.0
1.2
2002
94
136
0.73
0.48
15.7
34.7
30.6
22.1
0.018
N/A
N/A
N/A
N/A
N/A
0.7
0.9
2001
95
145
0.76
1.00
15.0
35.6
29.4
21.0
0.034
N/A
N/A
N/A
N/A
N/A
1.1
1.2
2000
95
153
0.88
1.05
14.7
37.0
29.7
21.1
0.038
N/A
N/A
N/A
N/A
N/A
0.4
1.8
Natural disasters
Type
Las Vegas
Ontario
Tornado activity compared to U.S. average
2.1%
18.1%
Earthquake activity compared to U.S. average
6,093.4%
7,358.4%
Natural disasters compared to U.S. average
12%
46%
Transportation
Public transportation is prevalent in both cities. Las Vegas has the extensive RTC transit system, while Ontario employs the Omnitrans bus service. Ontario's proximity to LA also provides easy access to Metrolink trains.
Transport
Type
Las Vegas
Ontario
Amtrak stations
1
1
Amtrak stations nearby
1
3
FAA registered aircraft
1
56
FAA registered aircraft manufacturers and dealers
81
4
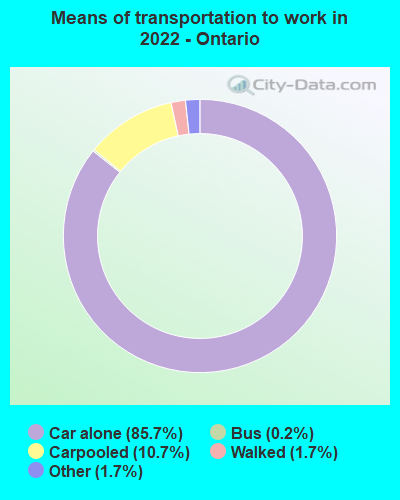
Means of transportation to work
Type
Las Vegas
Ontario
Bicycle
0.1%
0.1%
Bus
2.2%
0.8%
Carpooled
10.3%
12.4%
Car alone
82.7%
84.9%
Motorcycle
0.4%
0.1%
Railroad
0%
0.6%
Streetcar
0%
0.1%
Walked
1.4%
0.8%
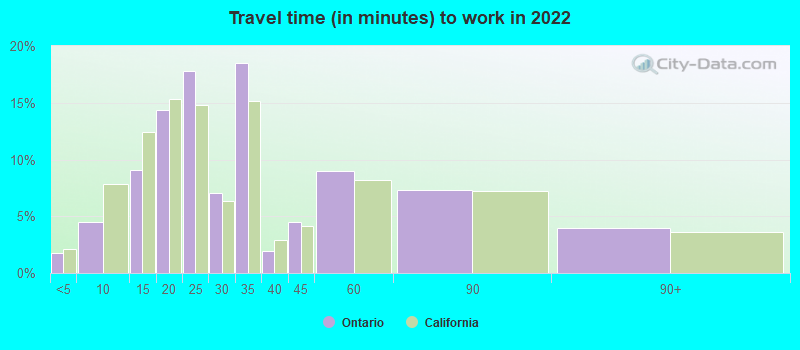
Average travel time to work
Type
Las Vegas
Ontario
Average
26.3 min
33.4 min
Other means
24 min
29.8 min
Public transportation
49.9 min
56 min
Private vehicle occupancy
Type
Las Vegas
Ontario
Average
1.2
1.2
Drove alone
88.9%
87.5%
In 2 person carpool
8.2%
8.8%
In 3 person carpool
2.1%
2.5%
In 4 person carpool
0.2%
0.8%
In 5-6 person carpool
0.4%
0.4%
In 7+ person carpool
0.2%
0.1%
How many people usually rode to work in the car, truck or van.
Real Estate
Real estate in Las Vegas centers on the single-family housing market but also includes condominiums. Ontario's market is similar but tends to feature pricier homes due to California's high property value.
Neighborhoods
Las Vegas offers distinctive neighborhoods, from the lively downtown area to the tranquil Summerlin. Ontario boasts suburban neighborhoods close to commercial areas and features master-planned communities.
Houses and residents
Type
Las Vegas
Ontario
Houses
269,602
57,356
Average household size (people)
2.7
3.6
Median year apartment built
1991
1981
Median year house/condo built
1995
1978
Length of stay in the house since moving in
10.1 years
14.1 years
Houses occupied
250,350 (92.9%)
55,819 (97.3%)
Houses occupied by owners
138,677 (55.4%)
32,424 (58.1%)
Houses occupied by renters
111,673 (44.6%)
23,395 (41.9%)
Median rent asked for vacant for-rent units
$1,176
$1,608
Median monthly housing costs
$1,255
$1,803
Median price asked for vacant for-sale houses and condos
$989,410
$368,754
Estimated median house or condo value
$362,400
$545,200
Median numbers of rooms
5.2
5
Median number of rooms in apartments
4.1
4.2
Median number of rooms in houses and condos
6.1
5.8
Median house price - detached houses
$439,169
$498,726
Median house price - in 2-unit structures
$161,204
Over $1,000,000
Median house price - in 3-to-4-unit structures
$201,871
$442,872
Median house price - in 5 or more unit structures
$327,174
$415,138
Median house price - mobile homes
$113,235
$49,867
Median house price - Townhouses or other attached units
$274,961
$391,450
Median house price - All housing units
$417,434
$490,823
Median house age
27
42
Renting percentage
43.5%
44.7%
Housing density (houses/condos per square mile)
2,379.4
1,152.1
House value disparities
27.1%
21.6%
Household income disparities
47.1%
41.4%
Median household income for houses/condes with a mortgage
$90,388
$104,195
Median household income for apartments without a mortgage
$62,287
$71,637
Housing units without a mortgage
1,172 (1.2%)
312 (1.3%)
Housing units with both a second mortgage and home equity loan
4,450 (4.6%)
875 (3.5%)
Housing units with a mortgage
95,992 (98.8%)
24,570 (98.7%)
Housing units with a home equity loan
178 (0.2%)
245 (1%)
Housing units with a second mortgage
5,092 (5.2%)
1,316 (5.3%)
House/condo owner moved in on average (years ago)
7
11
House/condo renter moved in on average (years ago)
2
4
Housing units lacking complete kitchen facilities
1.3%
2%
Housing units lacking complete plumbing facilities
1%
0.5%
Housing units in structures
Housing units in structures
Las Vegas
Ontario
One, detached
61.5%
58.7%
One, attached
5.3%
8.0%
Two
1.3%
2.6%
3 or 4
7.7%
6.9%
5 to 9
8.4%
4.4%
10 to 19
4.8%
2.9%
20 to 49
2.8%
3.4%
50 or more
6.8%
9.4%
Mobile homes
1.4%
3.8%
Boats, RVs, vans, etc.
0.1%
0.0%
Median real estate property taxes paid for housing units
Self-employed workers in own not incorporated business
18,990
5,269
State government workers
6,950
3,109
Unpaid family workers
614
0
Industries and Occupations
With casinos and hotels being the city's lifeblood, the hospitality industry drives Las Vegas's job market. Ontario has a mix of jobs across healthcare, logistics, manufacturing, and retail.
Both cities offer reliable healthcare services. Las Vegas features major hospitals like the Sunrise Hospital and Medical Center and healthcare giants like HCA and Universal Health Services. Ontario has the benefit of proximity to major healthcare centers in LA and has local facilities like the Kindred Hospital and San Antonio Regional Hospital.
Health (county statistics)
Type
Las Vegas
Ontario
General health status score of residents in this county from 1 (poor) to 5 (excellent)
Las Vegas is synonymous with its iconic casinos, grand hotels, and entertainment venues, while Ontario is known for its suburban architecture with prevalent shopping centers, eateries, and regional airport.
Infrastructure
Type
Las Vegas
Ontario
Hospitals
39
4
TV stations
12
10
Bank branches located here
281
27
Bank institutions located here
34
18
Main business address for public companies
57
2
Drinking water stations with no reported violations in the past
32
4
Drinking water stations with reported violations in the past
HMDA - Conventional home purchase loans - Applications denied
Year
Las Vegas
Ontario
1999
2,657
451
2000
579
561
2001
371
505
2002
380
503
2003
3,590
827
2004
5,908
1,083
2005
7,894
1,584
2006
6,914
1,557
2007
3,733
969
2008
1,431
327
2009
813
169
Culture and Food
Entertainment and food options are plentiful in both cities. Las Vegas hosts vibrant nightlife, world-class dining, shows, and concerts. Ontario offers a suburban dining scene with cuisine reflecting the diverse culture of Southern California.
Sports Teams
Las Vegas hosts professional teams such as the Raiders in the NFL, the Golden Knights in the NHL, and the Aces in the WNBA. Ontario, located near Los Angeles, lets residents root for teams like the Lakers in the NBA, Dodgers in MLB, and Rams in the NFL.


 Las Vegas, NV
 Ontario, CA