Las Vegas, Nevada, and Fresno, California, each offer unique attractions and opportunities to both residents and tourists, distinguished by diverse climatic conditions, economic and employment landscapes, and lifestyle options. Safety levels, costs of living, educational offerings, labor markets, and urban infrastructures vary appreciably and this comparison elaborates upon those aspects. Additionally, we delve into the main industrial sectors, dominant employers, property markets, neighborhood characteristics, commuting methods, tax obligations, culinary and cultural scenes, local sports fandom, geographical environment, and healthcare services in the two cities.
Distance between
Las Vegas, NV and
Fresno, CA : 257.1 miles
Las Vegas's population is larger by 19%. Its population has grown by 168,356 people (35.2%) since 2000. The population of Fresno has grown by 116,858 people (27.3%) during that time.
Las Vegas is perceived as having a higher crime rate than Fresno, although crimes are reportedly concentrated in certain areas and largely affect those involved in risky behavior. Tourists generally feel safe in Las Vegas, especially on the Strip and downtown. In Fresno, crime rates are similar to the national average, with some neighborhoods safer than others. However, both cities have seen improvements in overall safety in recent years, as local governments have invested in their police departments and crime prevention strategies.
City-data.com crime index counts serious crimes and violent crime more heavily. It adjusts for the number of visitors and daily workers commuting into cities. (higher means more crime, U.S. average = 301.1)
City-data.com crime index counts serious crimes and violent crime more heavily. It adjusts for the number of visitors and daily workers commuting into cities. (higher means more crime, U.S. average = 301.1)
Sex Offenders
According to our data, there are 4,821 registered sex offenders living in Las Vegas and 1,525 registered sex offenders living in . The ratio of residents to sex offenders in Las Vegas is 131 to 1; the ratio in Fresno is 342 to 1. The number of registered sex offenders compared to the number of residents is much larger in Las Vegas than that in Fresno.
Cost of Living
Las Vegas is generally more affordable than Fresno, with lower costs in areas such as housing and utilities. Nevada also has no state income tax, which is a major consideration for those looking to relocate there. Overall, the cost of living in Fresno is higher due to California's stringent regulatory environment and high tax rates, though it's cheaper compared to many other cities in the state.
Income Tax
Nevada does not have a state income tax, which indicates residents in Las Vegas are not obligated to pay income tax to the state. In contrast, California imposes a state income tax, with rates ranging from 1% to 13.3%.
Property Tax
The property tax in Las Vegas averages 0.69% of assessed home value, much lower than Fresno's average rate of 0.84%. The higher tax rate in Fresno could be a consideration for individuals looking at real estate investment.
Sales Tax
Las Vegas, in Clark County, has a sales tax of 8.38%, while Fresno, situated in California, has a higher sales tax of 7.975%.
Income
Type
Las Vegas
Fresno
Estimated median household income
$59,746
$61,250
Estimated per capita income
$33,825
$28,499
Cost of living index (U.S. average is 100)
99.1
96.3
If you make $50,000 in Fresno, you will have to make $51,454 in Las Vegas to maintain the same standard of living.
Geographical Conditions
Las Vegas is located in a desert valley surrounded by mountains, while Fresno in the San Joaquin Valley is surrounded by farmland with proximity to the Sierra Nevada mountains. Both cities experience heat but the aridness level differs.
Las Vegas offers numerous educational options, from high-quality public schools, magnet schools, to private institutions. Postsecondary and higher education opportunities such as the University of Nevada, Las Vegas (UNLV) are also present. Fresno’s education system is equally diverse with Fresno Unified School District being the state's fourth largest. The city also houses several higher education institutions, including California State University, Fresno.
Las Vegas' economy is hugely dominated by tourism, gaming, and hospitality industries. There's also a growing tech industry. Fresno's economy, meanwhile, has a heavy agricultural focus, being part of the productive San Joaquin Valley. Logistics, healthcare, and education are also significant industries. Unemployment rates are usually lower in Fresno than in Las Vegas.
Biggest Employers
In Las Vegas, the largest employers include MGM Resorts International, Caesars Entertainment, and the Clark County School District. In Fresno, major employers include Community Medical Centers, the County of Fresno, and Saint Agnes Medical Center.
There were 2,700 building permits issued in Las Vegas in 2012 (1886 more than in 2011) compared to 1,911 building permits issued in Fresno in 2012 (1205 more than in 2011).
In Las Vegas (Clark County), 56.4% voted for Democrats and 41.8% for Republicans in 2012 Presidential Election. In Fresno (Fresno County), 49.8% voted for Democrats and 48.0% for Republicans.
Elections
Type
Democrats
Republicans
Other
Year
Las Vegas
Fresno
Las Vegas
Fresno
Las Vegas
Fresno
2020
53.7%
53.0%
44.3%
45.2%
2.0%
1.8%
2016
52.4%
49.2%
41.7%
43.2%
5.8%
7.5%
2012
56.4%
49.8%
41.8%
48.0%
1.8%
2.2%
2008
58.5%
50.2%
39.5%
48.1%
2.0%
1.8%
2004
51.8%
42.0%
46.9%
57.8%
1.3%
0.3%
2000
51.4%
43.2%
44.8%
53.3%
3.8%
3.5%
1996
75.5%
45.3%
18.8%
47.4%
5.7%
7.3%
Breakdown of population affiliated with a religious congregation
Type
Adherents
Congregations
Religion
Las Vegas
Fresno
Las Vegas
Fresno
CATHOLIC CHURCH
18.1%
31.0%
4.0%
6.1%
SOUTHERN BAPTIST CONVENTION
1.6%
1.6%
11.2%
8.1%
EVANGELICAL LUTHERAN CHURCH IN AMERICA
0.4%
0.5%
1.6%
2.0%
AMERICAN BAPTIST CHURCHES IN THE USA
0.2%
0.6%
1.4%
2.4%
SEVENTH DAY ADVENTIST CHURCH
0.2%
0.7%
1.6%
2.6%
MUSLIM ESTIMATE
0.1%
0.3%
0.6%
0.6%
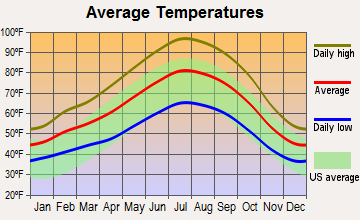
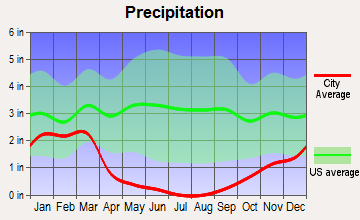
Weather
Las Vegas experiences a desert climate with hot summer, mild winters, and very little rainfall. This weather can be enjoyable for tourists looking for sunshine and those who dislike cold winter temperatures. Fresno, on the other hand, has a mediterranean climate, with hot, dry summers, and rainy winters. For those who prefer variation in seasons, Fresno would be a more suitable option.
Weather and climate
Type
Las Vegas
Fresno
Temperature - Average
65.5°F
63°F
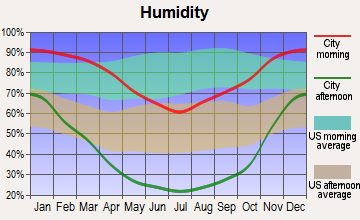
Humidity - Average morning or afternoon humidity
30.7%
60.9%
Humidity - Differences between morning and afternoon humidity
42%
67%
Humidity - Maximum monthly morning or afternoon humidity
52%
88%
Humidity - Minimum monthly morning or afternoon humidity
10%
21%
Precipitation - Yearly average
5.7 in
11.6 in
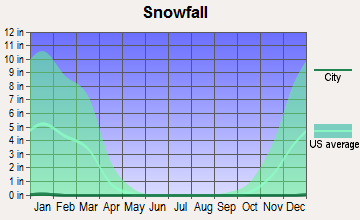
Snowfall - Yearly average
1.6 in
0 in
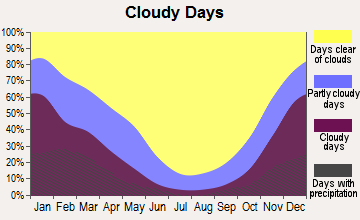
Clouds - Number of days clear of clouds
35.1%
32.4%
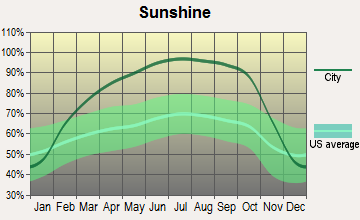
Sunshine amount - Average
91.8%
82.8%
Sunshine amount - Differences during a year
16%
52%
Sunshine amount - Maximum monthly
92%
96%
Sunshine amount - Minimum monthly
76%
44%
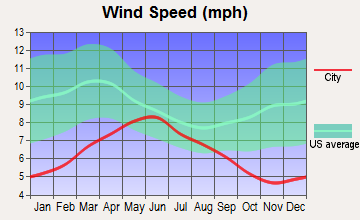
Wind speed - Average
9.2 mph
6.5 mph
Average climate in Las Vegas, Nevada
Average climate in Fresno, California
Air pollution
Type
AQI
CO
NO2
OZONE
PB
PM10
PM25
SO2
Year
Las Vegas
Fresno
Las Vegas
Fresno
Las Vegas
Fresno
Las Vegas
Fresno
Fresno
Las Vegas
Fresno
Las Vegas
Fresno
Las Vegas
Fresno
2018
100
128
0.42
0.35
13.1
9.7
37.2
31.7
N/A
N/A
24.4
39.7
6.0
14.8
0.7
0.6
2017
101
132
0.29
0.35
13.0
9.2
38.5
33.2
N/A
N/A
20.3
38.3
7.3
14.3
0.8
0.6
2016
97
128
0.38
0.35
11.2
8.4
36.5
31.4
N/A
N/A
20.6
34.7
8.7
13.5
0.8
0.5
2015
92
134
0.36
0.32
12.4
8.7
35.6
31.1
N/A
N/A
18.9
34.2
8.4
13.9
1.2
0.5
2014
91
139
0.40
0.33
10.8
10.1
36.5
32.4
0.004
N/A
21.1
39.3
9.2
16.4
1.4
0.5
2013
103
136
0.45
0.37
9.6
11.1
36.9
31.0
0.005
N/A
22.1
43.3
8.6
19.1
1.5
0.6
2012
94
140
0.49
0.36
5.9
9.7
38.5
31.9
0.004
N/A
21.5
36.1
8.3
14.2
1.4
0.6
2011
85
139
0.40
0.34
5.3
8.7
37.5
33.5
N/A
N/A
18.2
30.2
7.8
21.1
1.2
0.8
2010
86
121
0.50
0.27
5.7
6.9
36.6
31.1
N/A
N/A
16.1
N/A
7.1
N/A
N/A
0.7
2009
87
107
0.56
0.31
6.0
7.3
33.3
29.6
N/A
N/A
20.9
N/A
8.3
N/A
N/A
1.6
2008
82
130
0.66
0.33
8.2
9.3
33.0
31.1
N/A
N/A
N/A
N/A
9.2
22.2
N/A
1.0
2007
97
146
0.61
0.34
11.7
10.0
32.4
28.4
N/A
N/A
N/A
N/A
8.6
26.0
0.1
0.7
2006
102
104
0.75
0.36
13.4
11.3
32.7
29.7
0.006
N/A
N/A
N/A
8.3
N/A
0.8
N/A
2005
100
101
0.76
0.33
15.1
10.7
30.2
28.1
N/A
N/A
N/A
N/A
7.8
N/A
5.3
N/A
2004
85
103
0.71
0.34
16.0
11.5
30.6
30.8
N/A
N/A
N/A
N/A
N/A
N/A
1.6
N/A
2003
99
115
0.67
0.44
15.9
15.0
29.8
31.2
N/A
N/A
N/A
N/A
N/A
N/A
1.0
1.2
2002
94
139
0.73
0.43
15.7
15.2
30.6
44.8
N/A
N/A
N/A
N/A
N/A
N/A
0.7
N/A
2001
95
143
0.76
0.42
15.0
15.1
29.4
47.3
N/A
N/A
N/A
N/A
N/A
N/A
1.1
N/A
2000
95
136
0.88
0.51
14.7
15.4
29.7
41.0
N/A
N/A
N/A
N/A
N/A
N/A
0.4
N/A
Natural disasters
Type
Las Vegas
Fresno
Tornado activity compared to U.S. average
2.1%
9.9%
Earthquake activity compared to U.S. average
6,093.4%
8,613%
Natural disasters compared to U.S. average
12%
12%
Transportation
Both cities offer public transport options: Las Vegas transportation is managed by the RTC, with buses being the main mode of public transit. Fresno’s public transportation is managed by Fresno Area Express (FAX), including buses and rideshare modes. The average commute time is shorter in Fresno.
Transport
Type
Las Vegas
Fresno
Amtrak stations
1
1
Amtrak stations nearby
1
2
FAA registered aircraft
1
408
FAA registered aircraft manufacturers and dealers
81
36
Means of transportation to work
Type
Las Vegas
Fresno
Bicycle
0.1%
0.8%
Bus
2.2%
1.3%
Carpooled
10.3%
10.7%
Car alone
82.7%
84.4%
Motorcycle
0.4%
0.2%
Walked
1.4%
1.4%
Average travel time to work
Type
Las Vegas
Fresno
Average
26.3 min
23.7 min
Other means
24 min
21.5 min
Public transportation
49.9 min
45.3 min
Private vehicle occupancy
Type
Las Vegas
Fresno
Average
1.2
1.2
Drove alone
88.9%
88.3%
In 2 person carpool
8.2%
8.5%
In 3 person carpool
2.1%
1.8%
In 4 person carpool
0.2%
0.8%
In 5-6 person carpool
0.4%
0.5%
In 7+ person carpool
0.2%
0.1%
How many people usually rode to work in the car, truck or van.
Real Estate
Compared to Fresno, Las Vegas real estate is typically more affordable and has seen a recent surge in demand. Fresno's real estate market, while relatively stable, has higher prices on average due to California's generally high property prices.
Neighborhoods
Las Vegas includes high-energy areas like the Strip, historic neighborhoods like West Las Vegas, and residential zones such as Summerlin and Henderson. Fresno offers a mix of urban and suburban neighborhoods, with the Tower District known for its nightlife and cultural activities and Woodward Park for its suburban appeal.
Houses and residents
Type
Las Vegas
Fresno
Houses
269,602
188,756
Average household size (people)
2.7
3.1
Median year apartment built
1991
1977
Median year house/condo built
1995
1983
Length of stay in the house since moving in
10.1 years
12.6 years
Houses occupied
250,350 (92.9%)
181,841 (96.3%)
Houses occupied by owners
138,677 (55.4%)
91,233 (50.2%)
Houses occupied by renters
111,673 (44.6%)
90,608 (49.8%)
Median rent asked for vacant for-rent units
$1,176
$958.34
Median monthly housing costs
$1,255
$1,209
Median price asked for vacant for-sale houses and condos
$989,410
$285,919
Estimated median house or condo value
$362,400
$321,300
Median numbers of rooms
5.2
5
Median number of rooms in apartments
4.1
4
Median number of rooms in houses and condos
6.1
5.9
Median house price - detached houses
$439,169
$375,492
Median house price - in 2-unit structures
$161,204
$184,112
Median house price - in 3-to-4-unit structures
$201,871
$196,355
Median house price - in 5 or more unit structures
$327,174
$287,684
Median house price - mobile homes
$113,235
$100,122
Median house price - Townhouses or other attached units
$274,961
$260,277
Median house price - All housing units
$417,434
$358,028
Median house age
27
42
Renting percentage
43.5%
50.9%
Housing density (houses/condos per square mile)
2,379.4
1,808.6
House value disparities
27.1%
29.4%
Household income disparities
47.1%
46.4%
Median household income for houses/condes with a mortgage
$90,388
$97,354
Median household income for apartments without a mortgage
$62,287
$73,445
Housing units without a mortgage
1,172 (1.2%)
1,037 (1.7%)
Housing units with both a second mortgage and home equity loan
4,450 (4.6%)
2,880 (4.8%)
Housing units with a mortgage
95,992 (98.8%)
59,354 (98.3%)
Housing units with a home equity loan
178 (0.2%)
68 (0.1%)
Housing units with a second mortgage
5,092 (5.2%)
4,120 (6.8%)
House/condo owner moved in on average (years ago)
7
10
House/condo renter moved in on average (years ago)
2
3
Housing units lacking complete kitchen facilities
1.3%
1.5%
Housing units lacking complete plumbing facilities
1%
0.4%
Housing units in structures
Housing units in structures
Las Vegas
Fresno
One, detached
61.5%
59.0%
One, attached
5.3%
3.2%
Two
1.3%
3.0%
3 or 4
7.7%
7.8%
5 to 9
8.4%
9.6%
10 to 19
4.8%
3.6%
20 to 49
2.8%
3.4%
50 or more
6.8%
7.5%
Mobile homes
1.4%
2.6%
Boats, RVs, vans, etc.
0.1%
0.1%
Median real estate property taxes paid for housing units
Self-employed workers in own not incorporated business
18,990
14,428
State government workers
6,950
9,836
Unpaid family workers
614
890
Industries and Occupations
The dominant industries in Las Vegas are leisure and hospitality, largely due to a thriving tourist industry. There's also an increasing focus on technology and renewable energy sectors. Fresno's economy is anchored by agriculture, healthcare, retail trade, and education.
Both Las Vegas and Fresno offer robust health care facilities. Las Vegas is home to well-rated healthcare institutions like the Cleveland Clinic while Fresno boasts the Community Regional Medical Center, among others.
Las Vegas displays robust infrastructure, notable for its entertainment facilities - hotels, casinos, restaurants, and theaters. Fresno infrastructure is urban but with a small-town feel, featuring parks, standard roads, shopping centers and hospitals. Both cities have international airports allowing easy travel.
Infrastructure
Type
Las Vegas
Fresno
Hospitals
39
32
TV stations
12
4
Arenas or stadiums
2
2
Bank branches located here
281
98
Bank institutions located here
34
25
Main business address for public companies
57
1
Drinking water stations with no reported violations in the past
32
5
Drinking water stations with reported violations in the past
HMDA - Conventional home purchase loans - Applications denied
Year
Las Vegas
Fresno
1999
2,657
717
2000
579
484
2001
371
462
2002
380
569
2003
3,590
1,510
2004
5,908
2,462
2005
7,894
3,394
2006
6,914
3,441
2007
3,733
2,138
2008
1,431
760
2009
813
354
Culture and Food
Las Vegas is known for its lively culture, including casinos, shows, and nightlife. Food is rich and varied, with choices that cater to all tastes, from gourmet restaurants to buffet dining. Fresno's culture is more relaxed, with farmer's markets, art galleries, and local festivals. Its diverse population gives rise to an array of ethnic foods, especially Mexican and Asian cuisines.
Sports Teams
Las Vegas hosts professional sports teams like the Raiders (NFL), Golden Knights (NHL), and the Aces (WNBA). Fresno, while it does not host any major league teams, is home to minor league teams like the Fresno Grizzlies (baseball) and the Fresno FC (soccer).


 Las Vegas, NV
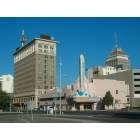
 Fresno, CA