Las Vegas, Nevada and Fontana, California are contrasting cities each with unique attributes making them desirable locations for residents and tourists. While Las Vegas is known as an entertainment and gaming hotspot, Fontana is regarded for its rich history and industrial roots. Each city offers a unique lifestyle, cost of living, and amenities. The comparison takes into account a variety of factors like crime and safety, weather, infrastructure, taxes, healthcare, and more, providing an in-depth look into everyday life in these cities.
Distance between
Las Vegas, NV and
Fontana, CA : 192.2 miles
Las Vegas's population is larger by 207%. Its population has grown by 168,356 people (35.2%) since 2000. The population of Fontana has grown by 81,832 people (63.5%) during that time.
Las Vegas has a higher crime rate compared to Fontana, making safety there an issue. While in general, most tourist areas in Las Vegas are usually safe, petty crimes still occur so caution is advised. On the other hand, Fontana is known as one of the safest cities in San Bernardino County, boasting a relatively low crime rate, making it an attractive place to live for families.
City-data.com crime index counts serious crimes and violent crime more heavily. It adjusts for the number of visitors and daily workers commuting into cities. (higher means more crime, U.S. average = 301.1)
City-data.com crime index counts serious crimes and violent crime more heavily. It adjusts for the number of visitors and daily workers commuting into cities. (higher means more crime, U.S. average = 301.1)
Sex Offenders
According to our data, there are 4,821 registered sex offenders living in Las Vegas and 273 registered sex offenders living in . The ratio of residents to sex offenders in Las Vegas is 131 to 1; the ratio in Fontana is 768 to 1. The number of registered sex offenders compared to the number of residents is much larger in Las Vegas than that in Fontana.
Cost of Living
The cost of living between the two cities differs as well. Overall, Las Vegas has a lower cost of living compared to Fontana. Housing in Las Vegas is relatively affordable and there is no state income tax, which can attract potential residents looking for a lower-cost lifestyle. Meanwhile, Fontana, like most cities in California, has a high cost of living, especially in terms of housing and taxes.
Income Tax
Nevada doesn’t impose an income tax which can be seen as a major advantage for individuals moving to Las Vegas, whereas California has progressive income tax rates and is known for having some of the highest state income taxes in the country.
Property Tax
Las Vegas boasts a lower property tax rate compared to Fontana. The median property tax in Las Vegas is significantly lower, thus making ownership more affordable for potential residents.
Sales Tax
Nevada has a total sales tax rate of 8.25%, higher than Californian statewide sales tax rate of 7.25%. However, in Fontana there is an additional local sales tax that makes the total rate 8.75%.
Income
Type
Las Vegas
Fontana
Estimated median household income
$59,746
$93,851
Estimated per capita income
$33,825
$28,677
Cost of living index (U.S. average is 100)
99.1
82.5
If you make $50,000 in Fontana, you will have to make $60,061 in Las Vegas to maintain the same standard of living.
Geographical Conditions
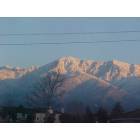
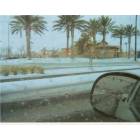
Las Vegas is located in the desert, making it prone to extreme heat and minimal rainfall. Fontana’s geography is more varied, with proximity to both mountains and beaches.
Las Vegas and Fontana both offer vast educational systems. The Clark County School District in Las Vegas is the fifth largest school district in the U.S. But California, as a whole, has better performing schools than Nevada; Fontana provides access to quality education with many schools ranking above average.
Las Vegas’s economy is driven primarily by tourism, entertainment, and gaming. The presence of casinos provides numerous job opportunities. Fontana's economy, however, is more diversified, with significant sectors such as retail, health care and manufacturing providing job opportunities for its residents.
Biggest Employers
The biggest employers in Las Vegas are mainly in the hospitality and gaming industry, with MGM Resorts International and Caesar's Entertainment being among the largest. In Fontana, the largest employers include the Fontana Unified School District and Kaiser Permanente.
There were 2,700 building permits issued in Las Vegas in 2012 (1886 more than in 2011) compared to 652 building permits issued in Fontana in 2012 (516 more than in 2011).
In Las Vegas (Clark County), 56.4% voted for Democrats and 41.8% for Republicans in 2012 Presidential Election. In Fontana (San Bernardino County), 52.3% voted for Democrats and 45.0% for Republicans.
Elections
Type
Democrats
Republicans
Other
Year
Las Vegas
Fontana
Las Vegas
Fontana
Las Vegas
Fontana
2020
53.7%
54.2%
44.3%
43.6%
2.0%
2.2%
2016
52.4%
52.1%
41.7%
41.5%
5.8%
6.4%
2012
56.4%
52.3%
41.8%
45.0%
1.8%
2.6%
2008
58.5%
52.2%
39.5%
45.8%
2.0%
2.0%
2004
51.8%
43.8%
46.9%
55.6%
1.3%
0.6%
2000
51.4%
47.3%
44.8%
48.8%
3.8%
3.9%
1996
75.5%
44.4%
18.8%
43.6%
5.7%
12.1%
Breakdown of population affiliated with a religious congregation
Type
Adherents
Congregations
Religion
Las Vegas
Fontana
Las Vegas
Fontana
CATHOLIC CHURCH
18.1%
21.9%
4.0%
4.3%
SOUTHERN BAPTIST CONVENTION
1.6%
2.2%
11.2%
9.6%
EVANGELICAL LUTHERAN CHURCH IN AMERICA
0.4%
0.2%
1.6%
1.5%
SEVENTH DAY ADVENTIST CHURCH
0.2%
1.6%
1.6%
4.6%
MUSLIM ESTIMATE
0.1%
0.6%
0.6%
1.1%
Weather
The weather varies greatly between the two cities. Las Vegas, situated in the Mojave Desert, experiences a hot desert climate, characterised by hot summers, mild winters, and low humidity. Fontana, on the other hand, has a Mediterranean climate typified by hot summers, mild to cool winters and less temperature fluctuations.
Weather and climate
Type
Las Vegas
Fontana
Temperature - Average
65.5°F
65.6°F
Humidity - Average morning or afternoon humidity
30.7%
65.7%
Humidity - Differences between morning and afternoon humidity
42%
20.4%
Humidity - Maximum monthly morning or afternoon humidity
52%
72%
Humidity - Minimum monthly morning or afternoon humidity
10%
51.6%
Precipitation - Yearly average
5.7 in
22.6 in
Snowfall - Yearly average
1.6 in
0 in
Clouds - Number of days clear of clouds
35.1%
27.5%
Sunshine amount - Average
91.8%
78.3%
Sunshine amount - Differences during a year
16%
21.7%
Sunshine amount - Maximum monthly
92%
84.5%
Sunshine amount - Minimum monthly
76%
62.8%
Wind speed - Average
9.2 mph
4.1 mph
Average climate in Las Vegas, Nevada
Average climate in Fontana, California
Air pollution
Type
AQI
CO
NO2
OZONE
PB
PM10
PM25
SO2
Year
Las Vegas
Fontana
Las Vegas
Fontana
Las Vegas
Fontana
Las Vegas
Fontana
Fontana
Las Vegas
Fontana
Las Vegas
Fontana
Las Vegas
Fontana
2018
100
153
0.42
0.32
13.1
18.3
37.2
30.5
0.006
N/A
24.4
40.7
6.0
14.0
0.7
0.4
2017
101
152
0.29
0.33
13.0
18.3
38.5
32.4
0.004
N/A
20.3
43.5
7.3
15.1
0.8
0.2
2016
97
140
0.38
0.20
11.2
18.2
36.5
31.8
0.006
N/A
20.6
39.6
8.7
14.8
0.8
0.4
2015
92
148
0.36
0.17
12.4
18.7
35.6
31.5
0.004
N/A
18.9
39.2
8.4
15.7
1.2
0.3
2014
91
149
0.40
0.16
10.8
19.9
36.5
31.1
0.006
N/A
21.1
41.8
9.2
16.7
1.4
0.3
2013
103
148
0.45
0.26
9.6
20.6
36.9
29.5
0.006
N/A
22.1
41.0
8.6
15.7
1.5
0.5
2012
94
148
0.49
0.26
5.9
22.1
38.5
30.6
0.007
N/A
21.5
40.4
8.3
17.3
1.4
0.6
2011
85
150
0.40
0.32
5.3
21.1
37.5
30.9
0.006
N/A
18.2
37.7
7.8
19.3
1.2
0.6
2010
86
147
0.50
0.32
5.7
23.2
36.6
30.4
0.008
N/A
16.1
33.3
7.1
18.1
N/A
1.0
2009
87
153
0.56
0.37
6.0
23.7
33.3
29.2
0.009
N/A
20.9
34.9
8.3
19.2
N/A
0.9
2008
82
163
0.66
0.44
8.2
20.4
33.0
29.7
0.010
N/A
N/A
39.3
9.2
19.0
N/A
1.6
2007
97
136
0.61
0.60
11.7
23.4
32.4
28.2
0.012
N/A
N/A
N/A
8.6
N/A
0.1
1.8
2006
102
126
0.75
0.59
13.4
27.0
32.7
27.7
0.007
N/A
N/A
N/A
8.3
N/A
0.8
1.9
2005
100
134
0.76
0.59
15.1
30.7
30.2
26.5
0.012
N/A
N/A
N/A
7.8
N/A
5.3
2.1
2004
85
143
0.71
0.71
16.0
27.0
30.6
28.1
0.013
N/A
N/A
N/A
N/A
N/A
1.6
1.0
2003
99
143
0.67
0.73
15.9
30.1
29.8
27.5
0.018
N/A
N/A
N/A
N/A
N/A
1.0
0.8
2002
94
140
0.73
0.73
15.7
33.3
30.6
27.2
0.016
N/A
N/A
N/A
N/A
N/A
0.7
1.3
2001
95
143
0.76
0.82
15.0
35.5
29.4
25.8
0.029
N/A
N/A
N/A
N/A
N/A
1.1
1.4
2000
95
155
0.88
0.86
14.7
35.7
29.7
24.5
0.034
N/A
N/A
N/A
N/A
N/A
0.4
2.0
Natural disasters
Type
Las Vegas
Fontana
Tornado activity compared to U.S. average
2.1%
17.1%
Earthquake activity compared to U.S. average
6,093.4%
7,438.3%
Natural disasters compared to U.S. average
12%
46%
Transportation
Las Vegas has an extensive public transportation network mainly oriented for tourists, including a monorail system that connects major spots on the Strip. Fontana also has a comprehensive public transport system including buses and Metrolink trains for commuting to different parts of Southern California, including downtown Los Angeles. Additionally, both cities have extensive freeway systems allowing for convenient driving options.
Transport
Type
Las Vegas
Fontana
Amtrak stations
1
0
Amtrak stations nearby
1
3
FAA registered aircraft
1
36
FAA registered aircraft manufacturers and dealers
81
4
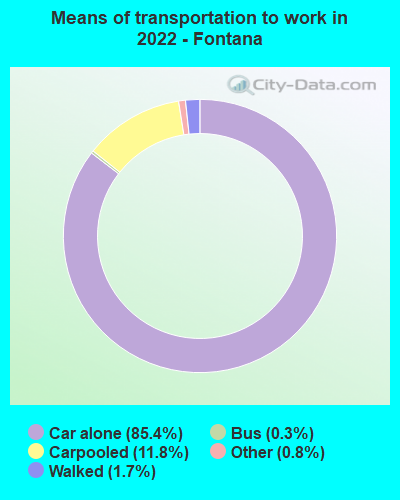
Means of transportation to work
Type
Las Vegas
Fontana
Bicycle
0.1%
0.2%
Bus
2.2%
0.4%
Carpooled
10.3%
11.7%
Car alone
82.7%
84.7%
Motorcycle
0.4%
0.1%
Taxicab
0%
0.1%
Walked
1.4%
1.6%
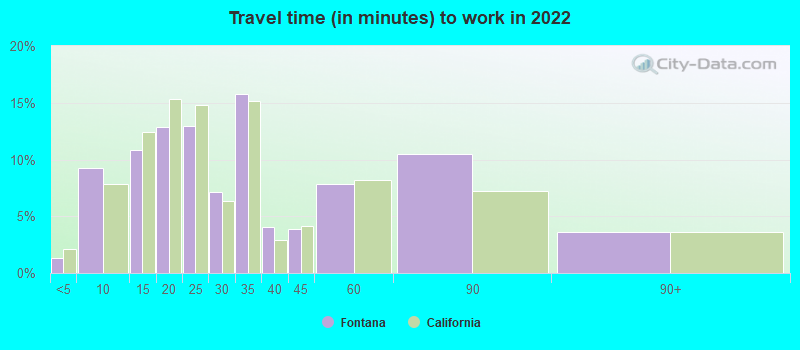
Average travel time to work
Type
Las Vegas
Fontana
Average
26.3 min
30.3 min
Other means
24 min
33.5 min
Public transportation
49.9 min
55.8 min
Private vehicle occupancy
Type
Las Vegas
Fontana
Average
1.2
1.2
Drove alone
88.9%
86%
In 2 person carpool
8.2%
11.5%
In 3 person carpool
2.1%
1.5%
In 4 person carpool
0.2%
0.6%
In 5-6 person carpool
0.4%
0.3%
In 7+ person carpool
0.2%
0%
How many people usually rode to work in the car, truck or van.
Real Estate
Las Vegas's real estate is overall more affordable than Fontana, with a lower median home price. Whether you're a home buyer or renter, Las Vegas provides more reasonable options. On the other hand, Fontana’s real estate is more expensive, paralleling the overall state trend in California, though it is more affordable compared to other cities in the state.
Neighborhoods
Las Vegas offers a diverse range of neighborhoods from the vibrant Strip to the serene Summerlin. However, it's worth noting that certain neighborhoods can be tourist-intensive. Fontana also offers a variety of neighborhoods, many of which are family-friendly and quieter compared to Las Vegas, such as Southridge Village and Sierra Lakes.
Houses and residents
Type
Las Vegas
Fontana
Houses
269,602
58,533
Average household size (people)
2.7
4
Median year apartment built
1991
1983
Median year house/condo built
1995
1994
Length of stay in the house since moving in
10.1 years
12.1 years
Houses occupied
250,350 (92.9%)
57,836 (98.8%)
Houses occupied by owners
138,677 (55.4%)
39,490 (68.3%)
Houses occupied by renters
111,673 (44.6%)
18,346 (31.7%)
Median rent asked for vacant for-rent units
$1,176
$628.91
Median monthly housing costs
$1,255
$1,832
Median price asked for vacant for-sale houses and condos
$989,410
$322,101
Estimated median house or condo value
$362,400
$511,000
Median numbers of rooms
5.2
5.5
Median number of rooms in apartments
4.1
4.3
Median number of rooms in houses and condos
6.1
6
Median house price - detached houses
$439,169
$438,510
Median house price - in 2-unit structures
$161,204
$579,874
Median house price - in 3-to-4-unit structures
$201,871
$426,113
Median house price - in 5 or more unit structures
$327,174
$309,290
Median house price - mobile homes
$113,235
$50,280
Median house price - Townhouses or other attached units
$274,961
$499,707
Median house price - All housing units
$417,434
$431,552
Median house age
27
32
Renting percentage
43.5%
31.1%
Housing density (houses/condos per square mile)
2,379.4
1,620.6
House value disparities
27.1%
19.3%
Household income disparities
47.1%
36.9%
Median household income for houses/condes with a mortgage
$90,388
$105,783
Median household income for apartments without a mortgage
$62,287
$88,893
Housing units without a mortgage
1,172 (1.2%)
356 (1.1%)
Housing units with both a second mortgage and home equity loan
4,450 (4.6%)
846 (2.6%)
Housing units with a mortgage
95,992 (98.8%)
32,565 (98.9%)
Housing units with a home equity loan
178 (0.2%)
0 (0%)
Housing units with a second mortgage
5,092 (5.2%)
1,037 (3.1%)
House/condo owner moved in on average (years ago)
7
9
House/condo renter moved in on average (years ago)
2
5
Housing units lacking complete kitchen facilities
1.3%
1.1%
Housing units lacking complete plumbing facilities
1%
0.6%
Housing units in structures
Housing units in structures
Las Vegas
Fontana
One, detached
61.5%
78.8%
One, attached
5.3%
3.7%
Two
1.3%
0.1%
3 or 4
7.7%
3.8%
5 to 9
8.4%
1.2%
10 to 19
4.8%
1.4%
20 to 49
2.8%
1.2%
50 or more
6.8%
8.2%
Mobile homes
1.4%
1.7%
Boats, RVs, vans, etc.
0.1%
0.0%
Median real estate property taxes paid for housing units
Self-employed workers in own not incorporated business
18,990
4,423
State government workers
6,950
5,298
Unpaid family workers
614
0
Industries and Occupations
Las Vegas's main industries are related to hospitality, gaming and entertainment. It's noteworthy that one of the biggest employers in Las Vegas is the hotel industry. On the contrary, Fontana has a wide range of industries including retail, health care, and manufacturing, and possesses a large warehouse and shipping facilities due to its close proximity to major transportation routes.
In terms of health care, Las Vegas offers many medical facilities but it doesn’t rank high in healthcare quality when compared nationally. Fontana is home to large medical facilities like the Kaiser Permanente Fontana Medical Center that offer a wide range of health care services.
Health (county statistics)
Type
Las Vegas
Fontana
General health status score of residents in this county from 1 (poor) to 5 (excellent)
While both cities have developing infrastructures, they differ in focus. Las Vegas is constantly developing its tourism-related infrastructure, with major investments in hotels and entertainment venues. Fontana, on the other hand, is focused on residential and economic infrastructure, with continuous developments in housing and industry facilities.
HMDA - Conventional home purchase loans - Applications denied
Year
Las Vegas
Fontana
1999
2,657
374
2000
579
127
2001
371
121
2002
380
165
2003
3,590
1,211
2004
5,908
1,684
2005
7,894
2,338
2006
6,914
2,779
2007
3,733
1,535
2008
1,431
555
2009
813
222
Culture and Food
Las Vegas is known for its rich and diverse entertainment culture, with countless shows, concerts, and events. Equally impressive is the food scene that boasts a wide variety of world-class restaurants. Fontana, while quieter, features a more laid-back lifestyle, with ample opportunities for outdoor activities, local eateries, and community festivals celebrating its historic and multicultural roots.
Sports Teams
Las Vegas is home to major professional sports teams, including the Las Vegas Raiders (NFL) and the Vegas Golden Knights (NHL). Fontana, while not home to major sports franchises, is close to Los Angeles, allowing residents easy access to teams like the Los Angeles Lakers (NBA) and the Los Angeles Dodgers (MLB).


 Las Vegas, NV
 Fontana, CA