Kansas City, MO, and Minneapolis, MN, are two vibrant cities offering distinct experiences to both residents and tourists. While both cities have their advantages and unique attractants, your preference may ultimately boil down to factors such as personal preference, lifestyle, and economic considerations. This article aims to provide an in-depth comparison of the two cities across several critical parameters to help you make an informed choice.
Distance between
Kansas City, MO and
Minneapolis, MN : 412.1 miles
Kansas City's population is larger by 20%. Its population has grown by 66,849 people (15.1%) since 2000. The population of Minneapolis has grown by 42,718 people (11.2%) during that time.
Both Kansas City and Minneapolis struggle with crime, but the rates can fluctuate by neighborhood and crime type. While Minneapolis has a lower overall crime rate than Kansas City, the recent rise in violence has been a concern. On the other hand, Kansas City has struggled with a high homicide rate for years. However, both cities are making increasing efforts to reduce these rates through community efforts and law enforcement initiatives. Safety can also vary greatly by neighborhood in both cities.
City-data.com crime index counts serious crimes and violent crime more heavily. It adjusts for the number of visitors and daily workers commuting into cities. (higher means more crime, U.S. average = 301.1)
City-data.com crime index counts serious crimes and violent crime more heavily. It adjusts for the number of visitors and daily workers commuting into cities. (higher means more crime, U.S. average = 301.1)
Sex Offenders
According to our data, there are 1,820 registered sex offenders living in Kansas City and 189 registered sex offenders living in . The ratio of residents to sex offenders in Kansas City is 264 to 1; the ratio in Minneapolis is 2,189 to 1. The number of registered sex offenders compared to the number of residents is much larger in Kansas City than that in Minneapolis.
Cost of Living
Kansas City boasts a lower cost of living as compared to Minneapolis, with housing being the most significant factor in the cost of living difference. Food, entertainment, and other day-to-day costs like groceries are generally cheaper in Kansas City. For those aiming to relocate, this could potentially means more purchasing power in Kansas City.
Income Tax
Income tax must also be considered when comparing the two cities. Missouri's state income tax is 5.4%, while Minnesota has a progressive income tax, with rates ranging from 5.35% to 9.85% for the wealthiest residents.
Property Tax
Minnesota has higher average property tax rates than Missouri. For homeowners, this equates to Minneapolis residents paying a higher annual property tax than those in Kansas City.
Sales Tax
Both cities have relatively high sales tax rates. Kansas City's combined city and state sales tax rate is about 8.49%, while Minneapolis's combined rate is 8.025%. This might influence daily and high-ticket purchases for residents and tourists.
Income
Type
Kansas City
Minneapolis
Estimated median household income
$63,396
$69,397
Estimated per capita income
$36,456
$44,836
Cost of living index (U.S. average is 100)
87.3
115.8
If you make $50,000 in Kansas City, you will have to make $66,323 in Minneapolis to maintain the same standard of living.
Geographical Conditions
Kansas City is characterized by rolling hills and great plains, while Minneapolis lies on both banks of the Mississippi River and has more than 10,000 lakes statewide. This lends to different recreational possibilities in each city: hiking and exploring plains in Kansas City versus boating and lake activities in Minneapolis.
Both cities are served by numerous public and private schools and have access to higher education institutions. Minneapolis is home to the University of Minnesota, while Kansas City hosts the University of Missouri-Kansas City. However, Minneapolis's public schools outperform Kansas City's in standardized tests, possibly indicating a higher quality of K-12 education in Minneapolis.
Both cities have robust economies, but they differ in dominant industries. Kansas City is home to several major companies and is a hub for manufacturing, government services, and trade, while Minneapolis has a diverse economy with strong finance, commerce, health services, and logistics sectors.
Biggest Employers
Kansas City's biggest employers are the federal government, Cerner Corporation (a healthcare IT firm), and BNSF Railway. While in Minneapolis, major employers include the Mayo Clinic, the University of Minnesota, and Target Corporation.
In Kansas City (Jackson County), 58.9% voted for Democrats and 39.3% for Republicans in 2012 Presidential Election. In Minneapolis (Hennepin County), 62.5% voted for Democrats and 35.4% for Republicans.
Elections
Type
Democrats
Republicans
Other
Year
Kansas City
Minneapolis
Kansas City
Minneapolis
Kansas City
Minneapolis
2020
60.1%
70.7%
38.1%
27.4%
1.8%
1.9%
2016
55.5%
63.4%
38.1%
28.3%
6.4%
8.3%
2012
58.9%
62.5%
39.3%
35.4%
1.7%
2.1%
2008
62.1%
63.6%
36.8%
34.9%
1.1%
1.4%
2004
58.2%
59.7%
41.4%
39.7%
0.4%
0.6%
2000
59.0%
53.7%
38.4%
39.4%
2.5%
6.9%
1996
56.2%
54.4%
34.3%
33.2%
9.5%
12.5%
Breakdown of population affiliated with a religious congregation
Type
Adherents
Congregations
Religion
Kansas City
Minneapolis
Kansas City
Minneapolis
CATHOLIC CHURCH
10.3%
18.7%
6.4%
8.7%
SOUTHERN BAPTIST CONVENTION
9.5%
0.1%
13.7%
1.3%
LUTHERAN CHURCH
1.4%
1.6%
1.8%
4.1%
EPISCOPAL CHURCH
0.8%
0.7%
1.7%
2.1%
SEVENTH DAY ADVENTIST CHURCH
0.5%
0.4%
1.0%
2.9%
MUSLIM ESTIMATE
0.4%
0.7%
1.1%
2.7%
SALVATION ARMY
0.4%
0.1%
0.6%
0.4%
AMERICAN BAPTIST CHURCHES IN THE USA
0.3%
0.4%
1.4%
1.3%
EVANGELICAL LUTHERAN CHURCH IN AMERICA
0.2%
10.8%
1.0%
12.6%
WISCONSIN EVANGELICAL LUTHERAN SYNOD
0.0%
0.4%
0.1%
1.4%
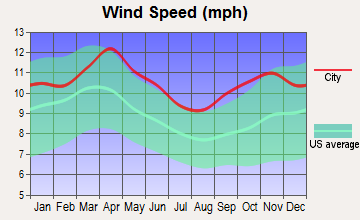
Weather
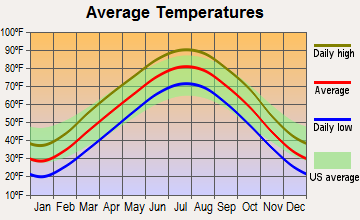
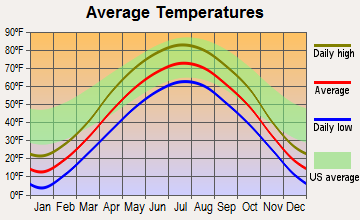
Weather-wise, both places offer all four seasons, but Minneapolis has a much colder winter with higher snowfall. This might appeal to those who enjoy snow sports. Kansas City experiences milder winters but typically has hotter and more humid summers. If less extreme weather is your preference, Kansas City might be a better choice.
Weather and climate
Type
Kansas City
Minneapolis
Temperature - Average
56.2°F
45.3°F
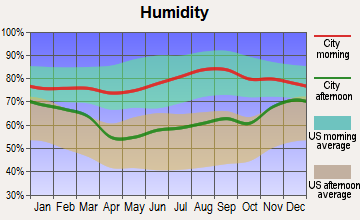
Humidity - Average morning or afternoon humidity
76.3%
74.9%
Humidity - Differences between morning and afternoon humidity
30.1%
33%
Humidity - Maximum monthly morning or afternoon humidity
86%
84%
Humidity - Minimum monthly morning or afternoon humidity
56%
51%
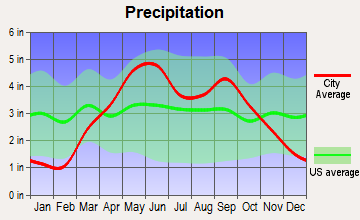
Precipitation - Yearly average
36.3 in
30.4 in
Snowfall - Yearly average
38 in
98.6 in
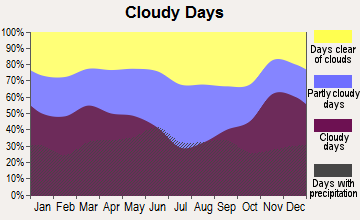
Clouds - Number of days clear of clouds
20.1%
15.8%
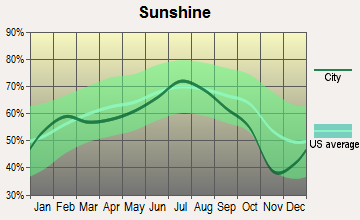
Sunshine amount - Average
67.3%
61.8%
Sunshine amount - Differences during a year
25.9%
37%
Sunshine amount - Maximum monthly
74%
74%
Sunshine amount - Minimum monthly
48%
37%
Wind speed - Average
11.2 mph
10.5 mph
Average climate in Kansas City, Missouri
Average climate in Minneapolis, Minnesota
Air pollution
Type
AQI
CO
NO2
OZONE
PB
PM10
PM25
SO2
Year
Kansas City
Minneapolis
Kansas City
Minneapolis
Kansas City
Minneapolis
Kansas City
Minneapolis
Minneapolis
Kansas City
Minneapolis
Kansas City
Minneapolis
Kansas City
Minneapolis
2018
89
81
0.29
0.24
11.1
14.1
29.6
28.2
N/A
N/A
24.5
20.4
7.4
8.5
0.9
1.3
2017
88
71
0.29
0.26
11.6
13.4
30.4
27.9
N/A
N/A
26.7
17.5
10.0
7.8
1.4
1.4
2016
85
76
0.30
0.28
12.0
12.6
28.9
26.7
N/A
N/A
24.9
16.7
9.0
7.3
1.5
1.5
2015
90
80
0.30
0.28
12.9
13.8
28.9
27.8
N/A
N/A
33.6
19.4
8.3
8.8
4.6
1.1
2014
90
83
0.28
0.25
13.0
15.9
28.6
26.8
N/A
N/A
28.5
21.2
9.3
7.0
5.0
1.0
2013
88
81
0.41
N/A
13.2
12.8
29.3
32.1
N/A
N/A
30.8
20.9
10.3
6.7
5.6
0.9
2012
105
80
0.52
N/A
14.2
7.7
31.9
29.0
N/A
N/A
N/A
23.8
10.3
8.4
6.4
0.2
2011
108
90
0.45
0.22
15.0
7.8
29.9
29.7
N/A
N/A
N/A
23.4
10.9
9.8
4.8
0.1
2010
97
101
0.40
N/A
15.0
9.6
27.4
27.8
0.003
N/A
N/A
24.7
11.9
9.6
5.4
0.5
2009
96
103
0.29
N/A
14.8
7.4
28.3
N/A
0.004
N/A
N/A
21.4
9.6
9.4
6.1
1.1
2008
89
92
0.40
N/A
17.0
8.8
25.7
N/A
0.003
N/A
N/A
18.3
11.5
10.1
6.0
1.0
2007
104
102
0.42
N/A
18.4
9.2
29.1
N/A
0.003
N/A
N/A
21.6
13.1
11.6
4.2
0.6
2006
104
88
0.36
N/A
18.5
9.5
29.2
N/A
0.006
N/A
N/A
20.5
12.4
10.5
5.1
1.8
2005
105
107
0.55
N/A
18.3
12.3
28.4
N/A
0.004
N/A
N/A
22.0
N/A
10.6
4.5
2.1
2004
83
103
0.45
N/A
11.6
11.0
26.2
N/A
0.005
N/A
N/A
23.9
N/A
10.5
4.0
3.3
2003
99
114
0.41
N/A
10.9
12.5
28.0
N/A
0.004
N/A
N/A
25.9
N/A
11.9
3.0
3.0
2002
100
95
0.40
0.42
8.9
15.7
27.0
N/A
0.007
N/A
N/A
N/A
N/A
10.9
2.5
1.8
2001
88
82
0.52
0.75
7.9
17.5
27.0
32.4
0.011
N/A
N/A
N/A
N/A
9.3
1.2
2.0
2000
102
68
0.75
0.75
8.8
16.6
29.2
31.2
0.009
N/A
N/A
N/A
N/A
N/A
2.2
2.8
Natural disasters
Type
Kansas City
Minneapolis
Tornado activity compared to U.S. average
200.4%
129.9%
Earthquake activity compared to U.S. average
598.9%
44.5%
Natural disasters compared to U.S. average
24%
17%
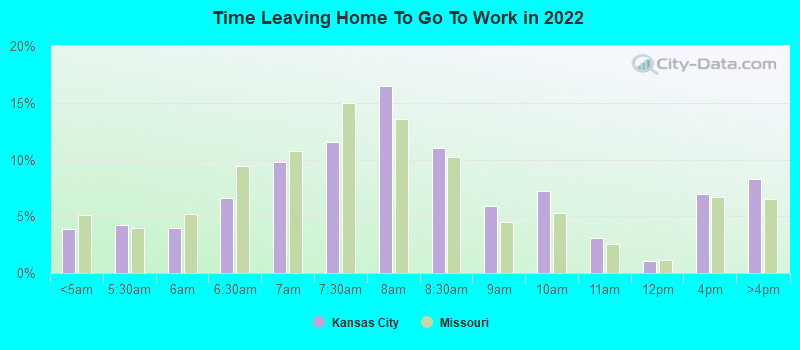
Transportation
While both cities offer public transportation, Minneapolis has a more developed system that includes buses, a light rail, and commuter trains. Kansas City's public transit is primarily bus-based, supplemented by a downtown streetcar line. Traffic in both cities can peak during rush hours but is generally manageable.
Transport
Type
Kansas City
Minneapolis
Amtrak stations
1
0
Amtrak stations nearby
3
1
FAA registered aircraft
0
284
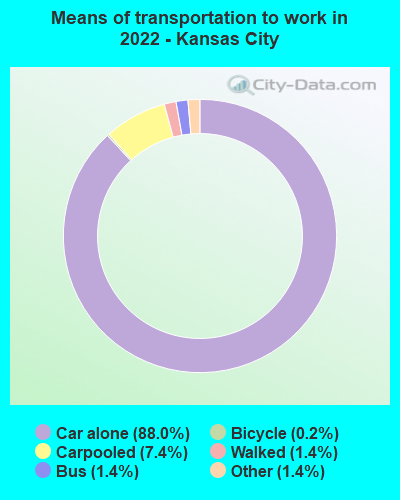
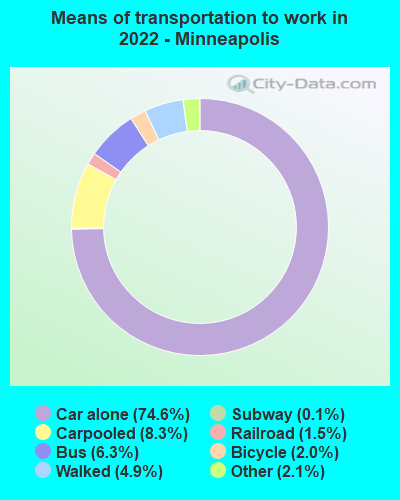
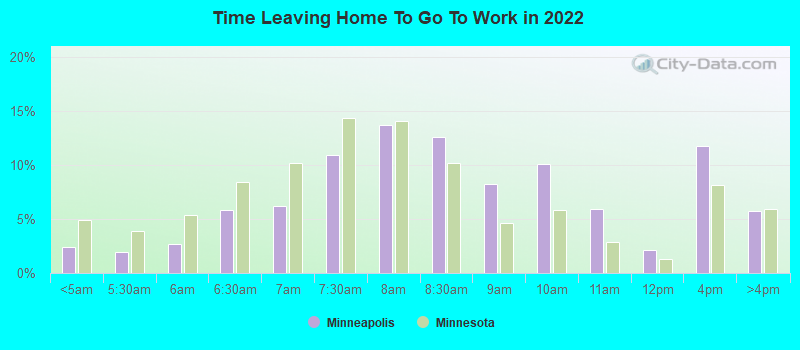
Means of transportation to work
Type
Kansas City
Minneapolis
Bicycle
0.4%
1.9%
Bus
1.5%
6.6%
Carpooled
8.7%
9%
Car alone
86.8%
74.3%
Motorcycle
0.1%
0.1%
Railroad
0%
0.6%
Subway
0%
0.2%
Taxicab
0.2%
0.2%
Walked
1.3%
5.2%
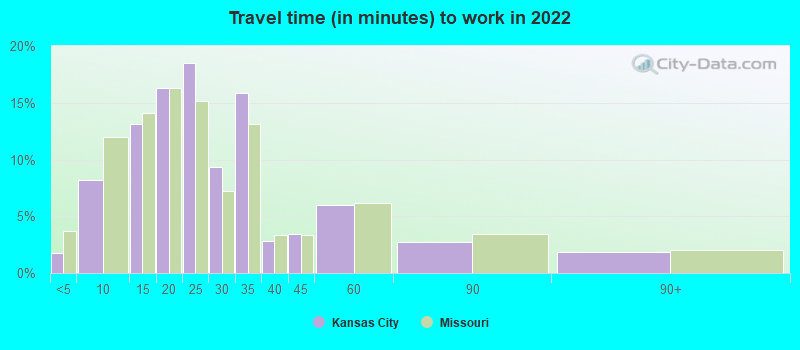
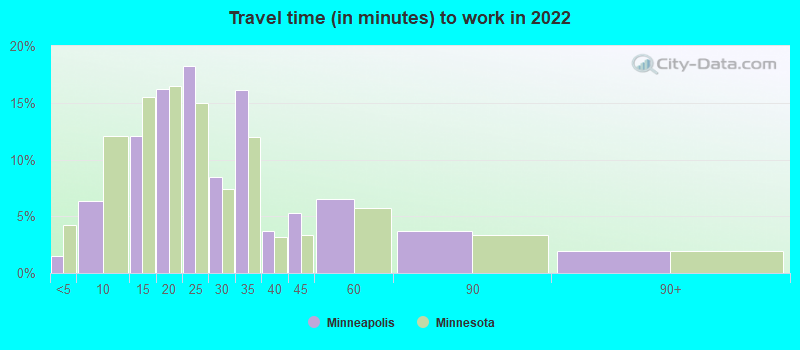
Average travel time to work
Type
Kansas City
Minneapolis
Average
25.5 min
27.4 min
Other means
21.7 min
20.3 min
Public transportation
38.9 min
32.6 min
Private vehicle occupancy
Type
Kansas City
Minneapolis
Average
1.1
1.2
Drove alone
89.4%
87.5%
In 2 person carpool
8%
10.3%
In 3 person carpool
2.1%
1%
In 4 person carpool
0.3%
0.8%
In 5-6 person carpool
0.2%
0.4%
How many people usually rode to work in the car, truck or van.
Real Estate
When it comes to real estate, the median home cost in Kansas City is lower than in Minneapolis. Rental prices are typically lower too, making Kansas City a more affordable choice for those looking for housing. However, Minneapolis offers a greater diversity of architectural styles, especially in urban neighborhoods.
Neighborhoods
Both cities have a mix of urban and suburban neighborhoods, each with its unique character. In Kansas City, areas like the Country Club Plaza are known for their charming architecture and upscale living, while Minneapolis's Uptown neighborhood is a hub for nightlife and young professionals.
Houses and residents
Type
Kansas City
Minneapolis
Houses
243,950
203,633
Average household size (people)
2.3
2.2
Median year apartment built
1975
1967
Length of stay in the house since moving in
12 years
13 years
Houses occupied
219,020 (89.8%)
188,681 (92.7%)
Houses occupied by owners
118,384 (54.1%)
93,981 (49.8%)
Houses occupied by renters
100,636 (45.9%)
94,700 (50.2%)
Median rent asked for vacant for-rent units
$933.71
$1,777
Median monthly housing costs
$1,092
$1,369
Median price asked for vacant for-sale houses and condos
$71,644
$238,504
Estimated median house or condo value
$213,400
$319,100
Median numbers of rooms
5.5
4.8
Median number of rooms in apartments
4.3
3.3
Median number of rooms in houses and condos
6.6
6.4
Median house price - detached houses
$250,072
$398,431
Median house price - in 2-unit structures
$212,485
$353,466
Median house price - in 3-to-4-unit structures
$147,015
$335,939
Median house price - in 5 or more unit structures
$274,597
$317,891
Median house price - mobile homes
$19,650
$9,605
Median house price - Townhouses or other attached units
$203,232
$376,360
Median house price - All housing units
$247,285
$383,883
Median house age
52
70
Renting percentage
43.8%
50.8%
Housing density (houses/condos per square mile)
778
3,709.7
House value disparities
36%
30.1%
Household income disparities
43.9%
45.3%
Median household income for houses/condes with a mortgage
$96,255
$113,268
Median household income for apartments without a mortgage
$64,961
$70,111
Housing units without a mortgage
1,566 (2%)
1,756 (2.5%)
Housing units with both a second mortgage and home equity loan
5,650 (7.2%)
6,107 (8.7%)
Housing units with a mortgage
77,422 (98%)
68,555 (97.5%)
Housing units with a home equity loan
403 (0.5%)
203 (0.3%)
Housing units with a second mortgage
6,848 (8.7%)
7,699 (10.9%)
House/condo owner moved in on average (years ago)
9
10
House/condo renter moved in on average (years ago)
1
1
Housing units lacking complete kitchen facilities
3.8%
0.7%
Housing units lacking complete plumbing facilities
2.2%
0.4%
Housing units in structures
Housing units in structures
Kansas City
Minneapolis
One, detached
60.7%
41.8%
One, attached
3.9%
3.6%
Two
3.1%
7.4%
3 or 4
4.4%
3.8%
5 to 9
5.8%
3.7%
10 to 19
6.2%
6.2%
20 to 49
5.8%
9.8%
50 or more
9.3%
23.3%
Mobile homes
0.6%
0.3%
Boats, RVs, vans, etc.
0.1%
0.0%
Median real estate property taxes paid for housing units
Self-employed workers in own not incorporated business
13,035
13,397
State government workers
6,835
12,526
Unpaid family workers
197
516
Industries and Occupations
In Kansas City, job seekers often find opportunities in manufacturing, government services, and trade. Meanwhile, in Minneapolis, finance, commerce, and health services are key industry sectors. Both cities enjoy a healthy mix of white-collar and blue-collar jobs.
Both cities have access to quality healthcare. Minneapolis, being the headquarters of the Mayo Clinic, offers world-renowned care, while Kansas City, home to the University of Kansas Hospital, consistently ranks as one of the best hospitals in the country.
Health (county statistics)
Type
Kansas City
Minneapolis
General health status score of residents in this county from 1 (poor) to 5 (excellent)
Both Minneapolis and Kansas City boast well-developed infrastructure systems, including substantial downtown areas, highways, and plenty of public spaces, such as parks and sports facilities. Minneapolis has a somewhat more developed public transportation system, including a light rail transit system, which Kansas City lacks.
Infrastructure
Type
Kansas City
Minneapolis
Hospitals
30
17
TV stations
14
17
Arenas or stadiums
2
4
Bank branches located here
140
86
Bank institutions located here
41
26
Main business address for public companies
27
59
Drinking water stations with no reported violations in the past
0
10
Drinking water stations with reported violations in the past
HMDA - Conventional home purchase loans - Applications denied
Year
Kansas City
Minneapolis
1999
1,565
1,420
2000
1,758
428
2001
1,494
294
2002
1,380
272
2003
1,975
1,151
2004
3,011
1,818
2005
3,470
3,008
2006
3,499
3,221
2007
2,228
1,812
2008
742
710
2009
447
372
Culture and Food
When it comes to culture and food, both cities offer a rich and diverse experience. Kansas City is known for its jazz music and barbeque, while Minneapolis is famous for its vibrant music scene and international cuisine. Both cities also have numerous museums, theaters, and cultural spots.
Sports Teams
Both cities are home to professional sports teams. Kansas City is home to the Chiefs (NFL) and Royals (MLB), meanwhile Minneapolis hosts the Vikings (NFL), Twins (MLB), and Timberwolves (NBA). Both cities have passionate sports cultures that bring the community together in celebration and competition.


 Kansas City, MO
 Minneapolis, MN