Jacksonville, FL and St. Paul, MN provide unique experiences due to their geographical locations and communities. Jacksonville's warm climate attracts individuals who enjoy outdoor activities, while St. Paul's cold winters appeal to winter sports enthusiasts. The cost of living, job opportunities, and cultural traditions also significantly differ. However, careful consideration should be put into each city's education, healthcare, and safety records before making the final relocation decision. For tourists, both cities offer rich histories, vibrant cultures, and sports.
Distance between
Jacksonville, FL and
St. Paul, MN : 1,186.9 miles
Jacksonville's population is larger by 211%. Its population has grown by 218,997 people (29.8%) since 2000. The population of St. Paul has grown by 20,042 people (7.0%) during that time.
Despite efforts to improve, Jacksonville's crime rate remains above the national average. It may not be the ideal choice for those concerned about safety. Meanwhile, St. Paul has a lower crime rate, but the difference is not significantly large. Tourists are advised to follow safety precautions in both cities and stay within well-known areas.
Cost of Living
When compared with the national average, Jacksonville has a lower cost of living. Affordable housing and daily expenses make it attractive for households on a budget. Conversely, St. Paul's cost of living is slightly higher than the national average, particularly in terms of housing.
Income Tax
Florida has no state income tax, which positively impacts Jacksonville residents. Minnesota’s state income tax rate is progressive and can be high for higher-income earners, affecting St. Paul residents more significantly.
Property Tax
Residents of Jacksonville and St. Paul both face property taxes. However, homeowners in Jacksonville typically pay less property tax than those in St. Paul due to the state policies and lower home values.
Sales Tax
Florida has no state income tax, making Jacksonville a desirable location for wage earners. On the other hand, Minnesota has a fairly high state income tax. The sales tax is 6.5% in Jacksonville and 6.875% in St. Paul.
Income
Type
Jacksonville
St. Paul
Estimated median household income
$58,621
$66,098
Estimated per capita income
$32,953
$36,313
Cost of living index (U.S. average is 100)
88.3
114.5
If you make $50,000 in Jacksonville, you will have to make $64,836 in St. Paul to maintain the same standard of living.
Geographical Conditions
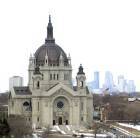
Jacksonville boasts miles of beautiful coastline and the St. Johns River running through it. St. Paul is situated along the Mississippi River and has numerous parks and lakes within city limits.
Jacksonville has a mix of public, private, and charter schools along with several colleges. St. Paul is known for its high-quality education system, housing some of the best universities in the country, such as the University of Minnesota.
Jacksonville's economy relies on the military, healthcare, services, and logistics industries. Job opportunities are plentiful, with unemployment below the national rate. Similarly, St. Paul's economy is robust, with healthcare, education, government and retail trade being major sectors.
Biggest Employers
Jacksonville's biggest employers are Naval Air Station, Duval County Public Schools, and City of Jacksonville. In St. Paul, top employers include the State of Minnesota, Allina Health System, and St. Paul Public Schools.
There were 1,310 building permits issued in Jacksonville in 2012 (353 more than in 2011) compared to 77 building permits issued in St. Paul in 2012 (46 more than in 2011).
In Jacksonville (Duval County), 47.9% voted for Democrats and 51.5% for Republicans in 2012 Presidential Election. In St. Paul (Ramsey County), 66.6% voted for Democrats and 31.2% for Republicans.
Elections
Type
Democrats
Republicans
Other
Year
Jacksonville
St. Paul
Jacksonville
St. Paul
Jacksonville
St. Paul
2020
51.3%
71.8%
47.5%
26.3%
1.2%
1.9%
2016
47.2%
65.2%
48.6%
26.0%
4.2%
8.8%
2012
47.9%
66.6%
51.5%
31.2%
0.6%
2.2%
2008
49.0%
66.2%
51.0%
32.2%
0.0%
1.6%
2004
41.7%
63.5%
57.9%
35.9%
0.3%
0.7%
2000
40.9%
57.0%
57.7%
36.1%
1.4%
7.0%
1996
44.2%
58.7%
50.0%
29.3%
5.8%
12.0%
Breakdown of population affiliated with a religious congregation
Type
Adherents
Congregations
Religion
Jacksonville
St. Paul
Jacksonville
St. Paul
SOUTHERN BAPTIST CONVENTION
15.8%
0.2%
22.3%
1.8%
CATHOLIC CHURCH
9.0%
24.5%
2.8%
11.5%
EPISCOPAL CHURCH
1.2%
1.1%
2.3%
3.2%
MUSLIM ESTIMATE
0.7%
0.8%
0.6%
1.3%
EVANGELICAL LUTHERAN CHURCH IN AMERICA
0.3%
7.8%
0.9%
14.2%
LUTHERAN CHURCH
0.3%
1.4%
0.7%
3.7%
SEVENTH DAY ADVENTIST CHURCH
0.3%
0.1%
1.4%
1.6%
AMERICAN BAPTIST CHURCHES IN THE USA
0.1%
0.7%
0.2%
3.4%
SALVATION ARMY
0.0%
0.4%
0.1%
0.8%
WISCONSIN EVANGELICAL LUTHERAN SYNOD
0.0%
0.6%
0.2%
2.1%
Weather
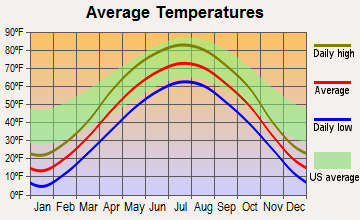
Jacksonville flaunts warm weather and beaches for those who enjoy spending time outdoors. On the other hand, St. Paul experiences four distinct seasons, with temperatures dropping below freezing in winter. Those who enjoy winter sports might prefer St. Paul over Jacksonville.
Weather and climate
Type
Jacksonville
St. Paul
Temperature - Average
68.3°F
45.6°F
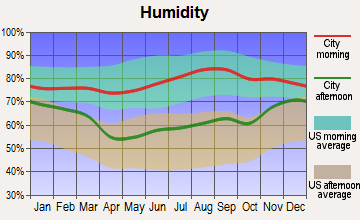
Humidity - Average morning or afternoon humidity
78.4%
74.9%
Humidity - Differences between morning and afternoon humidity
44%
33%
Humidity - Maximum monthly morning or afternoon humidity
92%
84%
Humidity - Minimum monthly morning or afternoon humidity
48%
51%
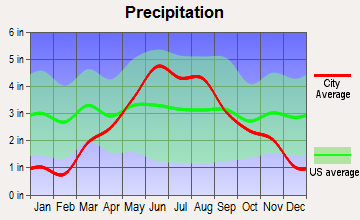
Precipitation - Yearly average
51.8 in
31.8 in
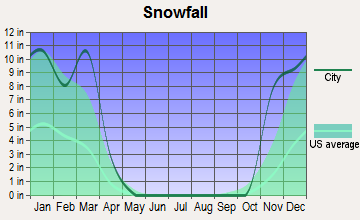
Snowfall - Yearly average
0 in
98.6 in
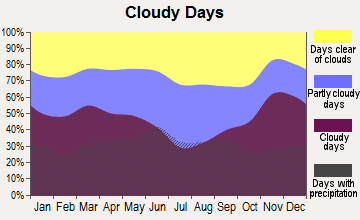
Clouds - Number of days clear of clouds
15.8%
15.8%
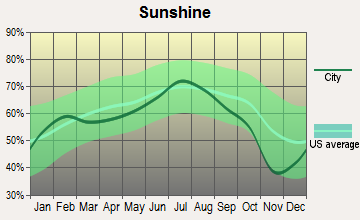
Sunshine amount - Average
69.6%
61.8%
Sunshine amount - Differences during a year
16%
37%
Sunshine amount - Maximum monthly
74%
74%
Sunshine amount - Minimum monthly
58%
37%
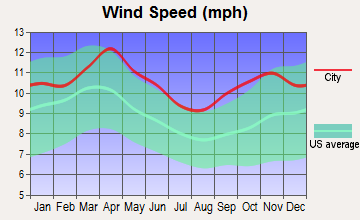
Wind speed - Average
7.2 mph
10.5 mph
Average climate in Jacksonville, Florida
Average climate in St. Paul, Minnesota
Air pollution
Type
AQI
CO
NO2
OZONE
PB
PM10
PM25
SO2
Year
Jacksonville
St. Paul
Jacksonville
St. Paul
St. Paul
Jacksonville
St. Paul
Jacksonville
St. Paul
St. Paul
Jacksonville
St. Paul
Jacksonville
St. Paul
2018
78
81
N/A
0.24
11.6
N/A
24.5
28.2
N/A
N/A
20.4
N/A
7.1
8.5
N/A
1.0
2017
74
71
N/A
0.26
11.9
N/A
24.7
27.9
N/A
N/A
19.5
N/A
5.8
7.5
0.7
1.2
2016
65
76
0.50
0.28
11.2
N/A
24.9
26.7
N/A
N/A
18.2
N/A
5.2
6.8
0.4
1.2
2015
63
80
0.35
0.28
12.4
N/A
25.4
27.8
N/A
N/A
21.3
N/A
4.9
7.5
0.3
1.0
2014
66
83
0.27
0.25
14.2
N/A
24.3
26.8
N/A
N/A
23.1
N/A
5.9
8.1
0.7
0.9
2013
68
81
0.18
N/A
11.6
N/A
23.0
32.1
N/A
N/A
22.6
N/A
5.3
7.2
0.7
0.9
2012
66
80
0.10
N/A
7.7
N/A
24.0
29.0
N/A
N/A
25.6
N/A
5.8
8.3
0.6
0.2
2011
88
90
0.28
0.22
7.8
N/A
26.6
30.1
N/A
N/A
25.4
N/A
8.1
10.0
0.8
0.3
2010
77
101
0.31
N/A
9.6
N/A
26.4
28.3
N/A
0.002
24.7
N/A
7.1
11.1
0.8
0.5
2009
72
103
0.16
N/A
7.4
N/A
25.0
N/A
N/A
0.002
21.4
N/A
8.5
11.0
0.6
1.1
2008
75
92
0.15
N/A
8.8
N/A
27.6
N/A
N/A
0.004
18.3
N/A
10.0
11.0
0.9
1.0
2007
92
102
0.29
N/A
9.2
N/A
28.4
N/A
N/A
0.004
21.6
N/A
11.4
11.4
1.2
0.6
2006
87
88
0.35
N/A
9.5
N/A
29.0
N/A
N/A
0.007
20.5
N/A
10.8
10.4
1.4
1.2
2005
93
107
0.42
N/A
12.3
N/A
26.5
N/A
N/A
0.004
22.0
N/A
12.2
12.1
1.8
1.5
2004
92
103
0.40
N/A
11.0
N/A
25.2
N/A
N/A
0.004
23.9
N/A
12.4
11.9
1.4
2.3
2003
55
114
0.43
N/A
12.5
N/A
21.6
N/A
N/A
0.004
25.9
N/A
N/A
13.0
1.6
2.2
2002
59
95
0.49
0.42
15.7
N/A
22.2
N/A
0.003
0.006
N/A
N/A
N/A
11.1
1.7
1.1
2001
74
82
0.49
0.75
17.5
N/A
24.0
32.4
0.009
0.011
N/A
N/A
N/A
9.3
2.5
1.1
2000
85
68
0.52
0.75
16.6
N/A
25.1
31.2
0.017
0.009
N/A
N/A
N/A
N/A
3.0
1.4
Natural disasters
Type
Jacksonville
St. Paul
Tornado activity compared to U.S. average
75.2%
129.5%
Earthquake activity compared to U.S. average
18.1%
43.1%
Natural disasters compared to U.S. average
24%
18%
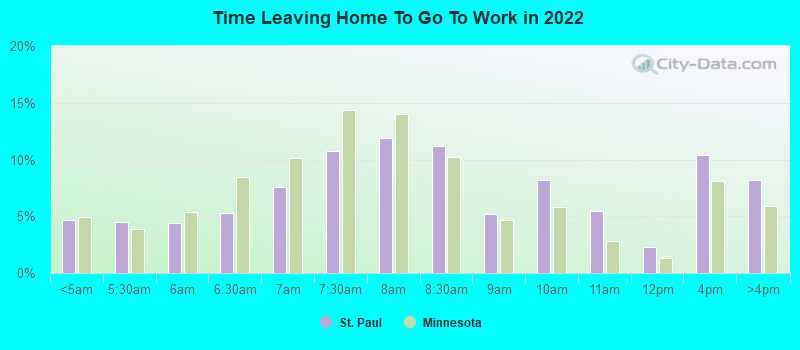
Transportation
The city of Jacksonville has an extensive roadway system and a monorail system downtown. St. Paul residents mainly rely on car transportation but also have access to light rail and bus services.
Transport
Type
Jacksonville
St. Paul
Amtrak stations
1
1
Amtrak stations nearby
1
1
FAA registered aircraft
566
0
FAA registered aircraft manufacturers and dealers
34
0
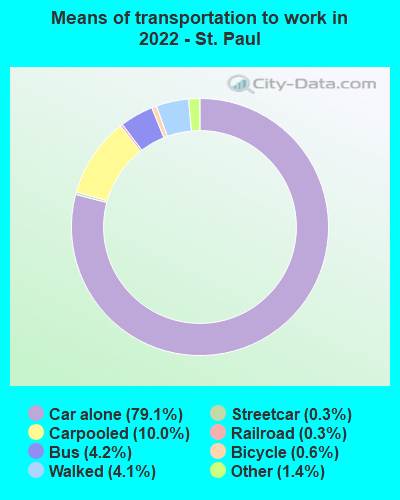
Means of transportation to work
Type
Jacksonville
St. Paul
Bicycle
0.2%
1%
Bus
1.1%
4.4%
Carpooled
9%
9.4%
Car alone
86.5%
79.9%
Motorcycle
0.2%
0.1%
Railroad
0%
0.2%
Taxicab
0.2%
0.2%
Walked
1.2%
3.7%
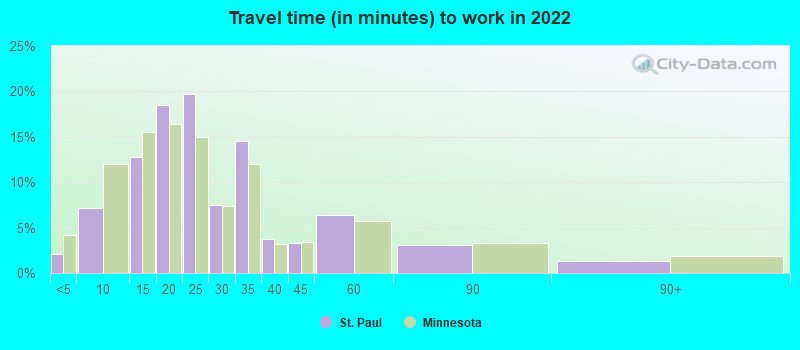
Average travel time to work
Type
Jacksonville
St. Paul
Average
27.5 min
25.8 min
Other means
25 min
20.7 min
Public transportation
43.7 min
34.4 min
Private vehicle occupancy
Type
Jacksonville
St. Paul
Average
1.1
1.2
Drove alone
89.4%
87.5%
In 2 person carpool
8%
9.4%
In 3 person carpool
1.7%
2%
In 4 person carpool
0.7%
0.6%
In 7+ person carpool
0.2%
0.3%
How many people usually rode to work in the car, truck or van.
Real Estate
Real estate in Jacksonville is more affordable than St. Paul with a median home cost lower than the national average. St. Paul's real estate market is slightly more expensive, but the city boasts a variety of housing options from condos to single-family homes.
Neighborhoods
Jacksonville has a diverse range of neighborhoods from the artsy Riverside to the upscale San Marco. Similarly, St. Paul has distinct areas such as the family-friendly Macalester-Groveland and the hip Lowertown district.
Houses and residents
Type
Jacksonville
St. Paul
Houses
422,315
131,275
Average household size (people)
2.5
2.5
Median year apartment built
1985
1966
Length of stay in the house since moving in
12.5 years
12.8 years
Houses occupied
386,283 (91.5%)
121,964 (92.9%)
Houses occupied by owners
226,429 (58.6%)
67,642 (55.5%)
Houses occupied by renters
159,854 (41.4%)
54,322 (44.5%)
Median rent asked for vacant for-rent units
$1,444
$1,437
Median monthly housing costs
$1,154
$1,207
Median price asked for vacant for-sale houses and condos
$260,045
$431,254
Estimated median house or condo value
$239,400
$267,700
Median numbers of rooms
5.6
5.1
Median number of rooms in apartments
4.3
3.7
Median number of rooms in houses and condos
6.3
6.5
Median house price - detached houses
$282,276
$311,442
Median house price - in 2-unit structures
$177,341
$296,942
Median house price - in 3-to-4-unit structures
$144,947
$253,376
Median house price - in 5 or more unit structures
$220,508
$282,309
Median house price - Townhouses or other attached units
$213,709
$352,916
Median house price - All housing units
$266,926
$309,562
Median house age
36
67
Renting percentage
38.3%
48.7%
Housing density (houses/condos per square mile)
557.4
2,487.8
House value disparities
33.2%
29.1%
Household income disparities
44.2%
44.1%
Median household income for houses/condes with a mortgage
$83,160
$95,328
Median household income for apartments without a mortgage
$59,777
$76,318
Housing units without a mortgage
2,439 (1.6%)
934 (1.9%)
Housing units with both a second mortgage and home equity loan
8,460 (5.5%)
3,112 (6.5%)
Housing units with a mortgage
150,468 (98.4%)
47,031 (98.1%)
Housing units with a home equity loan
255 (0.2%)
441 (0.9%)
Housing units with a second mortgage
11,378 (7.4%)
4,559 (9.5%)
House/condo owner moved in on average (years ago)
10
10
House/condo renter moved in on average (years ago)
1
2
Housing units lacking complete kitchen facilities
1.5%
1.2%
Housing units lacking complete plumbing facilities
1.4%
0.2%
Housing units in structures
Housing units in structures
Jacksonville
St. Paul
One, detached
59.4%
50.0%
One, attached
6.1%
3.7%
Two
2.1%
6.4%
3 or 4
5.3%
4.0%
5 to 9
5.0%
4.9%
10 to 19
7.9%
6.0%
20 to 49
4.9%
7.5%
50 or more
5.3%
17.2%
Mobile homes
3.8%
0.2%
Boats, RVs, vans, etc.
0.2%
0.0%
Median real estate property taxes paid for housing units
Self-employed workers in own not incorporated business
19,601
6,217
State government workers
13,692
9,418
Unpaid family workers
1,066
0
Industries and Occupations
In Jacksonville, top industries include healthcare & social assistance, retail trade, and accommodation & food services. Meanwhil, in St. Paul, leading industries are healthcare & social assistance, educational services, and professional, scientific, & technical services.
Health care in Jacksonville is robust with large hospitals and a strong healthcare industry. St. Paul's health care sector is equally strong, with renowned institutions like the Allina Health System and HealthPartners.
Health (county statistics)
Type
Jacksonville
St. Paul
General health status score of residents in this county from 1 (poor) to 5 (excellent)
Both cities have well-developed infrastructures. Jacksonville’s airport and seaport make it a vital transport hub, while St. Paul's light rail system offers easy access to Minneapolis and a well-maintained road network.
Infrastructure
Type
Jacksonville
St. Paul
TV stations
17
18
Arenas or stadiums
2
1
Bank branches located here
191
12
Bank institutions located here
31
8
Drinking water stations with no reported violations in the past
20
2
Drinking water stations with reported violations in the past
HMDA - Conventional home purchase loans - Applications denied
Year
Jacksonville
St. Paul
1999
5,422
808
2000
4,132
747
2001
3,038
597
2002
2,017
577
2003
3,563
841
2004
4,781
1,156
2005
7,134
1,803
2006
8,812
1,781
2007
5,298
1,123
2008
1,719
467
2009
676
216
Culture and Food
Jacksonville offers a blend of Southern and coastal cuisines. The art and music scenes are thriving, bringing diversity to the cultural landscape. St. Paul is known for its vibrant culture, with strong influences from the city's German, Irish, and Hmong populations evident in the food and festivals.
Sports Teams
Sports fans will enjoy living in either city. Jacksonville is home to the NFL's Jaguars, while St. Paul hosts NHL's Wild and shares the MLB's Twins and NFL's Vikings with neighboring Minneapolis.


 Jacksonville, FL
 St. Paul, MN