When deciding between relocating to Jacksonville, Florida, or Rochester, New York, there are several factors to be considered. These include crime and safety, weather, cost of living, education, work and economy, infrastructure, industries, major employers, real estate, neighborhoods, transportation, taxes, culture, sports teams, geography, and health care. Both cities offer unique opportunities and challenges, and this comparison analysis will provide an in-depth look at these factors, aiding in making an informed decision.
Distance between
Jacksonville, FL and
Rochester, NY : 915.1 miles
Jacksonville's population is larger by 353%. Its population has grown by 218,997 people (29.8%) since 2000. The population of Rochester has decreased by 9,167 people (4.2%) during that time.
Both cities have crime rates slightly higher than the national average, with Jacksonville reporting a higher rate of violent crime. However, certain neighborhoods in both cities report lower crime rates, highlighting the importance of careful selection when relocating. Tourists in both cities are generally safe, given they stick to well-trafficked areas and exercise standard precautions.
Cost of Living
The cost of living in Jacksonville is generally lower compared to Rochester. This includes housing, groceries, and utilities. However, healthcare costs are slightly higher in Jacksonville.
Income Tax
Another taxation advantage for Jacksonville, as Florida does not have a state income tax, while New York does.
Property Tax
However, Jacksonville residents face a higher median property tax rate than Rochester homeowners. New York offers some property tax relief programs, which may nullify some of the burden.
Sales Tax
Florida has a lower state sales tax rate compared to New York, which is an advantage for Jacksonville. Both cities charge additional local sales taxes.
Income
Type
Jacksonville
Rochester
Estimated median household income
$58,621
$41,980
Estimated per capita income
$32,953
$26,950
Cost of living index (U.S. average is 100)
88.3
102.1
If you make $50,000 in Jacksonville, you will have to make $57,814 in Rochester to maintain the same standard of living.
Geographical Conditions
Jacksonville offers beautiful beachfront vistas and is the largest city in the Continental U.S. by land area. Rochester is located on the southern Lake Ontario shoreline, providing stunning waterfront scenes as well.
Rochester boasts a strong education system, including the well-respected University of Rochester and Rochester Institute of Technology. Jacksonville also has good education opportunities, with the University of North Florida and Jacksonville University among others. However, high school graduation rates are slightly higher in Rochester.
Rochester's economy is well-diversified, boasting sectors like healthcare, education, and manufacturing. Jacksonville's economy is more focused on sectors like healthcare, finance, and logistics. Both cities have similar unemployment rates, slightly above the national average.
Biggest Employers
In Jacksonville, the largest employers are the Naval Air Station, Duval County Public Schools, City of Jacksonville. In Rochester, the University of Rochester and Rochester General Health System rank as the major employers.
There were 1,310 building permits issued in Jacksonville in 2012 (353 more than in 2011) compared to 45 building permits issued in Rochester in 2012 (1 less than in 2011).
In Jacksonville (Duval County), 47.9% voted for Democrats and 51.5% for Republicans in 2012 Presidential Election. In Rochester (Monroe County), 58.2% voted for Democrats and 40.1% for Republicans.
Elections
Type
Democrats
Republicans
Other
Year
Jacksonville
Rochester
Jacksonville
Rochester
Jacksonville
Rochester
2020
51.3%
59.5%
47.5%
38.4%
1.2%
2.2%
2016
47.2%
54.3%
48.6%
39.3%
4.2%
6.5%
2012
47.9%
58.2%
51.5%
40.1%
0.6%
1.7%
2008
49.0%
58.4%
51.0%
40.6%
0.0%
1.0%
2004
41.7%
50.7%
57.9%
47.8%
0.3%
1.5%
2000
40.9%
51.0%
57.7%
44.5%
1.4%
4.5%
1996
44.2%
53.2%
50.0%
37.3%
5.8%
9.5%
Breakdown of population affiliated with a religious congregation
Type
Adherents
Congregations
Religion
Jacksonville
Rochester
Jacksonville
Rochester
SOUTHERN BAPTIST CONVENTION
15.8%
0.1%
22.3%
2.1%
CATHOLIC CHURCH
9.0%
25.7%
2.8%
11.2%
EPISCOPAL CHURCH
1.2%
0.7%
2.3%
3.5%
MUSLIM ESTIMATE
0.7%
1.2%
0.6%
1.1%
EVANGELICAL LUTHERAN CHURCH IN AMERICA
0.3%
1.1%
0.9%
3.3%
LUTHERAN CHURCH
0.3%
1.0%
0.7%
1.9%
SEVENTH DAY ADVENTIST CHURCH
0.3%
0.2%
1.4%
1.4%
AMERICAN BAPTIST CHURCHES IN THE USA
0.1%
1.6%
0.2%
5.1%
Weather
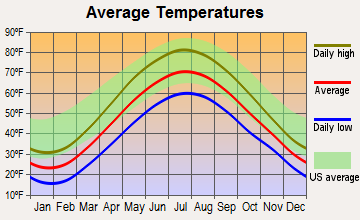
There's a significant difference in weather between the two cities. Jacksonville enjoys a subtropical climate with hot, humid summers and mild winters. On the other hand, Rochester experiences a continental climate, with hot, humid summers and cold, snowy winters. This makes Jacksonville attractive for those who prefer warm climates, while Rochester appeals to those who enjoy the change of seasons.
Weather and climate
Type
Jacksonville
Rochester
Temperature - Average
68.3°F
47.6°F
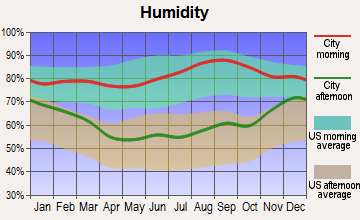
Humidity - Average morning or afternoon humidity
78.4%
76.5%
Humidity - Differences between morning and afternoon humidity
44%
34%
Humidity - Maximum monthly morning or afternoon humidity
92%
87%
Humidity - Minimum monthly morning or afternoon humidity
48%
53%
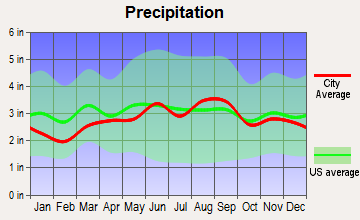
Precipitation - Yearly average
51.8 in
33.7 in
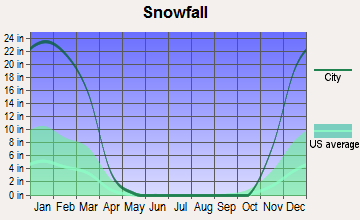
Snowfall - Yearly average
0 in
178.7 in
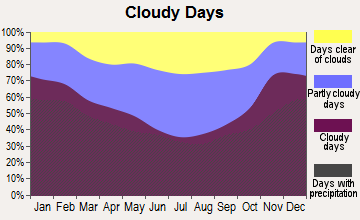
Clouds - Number of days clear of clouds
15.8%
10.2%
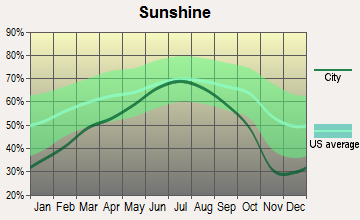
Sunshine amount - Average
69.6%
52.1%
Sunshine amount - Differences during a year
16%
43%
Sunshine amount - Maximum monthly
74%
67%
Sunshine amount - Minimum monthly
58%
24%
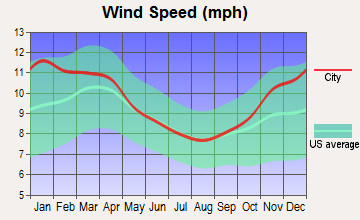
Wind speed - Average
7.2 mph
9.7 mph
Average climate in Jacksonville, Florida
Average climate in Rochester, New York
Air pollution
Type
AQI
CO
NO2
OZONE
PB
PM25
SO2
Year
Jacksonville
Rochester
Jacksonville
Rochester
Rochester
Jacksonville
Rochester
Jacksonville
Jacksonville
Rochester
Jacksonville
Rochester
2018
78
65
N/A
0.24
N/A
N/A
24.5
27.4
N/A
N/A
7.1
6.1
N/A
0.2
2017
74
67
N/A
0.23
N/A
N/A
24.7
29.3
N/A
N/A
5.8
6.2
0.7
0.5
2016
65
67
0.50
0.21
N/A
N/A
24.9
28.1
N/A
N/A
5.2
6.1
0.4
0.7
2015
63
65
0.35
0.21
N/A
N/A
25.4
26.4
N/A
N/A
4.9
7.1
0.3
0.8
2014
66
62
0.27
0.20
N/A
N/A
24.3
26.8
N/A
N/A
5.9
6.8
0.7
1.0
2013
68
64
0.18
0.20
N/A
N/A
23.0
27.5
N/A
N/A
5.3
7.7
0.7
0.9
2012
66
73
0.10
0.21
N/A
N/A
24.0
27.9
N/A
N/A
5.8
6.8
0.6
1.0
2011
88
67
0.28
0.19
8.1
N/A
26.6
27.2
N/A
N/A
8.1
6.8
0.8
1.1
2010
77
74
0.31
0.43
N/A
N/A
26.4
27.7
N/A
N/A
7.1
7.3
0.8
2.2
2009
72
64
0.16
0.42
N/A
N/A
25.0
24.4
N/A
N/A
8.5
6.9
0.6
2.5
2008
75
83
0.15
0.38
N/A
N/A
27.6
26.6
N/A
N/A
10.0
8.5
0.9
2.9
2007
92
86
0.29
0.42
N/A
N/A
28.4
25.6
N/A
N/A
11.4
9.2
1.2
4.1
2006
87
58
0.35
0.49
N/A
N/A
29.0
23.6
N/A
N/A
10.8
N/A
1.4
4.2
2005
93
67
0.42
0.46
N/A
N/A
26.5
23.5
N/A
N/A
12.2
N/A
1.8
4.2
2004
92
43
0.40
0.48
N/A
N/A
25.2
21.6
N/A
N/A
12.4
N/A
1.4
5.1
2003
55
66
0.43
0.49
N/A
N/A
21.6
24.9
N/A
N/A
N/A
N/A
1.6
5.4
2002
59
84
0.49
0.43
N/A
N/A
22.2
27.7
0.003
N/A
N/A
N/A
1.7
5.2
2001
74
70
0.49
0.42
N/A
N/A
24.0
25.7
0.009
N/A
N/A
N/A
2.5
7.6
2000
85
62
0.52
0.42
N/A
N/A
25.1
23.3
0.017
N/A
N/A
N/A
3.0
5.7
Natural disasters
Type
Jacksonville
Rochester
Tornado activity compared to U.S. average
75.2%
17.1%
Earthquake activity compared to U.S. average
18.1%
31.8%
Natural disasters compared to U.S. average
24%
17%
Transportation
Both cities have fairly efficient public transportation systems. However, Jacksonville has a higher reliance on cars for commuting, with less extensive public transit and a larger geographical area to cover.
Transport
Type
Jacksonville
Rochester
Amtrak stations
1
1
Amtrak stations nearby
1
1
FAA registered aircraft
566
151
FAA registered aircraft manufacturers and dealers
34
1
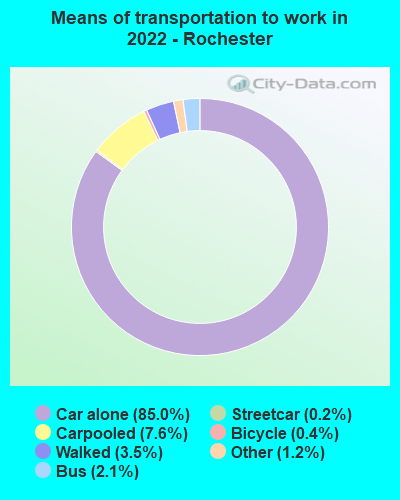
Means of transportation to work
Type
Jacksonville
Rochester
Bicycle
0.2%
0.7%
Bus
1.1%
2.9%
Carpooled
9%
10%
Car alone
86.5%
81.8%
Motorcycle
0.2%
0.1%
Streetcar
0%
0.2%
Taxicab
0.2%
0.3%
Walked
1.2%
2.8%
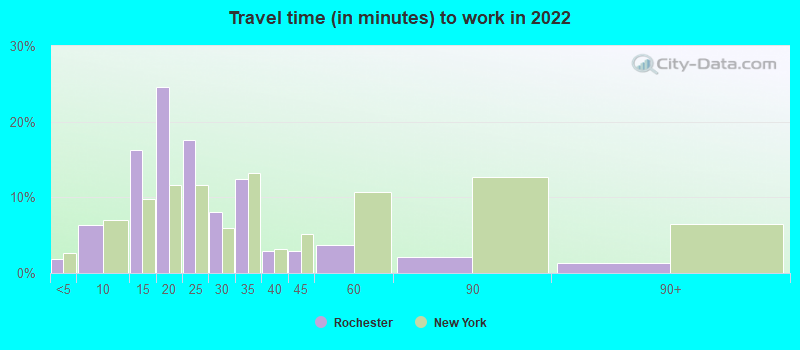
Average travel time to work
Type
Jacksonville
Rochester
Average
27.5 min
22.3 min
Other means
25 min
18.9 min
Public transportation
43.7 min
38.9 min
Private vehicle occupancy
Type
Jacksonville
Rochester
Average
1.1
1.2
Drove alone
89.4%
85.7%
In 2 person carpool
8%
11%
In 3 person carpool
1.7%
1.5%
In 4 person carpool
0.7%
1.2%
In 5-6 person carpool
0%
0.4%
In 7+ person carpool
0.2%
0.2%
How many people usually rode to work in the car, truck or van.
Real Estate
Home prices in Rochester are significantly lower than those in Jacksonville, making home ownership more accessible in Rochester. However, Jacksonville offers a variety of housing options from condos to single-family homes.
Neighborhoods
Both cities boast a variety of neighborhoods with different vibes. Jacksonville's beach communities are a notable standout, while Rochester's Park Avenue and East End areas are known for their charm and walkability.
Houses and residents
Type
Jacksonville
Rochester
Houses
422,315
103,333
Average household size (people)
2.5
2.3
Median year apartment built
1985
1945
Length of stay in the house since moving in
12.5 years
15.3 years
Houses occupied
386,283 (91.5%)
93,263 (90.3%)
Houses occupied by owners
226,429 (58.6%)
38,125 (40.9%)
Houses occupied by renters
159,854 (41.4%)
55,138 (59.1%)
Median rent asked for vacant for-rent units
$1,444
$630.70
Median monthly housing costs
$1,154
$881
Median price asked for vacant for-sale houses and condos
$260,045
$160,052
Estimated median house or condo value
$239,400
$109,700
Median numbers of rooms
5.6
5.2
Median number of rooms in apartments
4.3
4.1
Median number of rooms in houses and condos
6.3
6.3
Median house price - detached houses
$282,276
$130,415
Median house price - in 2-unit structures
$177,341
$173,805
Median house price - in 3-to-4-unit structures
$144,947
$340,804
Median house price - in 5 or more unit structures
$220,508
$428,520
Median house price - mobile homes
$87,589
$28,854
Median house price - Townhouses or other attached units
$213,709
$183,602
Median house price - All housing units
$266,926
$148,505
Median house age
36
2,021
Renting percentage
38.3%
62.3%
Housing density (houses/condos per square mile)
557.4
2,883.6
House value disparities
33.2%
40.7%
Household income disparities
44.2%
48.9%
Median household income for houses/condes with a mortgage
$83,160
$69,171
Median household income for apartments without a mortgage
$59,777
$52,361
Housing units without a mortgage
2,439 (1.6%)
1,391 (5.4%)
Housing units with both a second mortgage and home equity loan
8,460 (5.5%)
3,040 (11.8%)
Housing units with a mortgage
150,468 (98.4%)
24,344 (94.6%)
Housing units with a home equity loan
255 (0.2%)
99 (0.4%)
Housing units with a second mortgage
11,378 (7.4%)
3,389 (13.2%)
House/condo owner moved in on average (years ago)
10
15
House/condo renter moved in on average (years ago)
1
3
Housing units lacking complete kitchen facilities
1.5%
1.8%
Housing units lacking complete plumbing facilities
1.4%
1.1%
Housing units in structures
Housing units in structures
Jacksonville
Rochester
One, detached
59.4%
47.7%
One, attached
6.1%
5.8%
Two
2.1%
17.4%
3 or 4
5.3%
8.0%
5 to 9
5.0%
5.0%
10 to 19
7.9%
2.7%
20 to 49
4.9%
4.4%
50 or more
5.3%
8.7%
Mobile homes
3.8%
0.3%
Boats, RVs, vans, etc.
0.2%
0.0%
Median real estate property taxes paid for housing units
Self-employed workers in own not incorporated business
19,601
4,711
State government workers
13,692
2,362
Unpaid family workers
1,066
427
Industries and Occupations
Healthcare and social assistance sectors top the industries in both cities, but Jacksonville has a stronger presence in finance and insurance. Rochester has a more prominent place in manufacturing and education services.
Both cities offer excellent healthcare facilities, but Jacksonville's hospitals consistently receive high rankings for patient care. Rochester's hospitals are also well-regarded, with the added advantage of having two medical schools.
Health (county statistics)
Type
Jacksonville
Rochester
General health status score of residents in this county from 1 (poor) to 5 (excellent)
Jacksonville boasts modern infrastructure including a comprehensive road network, an international airport, and a major international seaport. Rochester has a well-developed highway system and an excellent airport, along with well-maintained public utilities and amenities.
Infrastructure
Type
Jacksonville
Rochester
Hospitals
25
14
TV stations
17
13
Arenas or stadiums
2
2
Bank branches located here
191
106
Bank institutions located here
31
15
Main business address for public companies
23
14
Nuclear power plants
0
1
Nuclear power plants nearby
0
1
Drinking water stations with no reported violations in the past
20
2
Drinking water stations with reported violations in the past
HMDA - Conventional home purchase loans - Applications denied
Year
Jacksonville
Rochester
1999
5,422
374
2000
4,132
555
2001
3,038
427
2002
2,017
356
2003
3,563
388
2004
4,781
476
2005
7,134
704
2006
8,812
872
2007
5,298
739
2008
1,719
319
2009
676
101
Culture and Food
Jacksonville offers a mix of Southern charm and coastal culture, with a blossoming food and craft beer scene. Rochester is known for its vibrant arts and cultural scene, as well as their distinctive "Garbage Plate" delicacy.
Sports Teams
Jacksonville is home to the NFL's Jacksonville Jaguars, while Rochester has minor league teams for several sports, and it’s close to Buffalo for those desiring to watch NFL and NHL.


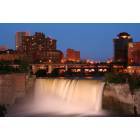

 Jacksonville, FL
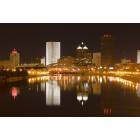
 Rochester, NY