Jacksonville, FL, and Minneapolis, MN, offer diverse but unique lifestyles influenced by varying climates, economic opportunities, and cultural experiences. These differences extend beyond the obvious contrast in weather, with each city providing distinct benefits and challenges. Yet, both cities maintain a vibrant hospitality industry, attracting both tourists and potential new residents. Weighing several aspects is paramount for anyone considering relocation or planning a visit.
Distance between
Jacksonville, FL and
Minneapolis, MN : 1,191.8 miles
Jacksonville's population is larger by 124%. Its population has grown by 218,997 people (29.8%) since 2000. The population of Minneapolis has grown by 42,718 people (11.2%) during that time.
Jacksonville, FL, has higher crime rates than Minneapolis, MN. While both cities have areas with high and low crime rates, statistics show that Jacksonville has a higher violent and property crime rate. Nevertheless, both cities have been implementing various strategies to curb crime rates, including community policing and more concentrated law enforcement efforts. Tourists and those considering relocation should familiarize themselves with safer neighborhoods and exercise common precautionary measures.
Cost of Living
Overall, the cost of living in Jacksonville, FL, is lower than in Minneapolis, MN. Housing, groceries, and healthcare are generally more affordable in Jacksonville. However, Minneapolis residents often have higher income levels, which can balance the higher cost of living in this city.
Income Tax
Florida is one of the states with no income tax, which could be an advantage for potential residents of Jacksonville. Minnesota, and hence, Minneapolis, has a progressive state income tax system where the rate increases with income.
Property Tax
Florida generally has lower property taxes compared to Minnesota, making homeownership potentially more affordable in Jacksonville. However, local rates can vary within each state, and these rates are subject to change.
Sales Tax
Florida's state sales tax, including that of Jacksonville, is 6%, with some municipalities adding local surtaxes. Minnesota's state sales tax is 6.875%, and Minneapolis adds an additional local sales tax. These taxes can affect the overall cost of living and should be considered by potential re-locators and visitors alike.
Income
Type
Jacksonville
Minneapolis
Estimated median household income
$58,621
$69,397
Estimated per capita income
$32,953
$44,836
Cost of living index (U.S. average is 100)
88.3
115.8
If you make $50,000 in Jacksonville, you will have to make $65,572 in Minneapolis to maintain the same standard of living.
Geographical Conditions
Geographically, Jacksonville's coastal location offers numerous beaches and water-based activities. Minneapolis, known as the City of Lakes, is dotted with lakes and parks and has a more varied terrain, including woodland, wetland, and prairie settings.
Both Jacksonville and Minneapolis are home to reputable educational institutions. However, Minneapolis is recognized for its higher investment in public education and is considered to have better education outcomes. Minneapolis also houses several higher education institutions, including the University of Minnesota, offering diverse educational opportunities.
While both Jacksonville and Minneapolis have strong and varied economies, the industries they are built upon vary. Jacksonville has a disposition towards sectors such as healthcare, aviation, and finance. Conversely, Minneapolis is known for its strong presence in retail, financial services, and healthcare. Both cities offer numerous employment opportunities, although job availability varies by industry.
Biggest Employers
Jacksonville's largest employers include the Naval Air Station, Duval County Public Schools, and Baptist Health. Minneapolis's largest employers include Target, Allina Health, and Wells Fargo, reflecting the city's strength in retail and healthcare industries.
There were 1,310 building permits issued in Jacksonville in 2012 (353 more than in 2011) compared to 63 building permits issued in Minneapolis in 2012 (14 more than in 2011).
In Jacksonville (Duval County), 47.9% voted for Democrats and 51.5% for Republicans in 2012 Presidential Election. In Minneapolis (Hennepin County), 62.5% voted for Democrats and 35.4% for Republicans.
Elections
Type
Democrats
Republicans
Other
Year
Jacksonville
Minneapolis
Jacksonville
Minneapolis
Jacksonville
Minneapolis
2020
51.3%
70.7%
47.5%
27.4%
1.2%
1.9%
2016
47.2%
63.4%
48.6%
28.3%
4.2%
8.3%
2012
47.9%
62.5%
51.5%
35.4%
0.6%
2.1%
2008
49.0%
63.6%
51.0%
34.9%
0.0%
1.4%
2004
41.7%
59.7%
57.9%
39.7%
0.3%
0.6%
2000
40.9%
53.7%
57.7%
39.4%
1.4%
6.9%
1996
44.2%
54.4%
50.0%
33.2%
5.8%
12.5%
Breakdown of population affiliated with a religious congregation
Type
Adherents
Congregations
Religion
Jacksonville
Minneapolis
Jacksonville
Minneapolis
SOUTHERN BAPTIST CONVENTION
15.8%
0.1%
22.3%
1.3%
CATHOLIC CHURCH
9.0%
18.7%
2.8%
8.7%
EPISCOPAL CHURCH
1.2%
0.7%
2.3%
2.1%
MUSLIM ESTIMATE
0.7%
0.7%
0.6%
2.7%
EVANGELICAL LUTHERAN CHURCH IN AMERICA
0.3%
10.8%
0.9%
12.6%
LUTHERAN CHURCH
0.3%
1.6%
0.7%
4.1%
SEVENTH DAY ADVENTIST CHURCH
0.3%
0.4%
1.4%
2.9%
AMERICAN BAPTIST CHURCHES IN THE USA
0.1%
0.4%
0.2%
1.3%
WISCONSIN EVANGELICAL LUTHERAN SYNOD
0.0%
0.4%
0.2%
1.4%
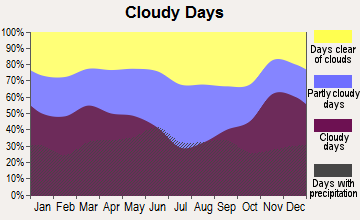
Weather
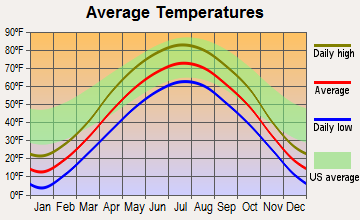
The weather in Jacksonville, FL, is warm and tropical, a stark contrast to Minneapolis, MN, which experiences a cold climate, especially during winter. The hot temperatures and year-round warmth in Jacksonville can be a draw for tourists and residents who enjoy beach activities and outdoor pursuits. On the other hand, Minneapolis's colder climate attracts winter sport enthusiasts and those who find charm in the four distinct seasons.
Weather and climate
Type
Jacksonville
Minneapolis
Temperature - Average
68.3°F
45.3°F
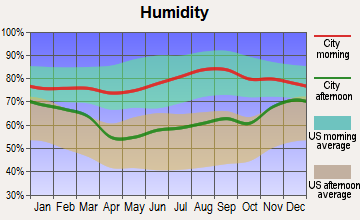
Humidity - Average morning or afternoon humidity
78.4%
74.9%
Humidity - Differences between morning and afternoon humidity
44%
33%
Humidity - Maximum monthly morning or afternoon humidity
92%
84%
Humidity - Minimum monthly morning or afternoon humidity
48%
51%
Precipitation - Yearly average
51.8 in
30.4 in
Snowfall - Yearly average
0 in
98.6 in
Clouds - Number of days clear of clouds
15.8%
15.8%
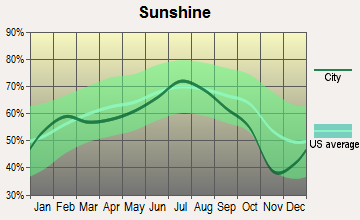
Sunshine amount - Average
69.6%
61.8%
Sunshine amount - Differences during a year
16%
37%
Sunshine amount - Maximum monthly
74%
74%
Sunshine amount - Minimum monthly
58%
37%
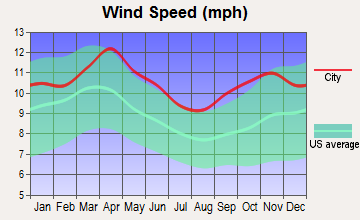
Wind speed - Average
7.2 mph
10.5 mph
Average climate in Jacksonville, Florida
Average climate in Minneapolis, Minnesota
Air pollution
Type
AQI
CO
NO2
OZONE
PB
PM10
PM25
SO2
Year
Jacksonville
Minneapolis
Jacksonville
Minneapolis
Minneapolis
Jacksonville
Minneapolis
Jacksonville
Minneapolis
Minneapolis
Jacksonville
Minneapolis
Jacksonville
Minneapolis
2018
78
81
N/A
0.24
14.1
N/A
24.5
28.2
N/A
N/A
20.4
N/A
7.1
8.5
N/A
1.3
2017
74
71
N/A
0.26
13.4
N/A
24.7
27.9
N/A
N/A
17.5
N/A
5.8
7.8
0.7
1.4
2016
65
76
0.50
0.28
12.6
N/A
24.9
26.7
N/A
N/A
16.7
N/A
5.2
7.3
0.4
1.5
2015
63
80
0.35
0.28
13.8
N/A
25.4
27.8
N/A
N/A
19.4
N/A
4.9
8.8
0.3
1.1
2014
66
83
0.27
0.25
15.9
N/A
24.3
26.8
N/A
N/A
21.2
N/A
5.9
7.0
0.7
1.0
2013
68
81
0.18
N/A
12.8
N/A
23.0
32.1
N/A
N/A
20.9
N/A
5.3
6.7
0.7
0.9
2012
66
80
0.10
N/A
7.7
N/A
24.0
29.0
N/A
N/A
23.8
N/A
5.8
8.4
0.6
0.2
2011
88
90
0.28
0.22
7.8
N/A
26.6
29.7
N/A
N/A
23.4
N/A
8.1
9.8
0.8
0.1
2010
77
101
0.31
N/A
9.6
N/A
26.4
27.8
N/A
0.003
24.7
N/A
7.1
9.6
0.8
0.5
2009
72
103
0.16
N/A
7.4
N/A
25.0
N/A
N/A
0.004
21.4
N/A
8.5
9.4
0.6
1.1
2008
75
92
0.15
N/A
8.8
N/A
27.6
N/A
N/A
0.003
18.3
N/A
10.0
10.1
0.9
1.0
2007
92
102
0.29
N/A
9.2
N/A
28.4
N/A
N/A
0.003
21.6
N/A
11.4
11.6
1.2
0.6
2006
87
88
0.35
N/A
9.5
N/A
29.0
N/A
N/A
0.006
20.5
N/A
10.8
10.5
1.4
1.8
2005
93
107
0.42
N/A
12.3
N/A
26.5
N/A
N/A
0.004
22.0
N/A
12.2
10.6
1.8
2.1
2004
92
103
0.40
N/A
11.0
N/A
25.2
N/A
N/A
0.005
23.9
N/A
12.4
10.5
1.4
3.3
2003
55
114
0.43
N/A
12.5
N/A
21.6
N/A
N/A
0.004
25.9
N/A
N/A
11.9
1.6
3.0
2002
59
95
0.49
0.42
15.7
N/A
22.2
N/A
0.003
0.007
N/A
N/A
N/A
10.9
1.7
1.8
2001
74
82
0.49
0.75
17.5
N/A
24.0
32.4
0.009
0.011
N/A
N/A
N/A
9.3
2.5
2.0
2000
85
68
0.52
0.75
16.6
N/A
25.1
31.2
0.017
0.009
N/A
N/A
N/A
N/A
3.0
2.8
Natural disasters
Type
Jacksonville
Minneapolis
Tornado activity compared to U.S. average
75.2%
129.9%
Earthquake activity compared to U.S. average
18.1%
44.5%
Natural disasters compared to U.S. average
24%
17%
Transportation
While both cities offer public transportation, Minneapolis has a more extensive system, including buses, light rail, and commuter trains. However, Jacksonville is constantly improving its public transit system. Both cities experience rush hour traffic, but Minneapolis often ranks worse for congestion.
Transport
Type
Jacksonville
Minneapolis
Amtrak stations
1
0
Amtrak stations nearby
1
1
FAA registered aircraft
566
284
FAA registered aircraft manufacturers and dealers
34
0
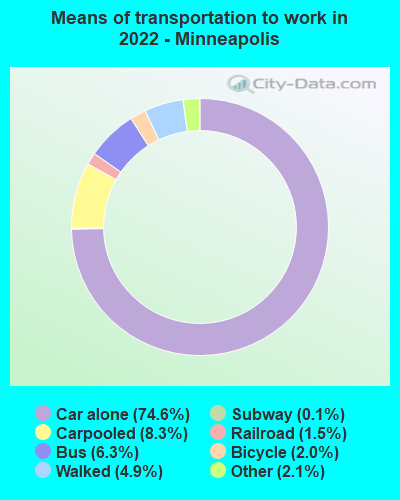
Means of transportation to work
Type
Jacksonville
Minneapolis
Bicycle
0.2%
1.9%
Bus
1.1%
6.6%
Carpooled
9%
9%
Car alone
86.5%
74.3%
Motorcycle
0.2%
0.1%
Railroad
0%
0.6%
Subway
0%
0.2%
Taxicab
0.2%
0.2%
Walked
1.2%
5.2%
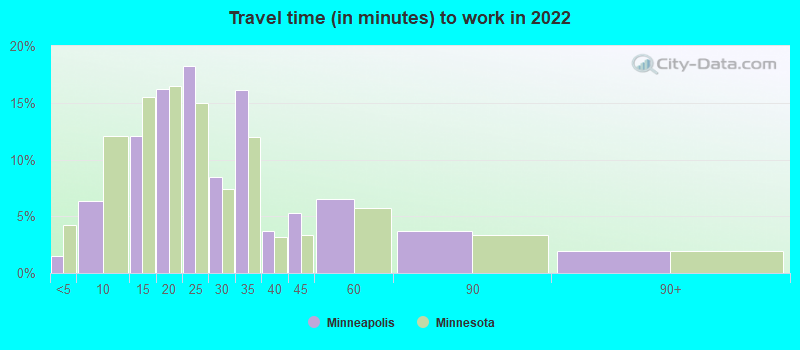
Average travel time to work
Type
Jacksonville
Minneapolis
Average
27.5 min
27.4 min
Other means
25 min
20.3 min
Public transportation
43.7 min
32.6 min
Private vehicle occupancy
Type
Jacksonville
Minneapolis
Average
1.1
1.2
Drove alone
89.4%
87.5%
In 2 person carpool
8%
10.3%
In 3 person carpool
1.7%
1%
In 4 person carpool
0.7%
0.8%
In 5-6 person carpool
0%
0.4%
In 7+ person carpool
0.2%
0%
How many people usually rode to work in the car, truck or van.
Real Estate
Jacksonville has a lower median home value compared to Minneapolis, making it potentially more affordable for homebuyers. However, homes in desirable areas in both cities can command higher prices, and property values have been increasing in both cities, reflecting strong real estate markets.
Neighborhoods
Both Jacksonville and Minneapolis boast diverse neighborhoods, each with their unique charm. Jacksonville combines bustling urban areas with quieter, more laid-back coastal communities. Minneapolis provides a mix of urban living downtown, peaceful lakeside neighborhoods, and vibrant arts districts.
Houses and residents
Type
Jacksonville
Minneapolis
Houses
422,315
203,633
Average household size (people)
2.5
2.2
Median year apartment built
1985
1967
Length of stay in the house since moving in
12.5 years
13 years
Houses occupied
386,283 (91.5%)
188,681 (92.7%)
Houses occupied by owners
226,429 (58.6%)
93,981 (49.8%)
Houses occupied by renters
159,854 (41.4%)
94,700 (50.2%)
Median rent asked for vacant for-rent units
$1,444
$1,777
Median monthly housing costs
$1,154
$1,369
Median price asked for vacant for-sale houses and condos
$260,045
$238,504
Estimated median house or condo value
$239,400
$319,100
Median numbers of rooms
5.6
4.8
Median number of rooms in apartments
4.3
3.3
Median number of rooms in houses and condos
6.3
6.4
Median house price - detached houses
$282,276
$398,431
Median house price - in 2-unit structures
$177,341
$353,466
Median house price - in 3-to-4-unit structures
$144,947
$335,939
Median house price - in 5 or more unit structures
$220,508
$317,891
Median house price - mobile homes
$87,589
$9,605
Median house price - Townhouses or other attached units
$213,709
$376,360
Median house price - All housing units
$266,926
$383,883
Median house age
36
70
Renting percentage
38.3%
50.8%
Housing density (houses/condos per square mile)
557.4
3,709.7
House value disparities
33.2%
30.1%
Household income disparities
44.2%
45.3%
Median household income for houses/condes with a mortgage
$83,160
$113,268
Median household income for apartments without a mortgage
$59,777
$70,111
Housing units without a mortgage
2,439 (1.6%)
1,756 (2.5%)
Housing units with both a second mortgage and home equity loan
8,460 (5.5%)
6,107 (8.7%)
Housing units with a mortgage
150,468 (98.4%)
68,555 (97.5%)
Housing units with a home equity loan
255 (0.2%)
203 (0.3%)
Housing units with a second mortgage
11,378 (7.4%)
7,699 (10.9%)
House/condo owner moved in on average (years ago)
10
10
House/condo renter moved in on average (years ago)
1
1
Housing units lacking complete kitchen facilities
1.5%
0.7%
Housing units lacking complete plumbing facilities
1.4%
0.4%
Housing units in structures
Housing units in structures
Jacksonville
Minneapolis
One, detached
59.4%
41.8%
One, attached
6.1%
3.6%
Two
2.1%
7.4%
3 or 4
5.3%
3.8%
5 to 9
5.0%
3.7%
10 to 19
7.9%
6.2%
20 to 49
4.9%
9.8%
50 or more
5.3%
23.3%
Mobile homes
3.8%
0.3%
Boats, RVs, vans, etc.
0.2%
0.0%
Median real estate property taxes paid for housing units
Self-employed workers in own not incorporated business
19,601
13,397
State government workers
13,692
12,526
Unpaid family workers
1,066
516
Industries and Occupations
In Jacksonville, major industries include healthcare, transportation and logistics, finance, and aviation. In contrast, Minneapolis is a hub for professional and business services, finance, retail, and healthcare. The diversity in dominant industries means those looking for jobs may find different opportunities in each of the two cities.
Both cities offer high-quality healthcare, but Jacksonville is home to some world-renowned hospitals and healthcare facilities like Mayo Clinic. Meanwhile, Minneapolis is served by a network of high-rated hospitals and a large number of healthcare professionals.
Health (county statistics)
Type
Jacksonville
Minneapolis
General health status score of residents in this county from 1 (poor) to 5 (excellent)
In terms of infrastructure, Minneapolis boasts a more advanced public transit system, while Jacksonville relies heavily on highway systems and individual car ownership. Minneapolis also offers extensive biking and walking paths, making it a more walkable city than Jacksonville. Notably, Jacksonville has a busy seaport and large airport, contributing to a strong infrastructure framework.
Infrastructure
Type
Jacksonville
Minneapolis
Hospitals
25
17
TV stations
17
17
Arenas or stadiums
2
4
Bank branches located here
191
86
Bank institutions located here
31
26
Main business address for public companies
23
59
Drinking water stations with no reported violations in the past
20
10
Drinking water stations with reported violations in the past
HMDA - Conventional home purchase loans - Applications denied
Year
Jacksonville
Minneapolis
1999
5,422
1,420
2000
4,132
428
2001
3,038
294
2002
2,017
272
2003
3,563
1,151
2004
4,781
1,818
2005
7,134
3,008
2006
8,812
3,221
2007
5,298
1,812
2008
1,719
710
2009
676
372
Culture and Food
Both cities have rich cultures and diverse food scenes. Jacksonville is known for its coastal Southern charm and seafood, while Minneapolis offers a mix of international cuisine influenced by its diverse population and a renowned farm-to-table scene.
Sports Teams
Sports enthusiasts will find plenty to cheer for in both cities. Jacksonville is home to the Jacksonville Jaguars (NFL), while Minneapolis boasts the Minnesota Vikings (NFL), Minnesota Twins (MLB), and Minnesota Timberwolves (NBA).


 Jacksonville, FL
 Minneapolis, MN