Jacksonville, FL and Lubbock, TX are two distinct cities each offering diverse environments, cultures, and resources. Jacksonville boasts a seaside vibe with a robust economy, while Lubbock is known for its southern charm and college town atmosphere. In comparing these two places, we will delve into various aspects to offer you a complete perspective. This can help you make an informed decision, whether you're considering relocating or simply planning a visit.
Distance between
Jacksonville, FL and
Lubbock, TX : 1,204.3 miles
Jacksonville's population is larger by 266%. Its population has grown by 218,997 people (29.8%) since 2000. The population of Lubbock has grown by 61,429 people (30.8%) during that time.
Jacksonville's overall crime rate is higher than the national average, with property crime being particularly prominent. Lubbock's crime rate is also greater than the national average but lower than Jacksonville. Safety is a crucial consideration when moving or traveling to a new city. Both cities are proactively implementing measures to enhance community safety and involve residents in crime prevention efforts.
Cost of Living
Overall, the cost of living in Lubbock is generally lower than in Jacksonville. This lower cost extends to housing, groceries, utilities, and health care. Jacksonville, while still more affordable than many other U.S cities, has a higher cost of living mainly due to its coastal location and the associated higher housing prices.
Income Tax
Both Jacksonville, FL and Lubbock, TX are in states that do not collect income tax, making both cities an attractive option for individuals considering relocation or for businesses considering new locations.
Property Tax
The average property tax rate in Jacksonville is around 0.94%, which is lower than the national average. Lubbock has a higher property tax rate, averaging at 2.11%. Whether you choose Jacksonville or Lubbock, keep in mind how property taxes might affect your cost of living.
Sales Tax
Florida does not have state income tax, a perk for Jacksonville residents. The combined city and state sales tax rate for Jacksonville is 7%. Lubbock, on the other hand, is in Texas, which also doesn't have state income tax. However, the combined city and state sales tax rate is slightly higher at 8.25%.
Income
Type
Jacksonville
Lubbock
Estimated median household income
$58,621
$54,747
Estimated per capita income
$32,953
$30,618
Cost of living index (U.S. average is 100)
88.3
83.8
If you make $50,000 in Lubbock, you will have to make $52,685 in Jacksonville to maintain the same standard of living.
Geographical Conditions
Spread along the St. Johns River and the Atlantic Ocean, Jacksonville features beaches, wetlands, and waterways. Lubbock, in the plains of West Texas, offers a flatter landscape common to the area.
Jacksonville is home to numerous quality public and private schools and also offers several universities and colleges, including the University of North Florida. Lubbock is renowned for Texas Tech University, making it a bustling college town. Both cities invest in education and offer good opportunities for students of all ages.
Jacksonville has a diverse economy with a strong focus on health care, finance, and logistics. Lubbock's economy is rooted in education, agriculture, and healthcare, with burgeoning industries in manufacturing and technology. Both cities have been experiencing steady job growth, which bodes well for future employment prospects.
Biggest Employers
In Jacksonville, the largest employers are the Naval Air Station, Duval County Public Schools, and City of Jacksonville. In Lubbock, Texas Tech University, University Medical Center, and Covenant Health System provide the most employment opportunities.
There were 1,310 building permits issued in Jacksonville in 2012 (353 more than in 2011) compared to 2,454 building permits issued in Lubbock in 2012 (1825 more than in 2011).
In Jacksonville (Duval County), 47.9% voted for Democrats and 51.5% for Republicans in 2012 Presidential Election. In Lubbock (Lubbock County), 28.8% voted for Democrats and 69.6% for Republicans.
Elections
Type
Democrats
Republicans
Other
Year
Jacksonville
Lubbock
Jacksonville
Lubbock
Jacksonville
Lubbock
2020
51.3%
33.2%
47.5%
65.4%
1.2%
1.3%
2016
47.2%
28.3%
48.6%
66.4%
4.2%
5.3%
2012
47.9%
28.8%
51.5%
69.6%
0.6%
1.5%
2008
49.0%
31.3%
51.0%
68.1%
0.0%
0.7%
2004
41.7%
24.2%
57.9%
75.4%
0.3%
0.4%
2000
40.9%
24.4%
57.7%
73.9%
1.4%
1.7%
1996
44.2%
30.6%
50.0%
63.5%
5.8%
5.9%
Breakdown of population affiliated with a religious congregation
Type
Adherents
Congregations
Religion
Jacksonville
Lubbock
Jacksonville
Lubbock
SOUTHERN BAPTIST CONVENTION
15.8%
16.1%
22.3%
31.5%
CATHOLIC CHURCH
9.0%
13.0%
2.8%
5.0%
EPISCOPAL CHURCH
1.2%
0.7%
2.3%
0.9%
MUSLIM ESTIMATE
0.7%
1.8%
0.6%
0.6%
SEVENTH DAY ADVENTIST CHURCH
0.3%
0.2%
1.4%
0.9%
Weather
Jacksonville, located on the northeast coast of Florida, experiences a humid subtropical climate with hot, wet summers and mild, dry winters. Lubbock, in contrast, has a semi-arid climate. Summers can be very hot, but the city typically experiences more moderate winters compared to Jacksonville's. In terms of climate, it largely depends on your preference for coastal humidity or inland dryness.
Weather and climate
Type
Jacksonville
Lubbock
Temperature - Average
68.3°F
59.7°F
Humidity - Average morning or afternoon humidity
78.4%
64.4%
Humidity - Differences between morning and afternoon humidity
44%
42.3%
Humidity - Maximum monthly morning or afternoon humidity
92%
79.7%
Humidity - Minimum monthly morning or afternoon humidity
48%
37.4%
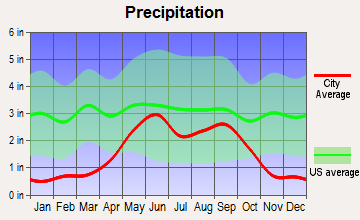
Precipitation - Yearly average
51.8 in
19 in
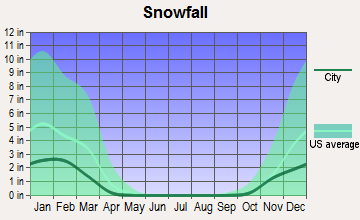
Snowfall - Yearly average
0 in
16.7 in
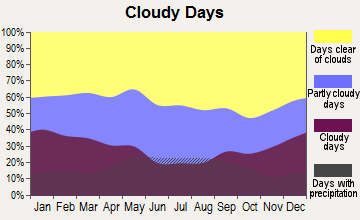
Clouds - Number of days clear of clouds
15.8%
26.6%
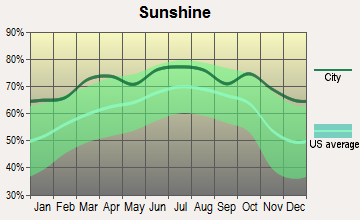
Sunshine amount - Average
69.6%
78.7%
Sunshine amount - Differences during a year
16%
16.7%
Sunshine amount - Maximum monthly
74%
80%
Sunshine amount - Minimum monthly
58%
63.3%
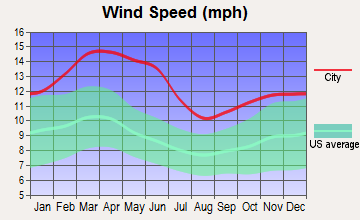
Wind speed - Average
7.2 mph
12.8 mph
Average climate in Jacksonville, Florida
Average climate in Lubbock, Texas
Air pollution
Type
AQI
CO
OZONE
PB
PM25
SO2
Year
Jacksonville
Lubbock
Jacksonville
Jacksonville
Jacksonville
Jacksonville
Lubbock
Jacksonville
2018
78
62
N/A
N/A
24.5
N/A
N/A
N/A
7.1
6.6
N/A
N/A
2017
74
56
N/A
N/A
24.7
N/A
N/A
N/A
5.8
6.3
0.7
N/A
2016
65
N/A
0.50
N/A
24.9
N/A
N/A
N/A
5.2
N/A
0.4
N/A
2015
63
N/A
0.35
N/A
25.4
N/A
N/A
N/A
4.9
N/A
0.3
N/A
2014
66
61
0.27
N/A
24.3
N/A
N/A
N/A
5.9
7.6
0.7
N/A
2013
68
68
0.18
N/A
23.0
N/A
N/A
N/A
5.3
7.5
0.7
N/A
2012
66
76
0.10
N/A
24.0
N/A
N/A
N/A
5.8
9.0
0.6
N/A
2011
88
81
0.28
N/A
26.6
N/A
N/A
N/A
8.1
9.1
0.8
N/A
2010
77
57
0.31
N/A
26.4
N/A
N/A
N/A
7.1
6.7
0.8
N/A
2009
72
59
0.16
N/A
25.0
N/A
N/A
N/A
8.5
7.0
0.6
N/A
2008
75
N/A
0.15
N/A
27.6
N/A
N/A
N/A
10.0
N/A
0.9
N/A
2007
92
N/A
0.29
N/A
28.4
N/A
N/A
N/A
11.4
N/A
1.2
N/A
2006
87
N/A
0.35
N/A
29.0
N/A
N/A
N/A
10.8
N/A
1.4
N/A
2005
93
N/A
0.42
N/A
26.5
N/A
N/A
N/A
12.2
N/A
1.8
N/A
2004
92
N/A
0.40
N/A
25.2
N/A
N/A
N/A
12.4
N/A
1.4
N/A
2003
55
N/A
0.43
N/A
21.6
N/A
N/A
N/A
N/A
N/A
1.6
N/A
2002
59
N/A
0.49
N/A
22.2
N/A
0.003
N/A
N/A
N/A
1.7
N/A
2001
74
N/A
0.49
N/A
24.0
N/A
0.009
N/A
N/A
N/A
2.5
N/A
2000
85
N/A
0.52
N/A
25.1
N/A
0.017
N/A
N/A
N/A
3.0
N/A
Natural disasters
Type
Jacksonville
Lubbock
Tornado activity compared to U.S. average
75.2%
166%
Earthquake activity compared to U.S. average
18.1%
535.5%
Natural disasters compared to U.S. average
24%
14%
Transportation
Jacksonville Transportation Authority provides various modes of transportation including buses, ferries, and rapid transit. Lubbock offers public buses and taxis, but many residents find owning a car necessary due to its spread-out nature. In terms of commuting, Lubbock generally has shorter commute times than Jacksonville.
Transport
Type
Jacksonville
Lubbock
Amtrak stations
1
0
Amtrak stations nearby
1
0
FAA registered aircraft
566
293
FAA registered aircraft manufacturers and dealers
34
0
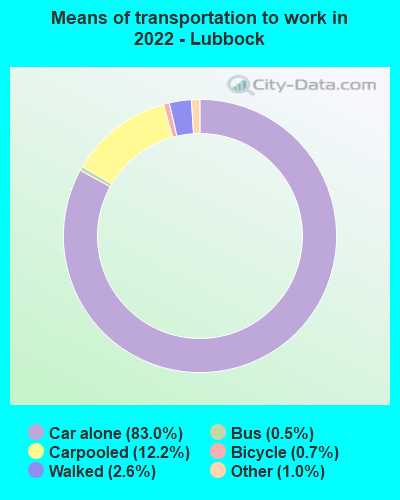
Means of transportation to work
Type
Jacksonville
Lubbock
Bicycle
0.2%
0.3%
Bus
1.1%
0.8%
Carpooled
9%
9.6%
Car alone
86.5%
86.4%
Motorcycle
0.2%
0.2%
Taxicab
0.2%
0.1%
Walked
1.2%
1.9%
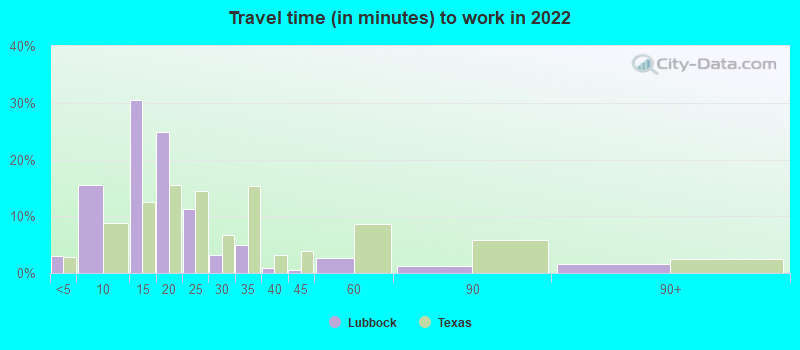
Average travel time to work
Type
Jacksonville
Lubbock
Average
27.5 min
18.2 min
Other means
25 min
18 min
Public transportation
43.7 min
31.3 min
Private vehicle occupancy
Type
Jacksonville
Lubbock
Average
1.1
1.2
Drove alone
89.4%
89.3%
In 2 person carpool
8%
7.9%
In 3 person carpool
1.7%
1%
In 4 person carpool
0.7%
0.6%
In 5-6 person carpool
0%
1.2%
In 7+ person carpool
0.2%
0.1%
How many people usually rode to work in the car, truck or van.
Real Estate
Housing in Jacksonville tends to be more expensive than Lubbock due to its seaside location. However, both cities offer a variety of housing options, from downtown apartments to suburban homes. The choice ultimately depends on your budget and lifestyle preference.
Neighborhoods
Jacksonville has more than 500 distinct neighborhoods, including those in the vibrant downtown area and others along the beach. Lubbock offers diverse neighborhoods centered around Texas Tech University or quieter, suburban areas. Both cities cater to different lifestyle and budget requirements.
Houses and residents
Type
Jacksonville
Lubbock
Houses
422,315
113,800
Average household size (people)
2.5
2.5
Median year apartment built
1985
1985
Median year house/condo built
1987
1985
Length of stay in the house since moving in
12.5 years
12.4 years
Houses occupied
386,283 (91.5%)
104,426 (91.8%)
Houses occupied by owners
226,429 (58.6%)
53,722 (51.4%)
Houses occupied by renters
159,854 (41.4%)
50,704 (48.6%)
Median rent asked for vacant for-rent units
$1,444
$760.15
Median monthly housing costs
$1,154
$1,010
Median price asked for vacant for-sale houses and condos
$260,045
$431,965
Estimated median house or condo value
$239,400
$171,400
Median numbers of rooms
5.6
5.2
Median number of rooms in apartments
4.3
4
Median number of rooms in houses and condos
6.3
6.2
Median house price - detached houses
$282,276
$217,964
Median house price - in 2-unit structures
$177,341
$266,863
Median house price - in 3-to-4-unit structures
$144,947
$270,056
Median house price - in 5 or more unit structures
$220,508
$186,477
Median house price - mobile homes
$87,589
$60,138
Median house price - Townhouses or other attached units
$213,709
$159,383
Median house price - All housing units
$266,926
$215,105
Median house age
36
37
Renting percentage
38.3%
45.4%
Housing density (houses/condos per square mile)
557.4
991.2
House value disparities
33.2%
37.4%
Household income disparities
44.2%
48.2%
Median household income for houses/condes with a mortgage
$83,160
$96,150
Median household income for apartments without a mortgage
$59,777
$60,175
Housing units without a mortgage
2,439 (1.6%)
244 (0.8%)
Housing units with both a second mortgage and home equity loan
8,460 (5.5%)
577 (1.9%)
Housing units with a mortgage
150,468 (98.4%)
29,683 (99.2%)
Housing units with a home equity loan
255 (0.2%)
0 (0%)
Housing units with a second mortgage
11,378 (7.4%)
705 (2.4%)
House/condo owner moved in on average (years ago)
10
9
House/condo renter moved in on average (years ago)
1
1
Housing units lacking complete kitchen facilities
1.5%
2.9%
Housing units lacking complete plumbing facilities
1.4%
1.9%
Housing units in structures
Housing units in structures
Jacksonville
Lubbock
One, detached
59.4%
64.8%
One, attached
6.1%
2.7%
Two
2.1%
3.6%
3 or 4
5.3%
5.0%
5 to 9
5.0%
6.5%
10 to 19
7.9%
5.4%
20 to 49
4.9%
2.8%
50 or more
5.3%
6.9%
Mobile homes
3.8%
2.2%
Boats, RVs, vans, etc.
0.2%
0.1%
Median real estate property taxes paid for housing units
Self-employed workers in own not incorporated business
19,601
8,411
State government workers
13,692
10,797
Unpaid family workers
1,066
523
Industries and Occupations
The biggest industries in Jacksonville are health care and social assistance along with retail trade. Meanwhile, Lubbock's economy is heavily impacted by educational services, followed by healthcare and retail trade. This difference in industries could be a significant factor in deciding which city is more suitable for your occupation.
Jacksonville is home to the Mayo Clinic and numerous other highly-rated hospitals and healthcare facilities. Lubbock is the healthcare hub of the South Plains region, with University Medical Center and Covenant Health System regarded as some of the best medical facilities in the region.
Health (county statistics)
Type
Jacksonville
Lubbock
General health status score of residents in this county from 1 (poor) to 5 (excellent)
Jacksonville boasts a robust and growing infrastructure, including an expanding port and large-scale State funded projects enhancing roadways and public spaces. Lubbock, although smaller, has a well-established infrastructure and has seen substantial growth and development in recent years.
Infrastructure
Type
Jacksonville
Lubbock
Hospitals
25
36
TV stations
17
13
Arenas or stadiums
2
3
Bank branches located here
191
97
Bank institutions located here
31
22
Main business address for public companies
23
3
Drinking water stations with no reported violations in the past
20
3
Drinking water stations with reported violations in the past
HMDA - Conventional home purchase loans - Applications denied
Year
Jacksonville
Lubbock
1999
5,422
1,025
2000
4,132
673
2001
3,038
472
2002
2,017
402
2003
3,563
0
2004
4,781
542
2005
7,134
566
2006
8,812
565
2007
5,298
343
2008
1,719
161
2009
676
115
Culture and Food
Jacksonville has a rich cultural scene and is renowned for its food, particularly seafood due to its coastal location. Lubbock offers a unique blend of cowboy culture with a diverse culinary scene, including classic Texas barbecue and Tex-Mex fare. Both cities host numerous festivals and cultural events throughout the year.
Sports Teams
Jacksonville is home to the NFL's Jacksonville Jaguars, while Lubbock roots for the Texas Tech Red Raiders. Whether you're a football enthusiast or enjoy college sports, both cities have lots to offer.


 Jacksonville, FL
 Lubbock, TX